Cash-First Programme: interim evaluation - updated
Interim findings from a process and impact evaluation of the Scottish Government's Cash-First Programme. The Programme supports new local partnership work to deliver Cash-First interventions across eight delivery partner areas.
Appendix 5: Service user survey respondent demographics
It should be noted that survey responses were received predominantly from two Delivery Partner areas.
Demographic breakdowns of the entire body of Cash-First beneficiaries in Delivery Partners areas are not available.
Therefore, we cannot comment on the representativeness of our survey demographics in comparison to all Cash-First beneficiaries.
Three quarters of survey respondents (75%) were female. One respondent replied with “Other”, clarifying that they were responding as a couple.
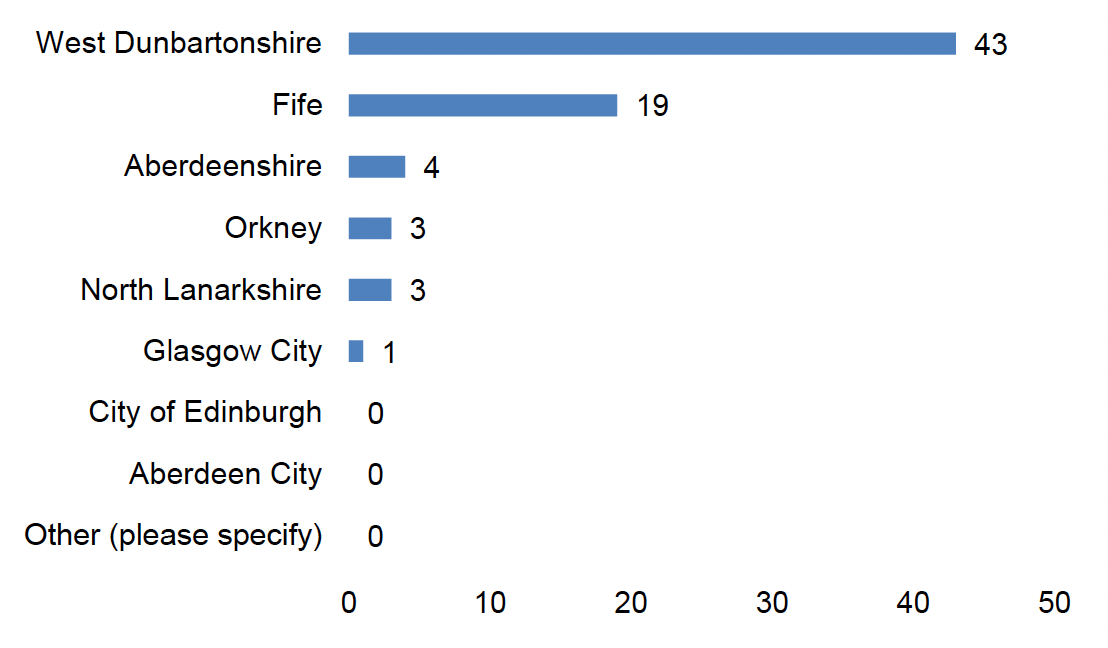
Over half of the respondents (59%) were located in West Dunbartonshire, with the second largest cohort (26%) living in Fife, Figure A5.1 highlights. Aberdeenshire, North Lanarkshire, and Orkney all have around 5% of the sample, with no respondents from Aberdeen City or Edinburgh City.
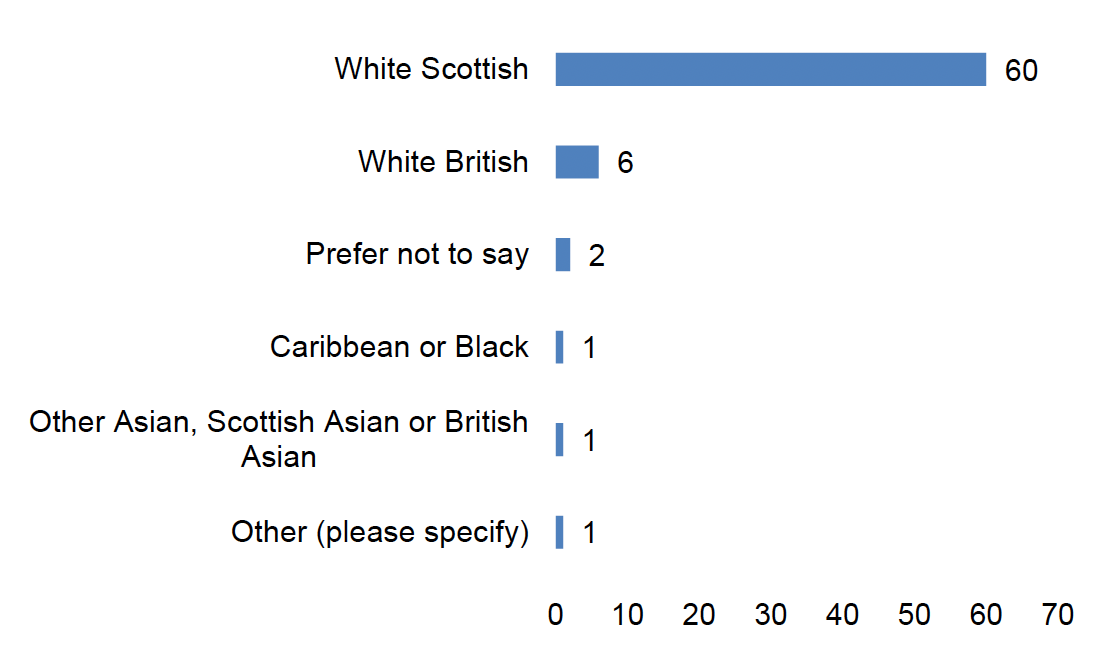
As shown in Figure A5.2, the vast majority (82%) of respondents identified as White Scottish, with White British (8%) being the second most commonly reported ethnic group. Other ethnic groups represented in the survey included “Other” Asian, Caribbean or Black, and Australian (1%, one response each).
Survey respondents were asked whether they had any physical or mental health conditions lasting or expected to last 12 months or more. Figure A5.3 shows that the majority of respondents (64%) declared that they had a long-term disability.
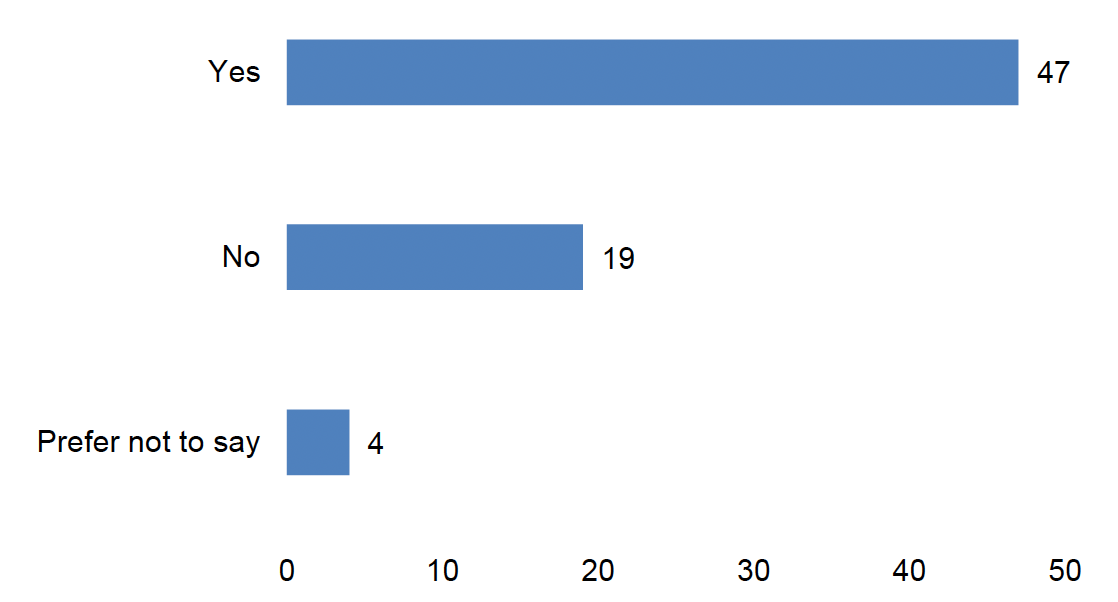
Figure A5.4 shows the number of adults in the household of each respondent. Over half of the respondents (56%) indicated they were the only adult in their household, with around a third (32%) of respondents having two adults in the household, and a small percentage (11%) with three or more.
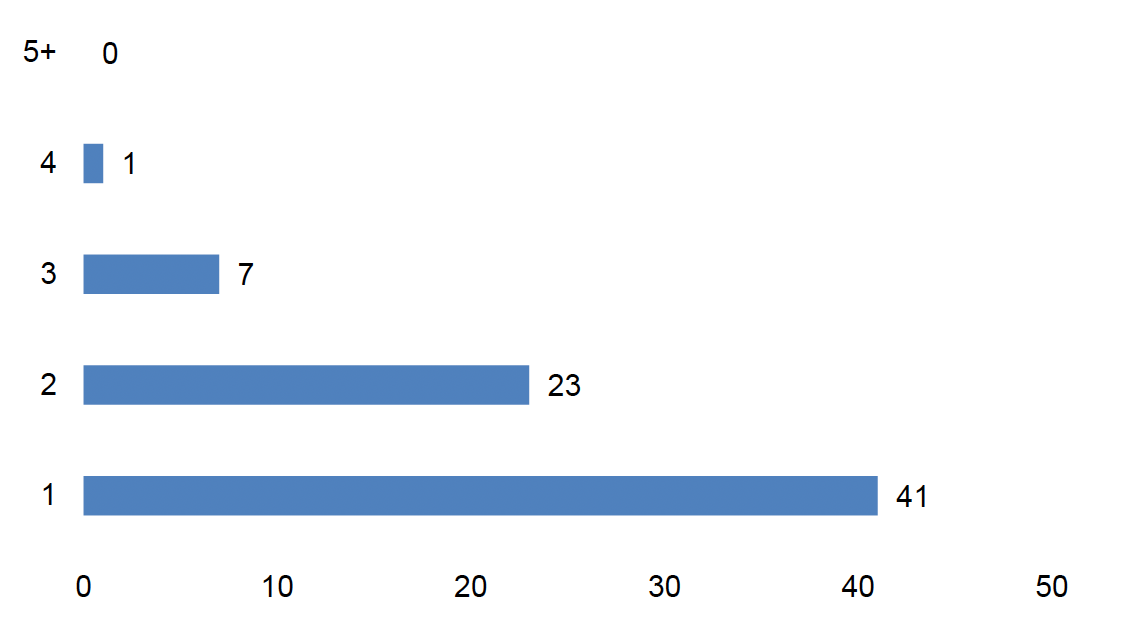
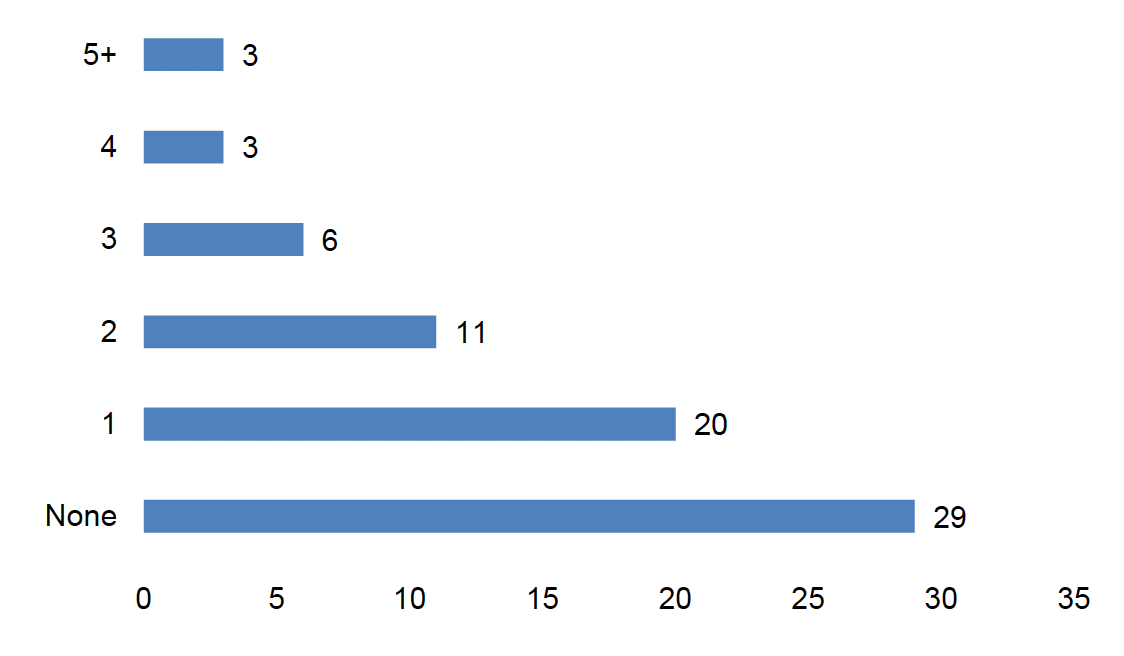
Respondents were asked how many children were in their household. As Figure A5.5 shows, the most common response was none (40%), however the majority of respondents have at least one child in the household. Almost half (41%) of respondents had one or two children in the house, with almost a fifth (16%) having three or more.
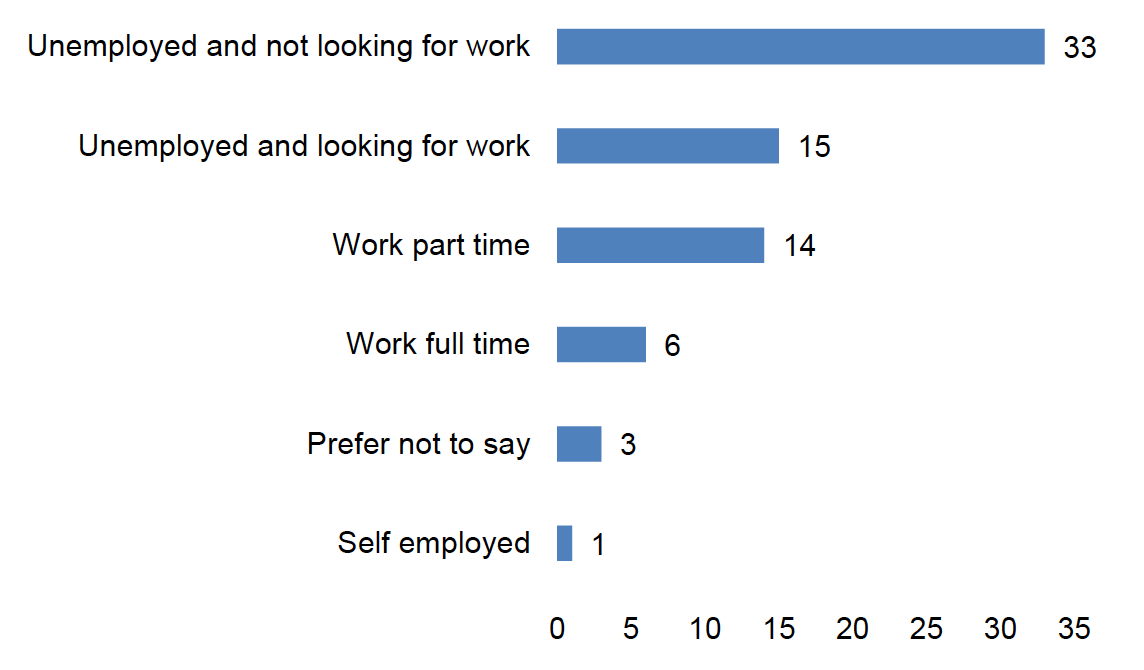
Two thirds of respondents (66%) reported that they were unemployed, with the majority (45%) not looking for work. Of those who work, most (19%) were working less than 35 hours a week, which is considered part time. A small number of the cohort (8%) also work full time, with one person also being self-employed, as highlighted by Figure A5.6.
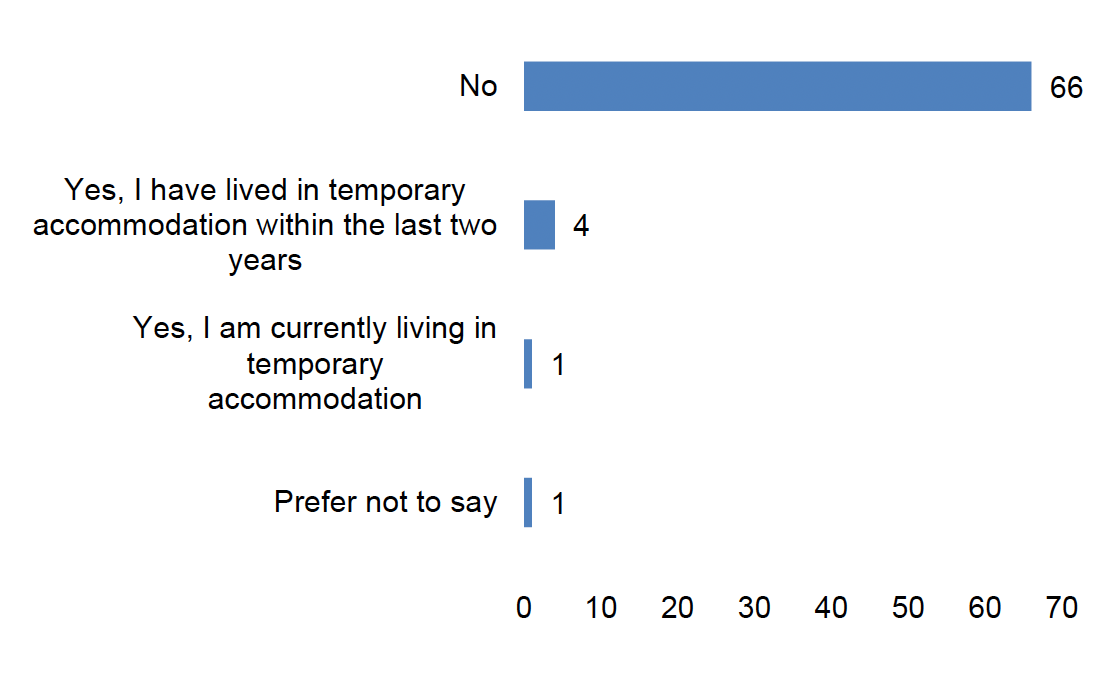
As shown in Figure A5.7, the vast majority of survey respondents (90%) stated that they were not currently living in or had not recently lived in temporary accommodation. 5% stated that they had lived in temporary accommodation within the last two years, while a further 1% of respondents stated that they are currently living in temporary accommodation.
Contact
Email: socialresearch@gov.scot