We use cookies to collect anonymous data to help us improve your site browsing
experience.
Click 'Accept all cookies' to agree to all cookies that collect anonymous data.
To only allow the cookies that make the site work, click 'Use essential cookies only.' Visit 'Set cookie preferences' to control specific cookies.
This report outlines the current position of the Scottish agricultural sector, with evidence aligned to the objectives in our Vision for Agriculture, and provides information on our approach to assessing new policy proposals as they are taken through secondary legislation.
A just transition is both an outcome – a fairer, greener future for all – and the process that must be undertaken in partnership with those impacted by the transition to net zero. Just transition is how we get to a net zero and climate resilient economy, in a way that delivers fairness and tackles inequality and injustice. This means agriculture plays its part in delivering a fairer, greener Scotland for all and that government policies must be developed in partnership with those we are asking to transition (i.e. farmers) so they deliver fairness and help to tackle inequality and injustice on the way to net zero.
2.3.1 Gross economic output from Scottish agriculture
As shown in Table 5, arable farming contributed the largest share of Scottish agricultural output in 2020, with a value of £742 million, or 27% of total output. Within arable farming, the largest components were barley and potatoes, at approximately £250 million each. The remaining output associated with arable was from wheat, oats, oilseed rape and other crops.
The next largest sectors were beef and dairy, with outputs of £584 million (21% of total output) and £425 million (15% of total output) respectively. Milk and milk production accounted for £367 million, or 13%, of Scotland’s agricultural output in 2020, which is roughly equivalent to the combined output associated with Scottish wheat and barley in 2020.
The value of Scottish agricultural output was worth over £2.7 billion in 2020
Specialist horticulture farms are those where more than two-thirds of their output is from fruit, vegetables, flowers, nursery stock or mushrooms. Total output from horticulture was £410 million in 2020, or 15% of Scotland’s total agricultural output, with the largest shares coming from vegetables (£197 million) and fruit (£171 million). Sheep contributed £229 million, or 8% of Scotland’s agricultural output in 2020, followed by other agricultural output (which includes other livestock / livestock products, eggs and clipwool), pigs and poultry.
2.3.2 Employment in Scottish Agriculture
Agriculture provided around 2% of total employment in Scotland in 2021, figures from the Business Register and Employment Survey show. This proportion varies across Scotland: agriculture accounted for 15% of employment in remote rural areas and 12% in accessible rural areas. Table 6 shows the agricultural workforce broken down by farm type.
Table 6. Agricultural workforce by farm type, June 2021
*Workforce numbers do not adjust for full time equivalent (FTE)
** Labour data was not available for all 4,568 specialist beef farms
*** Labour data was not available for all 635 specialist dairy farms
Specialist sheep (LFA) farms are the largest employer in terms of workforce numbers, with 21% of the Scottish agricultural workforce, whilst having the second lowest average workforce of just under 2 employees per holding. However, on specialist sheep (LFA) farms only 1% of the workforce are full-time employees, spread across 10% of holdings. 73% of specialist sheep (LFA) farm staffare occupiers and spouses.
In contrast, 79% of specialist dairy farms employ full-time staff, who make up 65% of the workforce. A relatively lower proportion of the workforce on specialist dairy farms (10%) are occupiers and spouses. Specialist beef farms are less likely to employ full time staff (31%), who represent 22% of the workforce.58% of specialist beef farm staffare occupiers and spouses.
Different crops have different labour requirements. Specialist cereal holdings rely on a mix of occupiers and spouses, accounting for 55% of the workforce, and employees, for 45%. On general cropping holdings 42% of labour is from occupiers and spouses and 58% from hired employees. Horticulture is more reliant on hired labour: 24% of the workforce are full- or part-time employees, while 62% are casual or seasonal staff.
Table 7. Agricultural workforce by employment type, June 2021
*Workforce numbers do not adjust for full time equivalent (FTE)
Based on the 2021 June agricultural census, there were 13,386 regular full-time staff, 7,712 regular part-time staff, 8,003 casual and seasonal staff, and 38,308 working occupiers / spouses.
2.3.3 Profitability in Scottish Agriculture
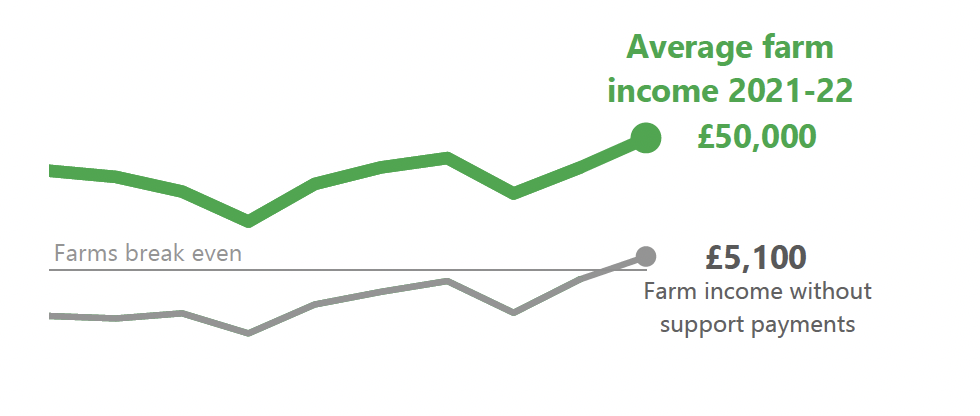
The average farm income[3], a measure of farm profit after costs, is estimated to be £50,000 in 2021-22 when support payment income is included. This is slightly above the average farm income level over the past nine years, as summarised in Figure 4. When support payments are excluded, average farm profits have mostly been negative over this period.
Figure 4. Average farm incomes with and without subsidy 2012-13 to 2021-22
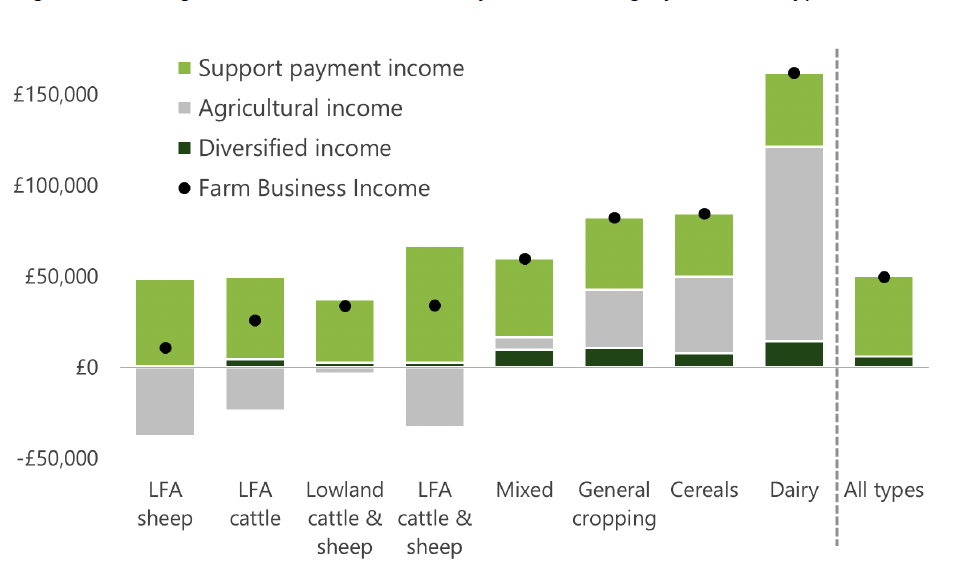
Figure 5 shows average level of farm income by farm type. The dots indicate the average overall farm business income. The grey, dark green and light green bars denote the contribution to overall farm business income from agricultural activity, diversified income and support payments. The figures show that in 2021-22, average profits were highest in commercial dairy farms (£162,100) and lowest in LFA sheep farms (£11,000). The chart also illustrates that in many areas of agriculture, primarily from sheep and cattle farms in both LFA and lowland areas, average income from agricultural activity, as denoted by the grey bars in the chart, was negative.
Figure 5. Average farm business income, by income category and farm type, 2021-22
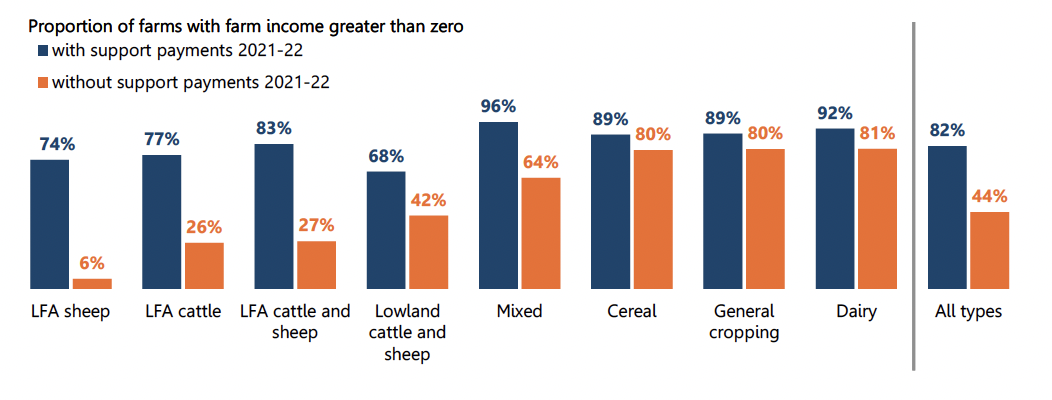
Support payments play an important role in farm income. Around 82% of all farms made a profit in 2021-22. Without support this would decrease to 44% of all farms.
Less than half of farms would have made a profit without support payments in 2021-22
The importance of support payments varies by farm type. It is of greatest importance to LFA cattle and sheep farms, whilst sectors such as cereals and dairy are comparatively less reliant on such payments to remain profitable.
Figure 6. Proportion of farms with agricultural output greater than input, 2021-22