Agriculture and Rural Communities (Scotland) Bill: supporting evidence and analysis
This report outlines the current position of the Scottish agricultural sector, with evidence aligned to the objectives in our Vision for Agriculture, and provides information on our approach to assessing new policy proposals as they are taken through secondary legislation.
2.2 High Quality Food Production
2.2.1 What food does Scotland produce?
The Scottish agricultural sector produces a wide array of food. Figure 3 displays estimates of the quantity of food produced in Scotland for human consumption in 2019 from the Economic Report on Scottish Agriculture (ERSA), measured by weight[1].
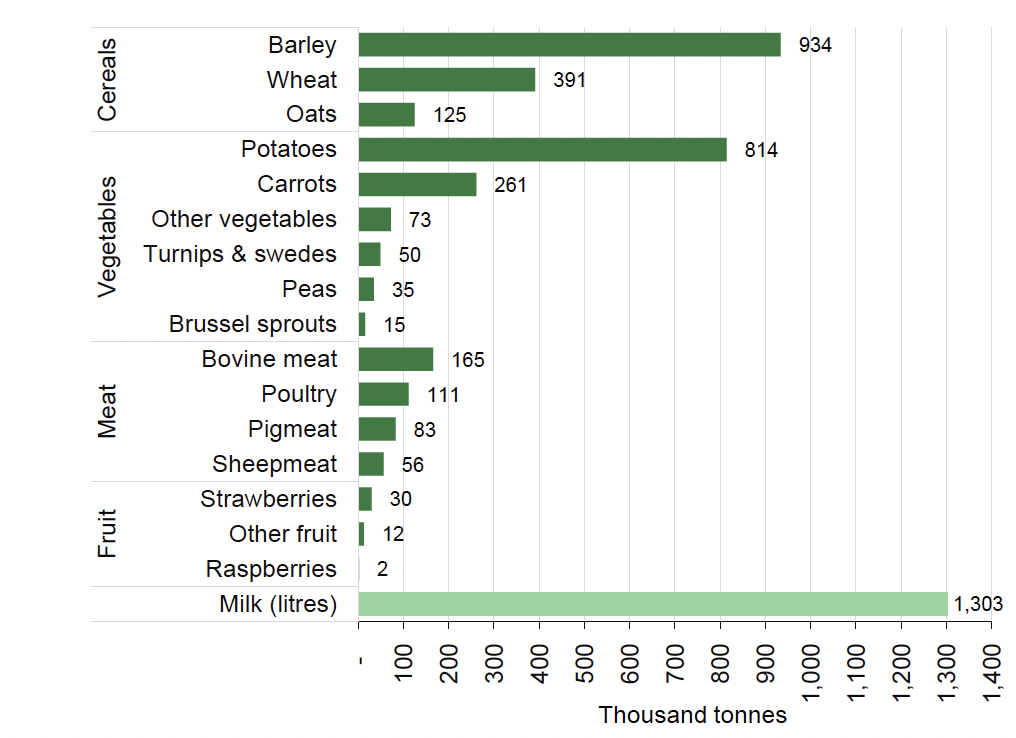
Over 1.4 million tonnes of cereals were produced in 2019, of which nearly two-thirds was barley (64%). In 2019 just over half (53%) of Scottish barley was sold to merchants for malting, while over one-third (36%) of barley was used as animal feed. Potatoes and carrots accounted for the vast majority (86%) of the 1.2 million tonnes of vegetables produced; in comparison, a relatively small amount of fruit was produced (44 thousand tonnes). Over 400 thousand tonnes of meat was produced, which was mostly (73%) red meat. The dairy sector produced just over 1.3 billion litres of milk – one litre of milk is just less than one kilogram – and more than 1.7 billion eggs were produced. This is in the region of 86 thousand tonnes (assuming an egg weighs 50 grams).
2.2.2 What is the calorie and protein content of food produced in Scotland?
Many of the calories produced in Scotland will be consumed outside of Scotland and many calories consumed in Scotland will have been produced elsewhere.This is reflected in the estimated breakdown of Scottish agricultural sales by geographic market over 2018-20, shown in Table 2 – this table covers all agricultural output, not just that for human consumption:
Sector |
Scottish production (Thousand tonnes) |
Proportion sold in Scotland |
Proportion sold to England & Wales |
Proportion sold to Northern Ireland |
Proportion sold to EU |
Proportion sold to non-EU |
|---|---|---|---|---|---|---|
Wheat |
852 |
~95% |
<5% |
<1% |
Neg. |
Neg. |
Malting barley |
944 |
~90% |
<10% |
Neg. |
Neg. |
Neg. |
Other barley |
854 |
~90% |
<5% |
3% |
3% |
Neg. |
Beef |
166 |
25% |
~66% |
<=2% |
7% |
<1% |
Sheepmeat |
63 |
20% |
58% |
Neg. |
21% |
Neg. |
Liquid milk |
1,312 |
~83% |
~17% |
Neg. |
Neg. |
Neg. |
Seed potatoes |
282 |
~21% |
~47% |
~1% |
7% |
24% |
Other potatoes |
807 |
10-11% |
86-88% |
~1% |
1-2% |
Neg. |
Source: Analysis on the Impact of Future UK FTA Scenarios on Scotland’s Agricultural Food and Drink Sector, report produced on behalf of the Scottish Government by the Andersons Centre. Note ‘Neg.’ is the abbreviation of negligible.
It is estimated that around 3 trillion Kcal calories and around 142 million kg of protein were produced in Scotland for human consumption in 2019. Table 3 identifies and groups the various outputs produced by farms in Scotland, showing the proportion of total calories (and grams of protein) for human consumption each account for. The share will be determined both by the volume of output and its calorie (or protein) richness.
Around 3 trillion Kcal calories and around 142 million kilograms of protein were produced for human consumption in Scotland in 2019
The methodology used for calculating calorie and protein production is based on, and broadly consistent with, that used in the UK National Food Strategy Report.
As this analysis focusses on estimating those calories (and proteins) produced for human direct consumption, it excludes three forms of agricultural activity. Firstly, it does not capture those calories/proteins from production that serves as inputs for the alcoholic drink industry, a sector which accounts for a large proportion of Scotland’s barley and wheat crops. Secondly, it excludes agricultural output destined for other supply chains that sit outside of food production such as biofuels. Finally, it excludes agricultural outputs which indirectly support Scottish food production, such as cereals used as seed or livestock feed.
Calories are generally regarded as the most widely used measure of energy in food. However, it is important to note that neither calories or protein give the full ‘nutritional picture’ which is highly complex.Nor is the calorific or protein content of different food products the only consideration when assessing the appropriate level and composition of food production. A wide range of other factors including consumer preferences for different products are also important. However, calorie and protein levels dogive a clear measure of the level of food production in Scotland with which to measure changes against. Another consideration is that, aside from variations in protein richness mentioned above, protein needs vary by a number of factors, including age and health levels.
Source |
Calories |
Protein |
|---|---|---|
Milk& dairy products |
29% |
34% |
Cereals |
29% |
22% |
Potatoes |
15% |
7% |
Pigmeat |
8% |
6% |
Bovine meat |
5% |
14% |
Eggs |
4% |
7% |
Sheepmeat |
3% |
4% |
Other crops |
3% |
2% |
Vegetables (excl. potatoes) |
2% |
1% |
Poultry |
1% |
3% |
Fruit |
<1% |
<1% |
Honey |
<1% |
<1% |
Total |
100% |
100% |
Source: Scottish Government Preliminary Analysis
The estimates in Table 3 suggest that nearly three-quarters (73%) of the calories produced for human consumption in Scotland came from milk & dairy products, cereals and potatoes. All meat combined accounted for a further 18%. In terms of protein, again milk, cereals and potatoes account for around about two-thirds (63%) while all meat combined accounted for a further 26%.These are two ways by which the contribution and relative size of various agricultural output can be measured. Other measures are similarly important to consider, such as economic value added (discussed in section 2.3), and will cause the relative size of outputs and sectors to vary.
It should also be noted that, in many cases, production will be bound by the land’s capability, and land used to graze and rear livestock has limits on its alternative agricultural use. Conversely, other land uses – like those to keep dairy herds and grow grain/cereal for human direct consumption – produce a large share of calories (milk & dairy products and cereal production collectively account for 58% of calorie production and 56% protein production), whilst utilising a smaller amount of land.
A similar distribution of calorie production is reflected in farm type as well (see Table 4). A quarter of total calories produced came from Specialist Dairy farms, while a further third is produced by General Cropping and Specialist Cereal farms.
It’s important to consider that consumers seek a balanced and varied diet, in addition to meeting their calorie and protein needs. As such an agricultural system focussed exclusively on producing produce with the highest calorific content would not necessarily be one which yields the balance of products that consumers place the greatest value upon. This is reflected in household spending habits. For example, figures from the ONS show that the average household in the UK devoted around 1% of their weekly food expenditure to potatoes in 2021-22. This is despite potatoes accounting for more than one-eighth (15%) of total calories produced in Scotland. This ONS data also shows that just over one-fifth (22%) of the average household’s weekly food expenditure was spent on meat products. This includes fresh, chilled or frozen meat, as well as processed and preserved meats.
Farm type |
Calories |
Protein |
|---|---|---|
Specialist Dairy |
25% |
29% |
General Cropping |
20% |
13% |
Mixed Holdings |
13% |
12% |
Specialist Cereals |
12% |
9% |
LFA Cattle & Sheep |
12% |
17% |
Specialist Pigs |
6% |
4% |
Specialist Poultry |
5% |
9% |
Remaining |
6% |
6% |
Total |
100% |
100% |
Source: Scottish Government Preliminary Analysis, doesn’t sum to 100% due to rounding
To give a more comprehensive picture of the value of Scottish food production, the Scottish Government is exploring the feasibility of mapping the nutrient density of Scottish food production. This will complement existing calorie and protein mapping, adding another dimension with which to assess future policy proposals against.
Contact
Email: richard.haw@gov.scot