Agriculture and Rural Communities (Scotland) Bill: supporting evidence and analysis
This report outlines the current position of the Scottish agricultural sector, with evidence aligned to the objectives in our Vision for Agriculture, and provides information on our approach to assessing new policy proposals as they are taken through secondary legislation.
Annex C. Maps
Maps showing: land capability for agriculture (1 is the highest quality, 8 is the lowest); peat coverage; sites of scientific interest and conservation areas; and suitability of land for woodland expansion.
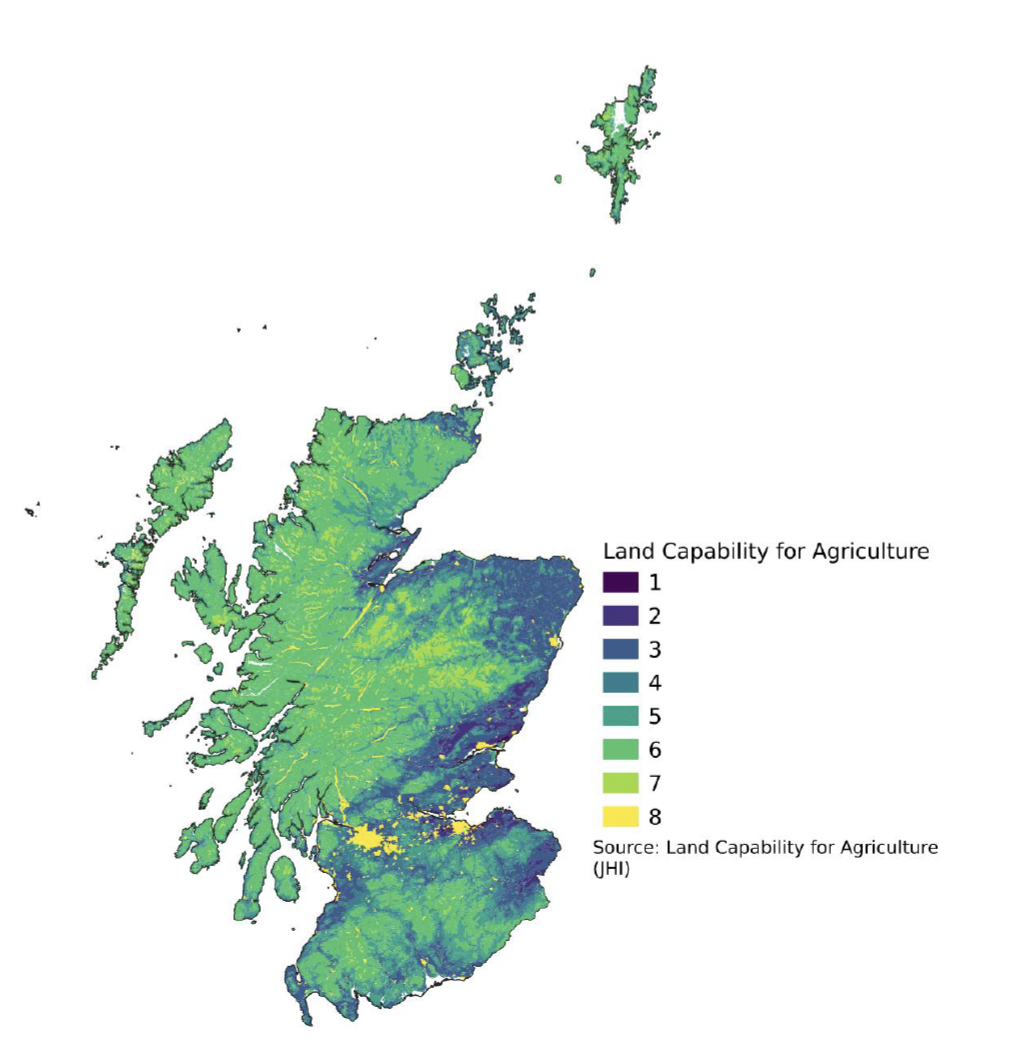
This map shows that the east coast of Scotland generally has a greater proportion of land in LCA 1, 2 and 3, while the Scottish borders and highlands and islands generally have a greater proportion of land in LCA 5, 6 and 7. Around two-thirds of Scottish land is LCA 5 or 6.
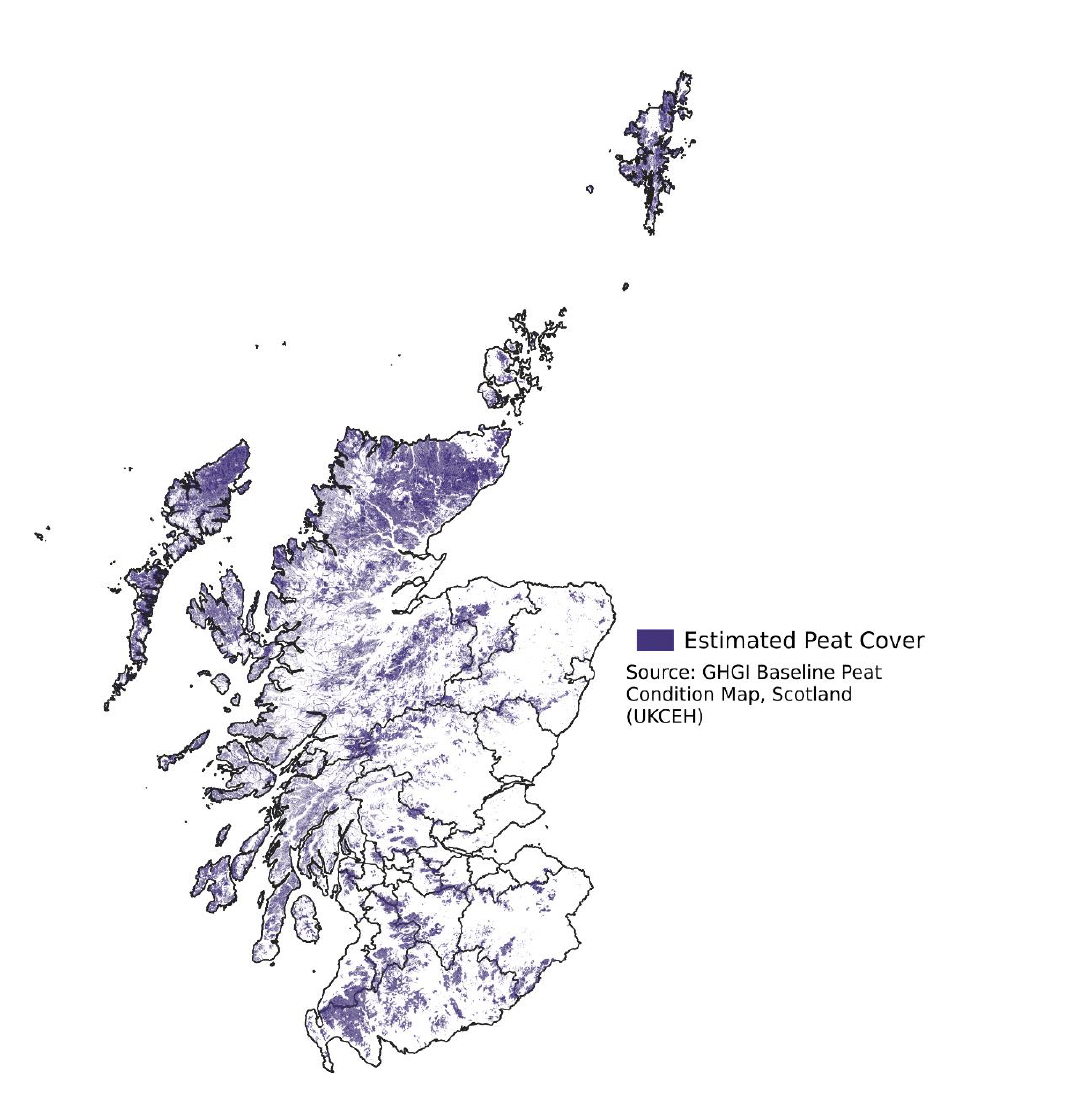
This map shows that estimated peat cover is highest in the north highlands and western and northern Isles. This is all types of peat, including near natural bog and degraded peat.
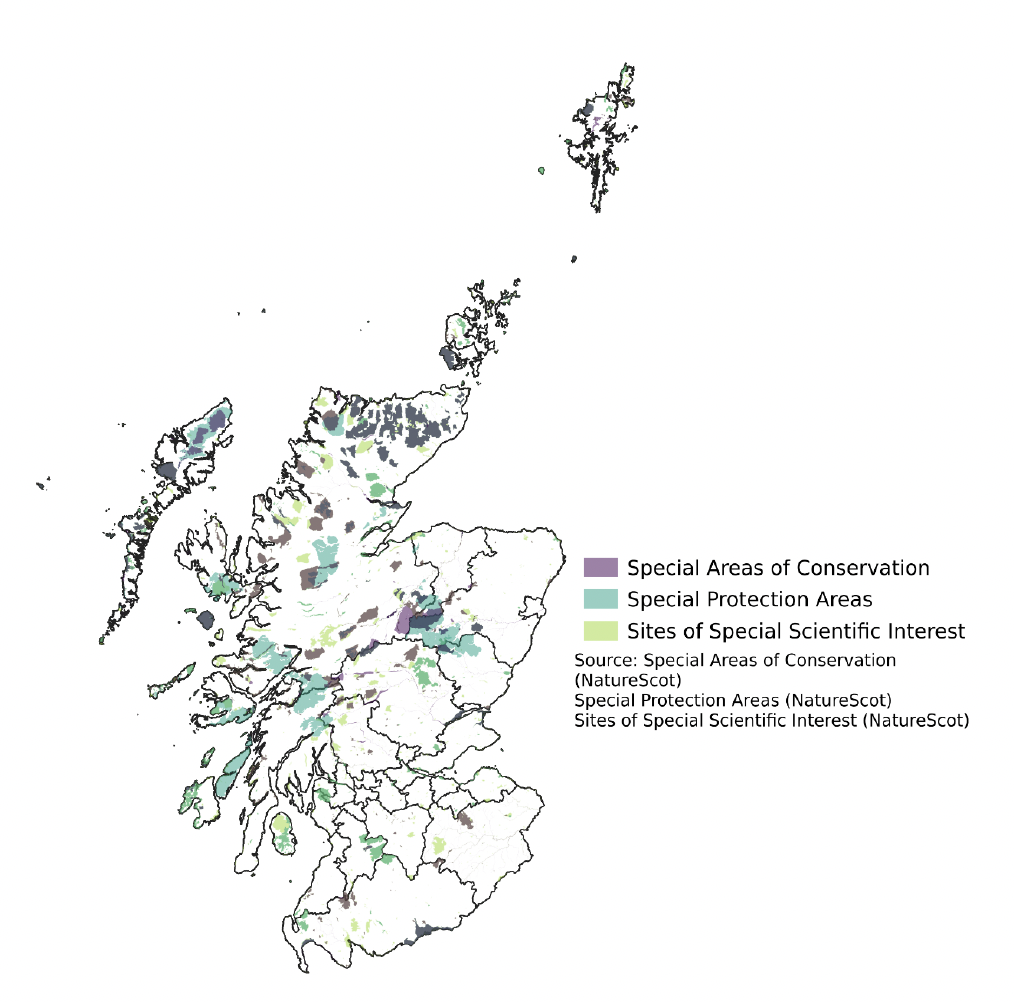
This map shows the location of sites of scientific interest and conservation areas, which are largely north of the central belt.
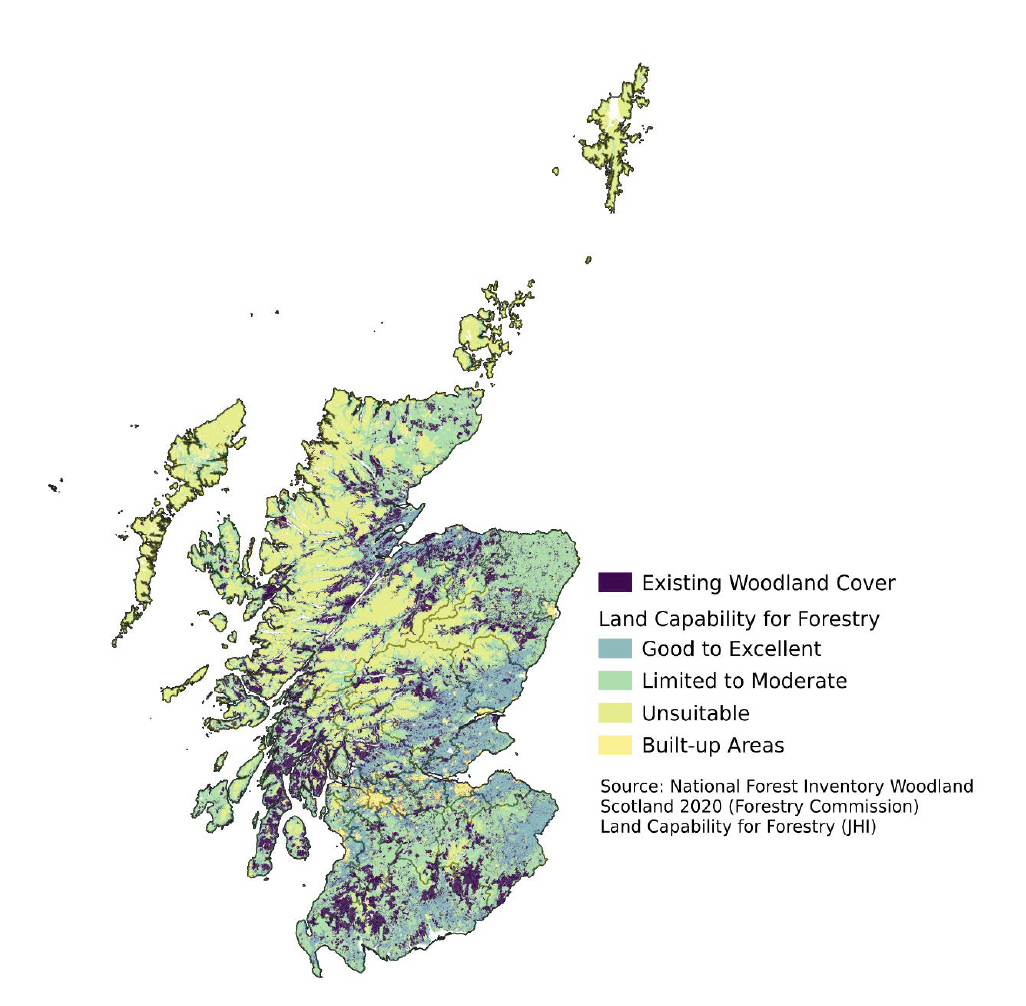
This map shows that land in the Tayside, Central and Fife region, as well as East Lothian and the south of Scotland, is good to excellent suitability for woodland expansion. It also shows that land in the highlands and islands is typically either existing woodland cover or is unsuitable for woodland expansion.
The Land Capability for Agriculture map produced by the James Hutton Institute (JHI) is a useful way of understanding the potential agricultural utility of land. The map itself is based on data from the 1960s and developed in the 1980s, however, the potential applications of land based on soil type and climate are not expected to have changed substantially over that time. JHI are currently working on a revised map of Land Capability for Agriculture that will improve the accuracy of the existing map.
The composite peat map developed by the UK Centre for Ecology and Hydrology is the most comprehensive available map of peat in Scotland, taking into account the JHI 1:250,000 scale Soils of Scotland map (1981) and data from the British Geological Survey 1:50,000 geological map of Britain (2011). While this composite map is the first unified map showing peat presence and absence across Scotland and is an improvement on existing peat mapping accuracy, it still has some limitations. The map is around 68% accurate at predicting the actual locations of peat and 84% accurate at predicting areas without peat. There is significant uncertainty surrounding the location of peat in Scotland, particularly in grassland areas.
The scientific interest map only covers onshore areas.
The National Forest Inventory only accounts for woodland and forests of greater than 0.5 hectares, so it is possible that smaller areas of woodland are not accounted for in the inventory. The Land Capability for Forestry map is built based on data collected in the Soil Survey of Scotland in 1988, and the map was built with limited field validation, so it is possible the boundaries between some polygons may be inaccurate. The Land Capability Map takes into account climate, wind throw, soil nutrients, topography, droughtiness, wetness, and soil when estimating suitability, much of which is not expected to have changed substantially since the data was collected.
Contact
Email: richard.haw@gov.scot