Agricultural Household Survey 2025 Report
Results from the Agricultural Household Survey 2025
2. Profile of agricultural households
2.1 Introduction
The survey asked respondents about who was living in the household and their role(s) across the farm and household to understand who lives in agricultural communities.
2.2 Household composition
Agricultural households were most likely to comprise two adults (46%), followed by single adult households (21%) and households with 3 or more adults with no children which may include multigenerational households or households with adult children (15%). Compared to the 2022 Census for Scotland, agricultural households were less likely to contain single adult households (21%) than the Scottish population (37%) and more likely to be households with 2 adults (46%) than the Scottish population (32%). Households with children was similar for agricultural households (18%) compared to the Scottish population (21%).
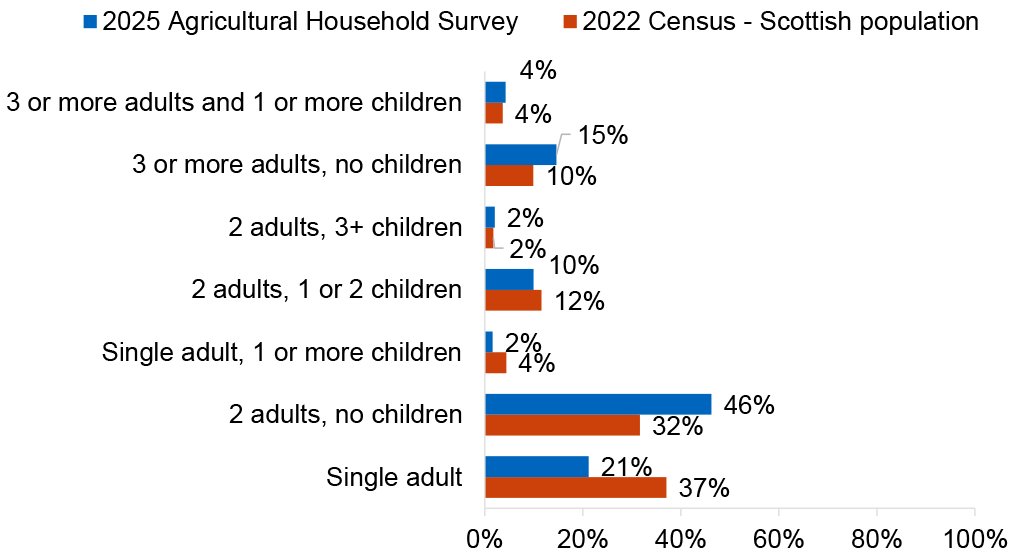
Base: Respondents, n=4,284
Just under 9 in 10 households with children had either one or two children in the household (86%) and 14% had 3 or more children. In terms of the age profile of children in the household, children were most likely to be aged 5-11 (44%). As households could have children within more than one age category, percentages sum to more than 100%.
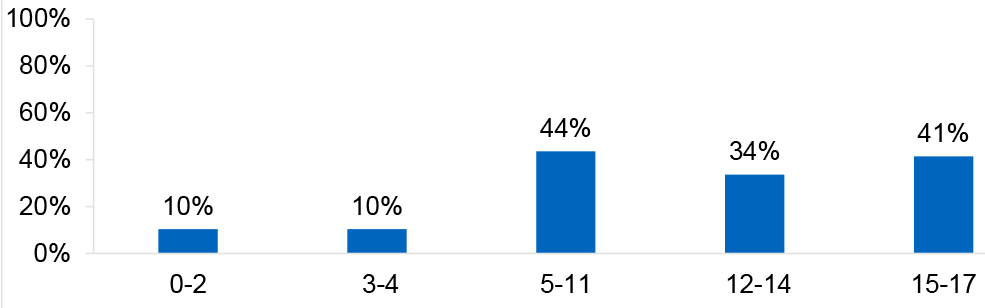
Base: Respondents, n=718
2.3 Role in the farm
Respondents were asked to select from a list which option best reflects their role in relation to the farm or croft. Respondents could select more than one option to describe their role. Just under two thirds of respondents said they were a farmer or crofter (64%), 36% said they were a farm or croft business owner and 20% described themselves as a farm or croft business partner. Almost nine in ten respondents who responded to this question identified as being an active farmer or crofter (87%) and 90% of households who responded had an active farmer living in their household. Throughout the report active farmers have been identified as respondents who said their role was at least one of the following options: Farmer/ crofter; Farm/ croft business owner; Farm/ croft business partner – equal (or close to); Farm/ croft junior partner; Paid worker on farm/ croft (including seasonal).
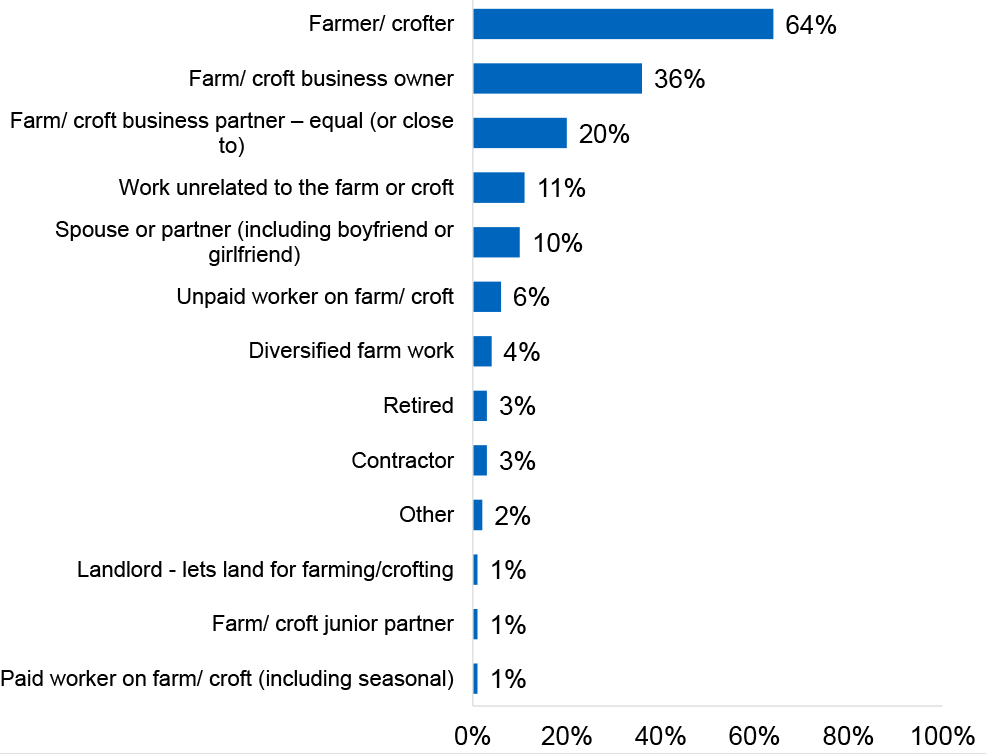
Base: Respondents, n=4,145
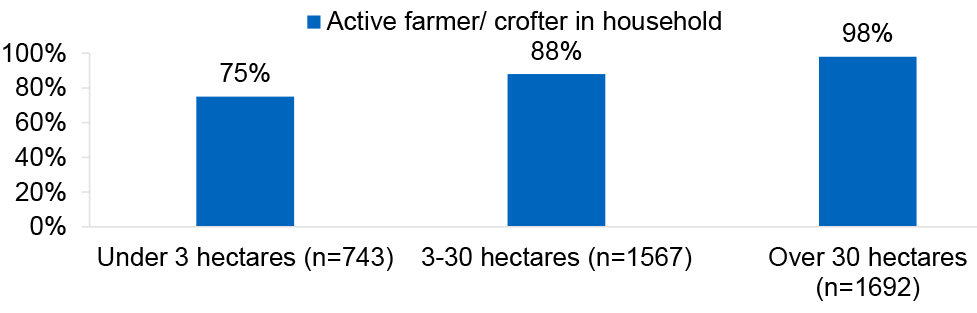
Analysis by farm size revealed that as farm size increased, the proportion of households with an active farmer or crofter also increased. For example, 75% of small farms/crofts under 3 hectares had an active farmer or crofter compared to 88% for small farms/croft between 3 and 30 hectares and 98% of farms that were over 30 hectares in size. All specialist dairy farms had an active farmer in the household compared to 77% of specialist poultry farms and 80% of general cropping and forage farms and crofts.
2.4 Respondent age and sex
In terms of age of respondents, 60% were aged 60 or over, 24% were aged 50-59, 11% were aged 40-49 and 5% were aged under 40. More respondents were male (66%) than female (34%).
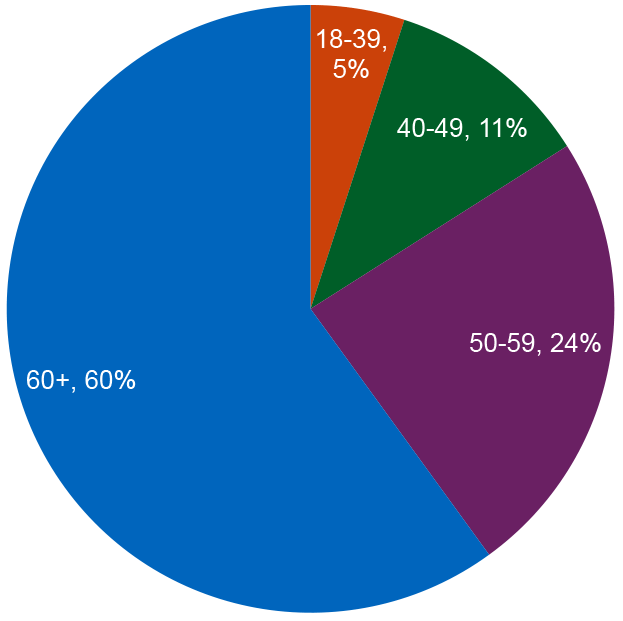
Base: respondents, n=3,996
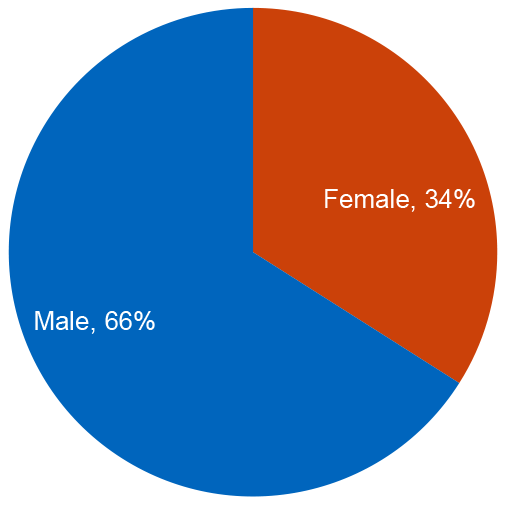
Base: respondents, n=3,654
Table 2.1 compares the age and sex profile of survey respondents overall with the age profile for active famers or crofters and for other respondents who were not active farmers or crofters. The age profile has also been compared to data derived from the Scottish Census 2022 for Scotland overall and also for those identified within the Census who worked in the agricultural sector.
Care should be taken when comparing these figures as the AHS is based on addresses with a BRN and includes tenants or those who may own farms or crofts, while the Census population data is for all people whose main occupation was within the agricultural sector (both past and present) and may include those who worked in agriculture but did not live within an agricultural household.
Nine in ten who responded (90%) said there was an active farmer in the household. As shown in Table 2.1, the AHS has a higher proportion of active farmers within the oldest age group (59% of respondents overall aged 60 or older) compared to 49% for those working in agriculture from the 2022 Census and 33% for the Scottish adult population overall. The AHS also has fewer respondents within the youngest age category with 6% of active farmers aged 18-39 compared to 23% for the 2022 Census for those in agricultural occupations, and 34% for the Scottish population overall. Active farmers were more likely to be male 68%, which is higher than 2022 Census data for Scottish adults overall (48%) and is lower than the percentage of agricultural workers identified in the Census (77%).
|
Census 2022 Scotland |
Census 2022 – Agricultural occupations | All AHS respondents | AHS Respondents - active farmer/ crofter | AHS Respondents - Non active farmer/ crofter | |
|---|---|---|---|---|---|
| 18-39 | 34% | 23% | 5% | 6% | 3% |
| 40-49 | 15% | 11% | 11% | 11% | 6% |
| 50-59 | 18% | 18% | 24% | 24% | 24% |
| 60 or older | 33% | 49% | 60% | 59% | 67% |
| Total | 100% | 100% | 100% | 100% | 100% |
| Base | 4,435,525 | 34,647 | 3,996 | 3,405 | 501 |
|
Census 2022 Scotland |
Census 2022 – Agricultural occupations | All AHS respondents | AHS Respondents - active farmer/ crofter | AHS Respondents - Non active farmer/ crofter | |
|---|---|---|---|---|---|
| Female | 52% | 23% | 34% | 32% | 49% |
| Male | 48% | 77% | 66% | 68% | 51% |
| Total | 100% | 100% | 100% | 100% | 100% |
| Base | 4,435,525 | 35,196 | 3,654 | 3,135 | 429 |
Contact
Email: socialresearch@gov.scot