Agricultural Household Survey 2025 Report
Results from the Agricultural Household Survey 2025
6. Distribution of household responsibilities
6.1 Introduction
Equality for women is in the Scottish Government’s vision for a fairer Scotland, but gender inequality still exists in Scotland. Within the Scottish Social Attitudes Survey 2019 and in Scotland’s Gender Equality Index 2023 a trend exists with women being more likely to be responsible for taking care of children and household chores.
This section of the report was analysed for households with opposite sex marriages to understand how gender influences household decisions and decisions on personal finances within agricultural households.
6.2 Responsibility for household tasks
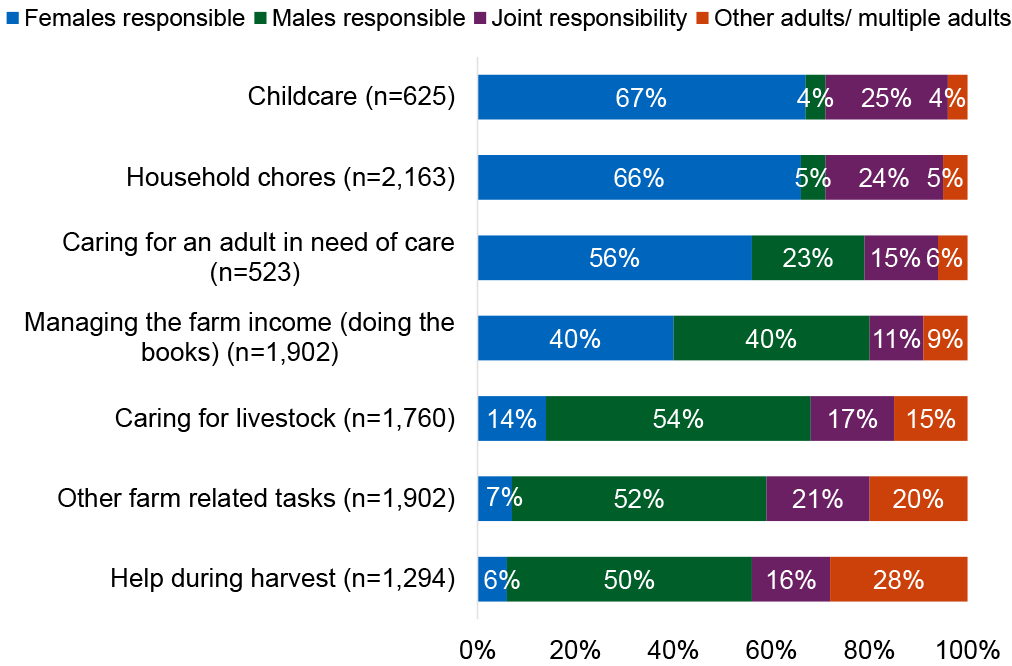
The survey included a number of questions about household responsibilities for various tasks. This section has been analysed by those who were in opposite sex marriages to identify gender roles in relation to these tasks. For each question, respondents were asked whether they were responsible, their partner was responsible, another adult in the household was responsible or an employed person or a child was responsible. Respondents who answered don’t know or not applicable have been excluded from this analysis.
Figure 20 shows that females (either where the respondent was female or the partner was female) were most likely to be responsible for tasks such as childcare (67%), household chores (66%) and caring for adults in need of care (56%). On the other hand, males were more likely to be responsible for caring for livestock (54%), and other farm related tasks (52%).
6.3 Responsibility for household decisions
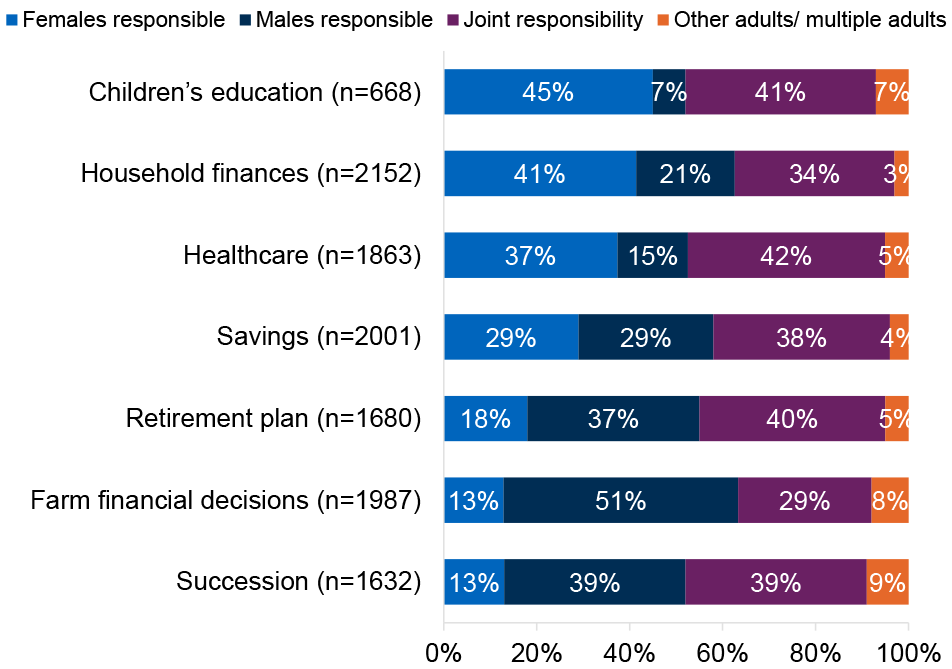
In terms of household decision responsibilities, respondents were asked to identify whether they were responsible for each decision or whether it was their partner, joint responsibility, another adult in the household or someone else. This analysis has been filtered where the respondent said they were married or in a civil partnership and they and their partner were different sexes.
As shown in Figure 21 females were more likely to have responsibility in areas such as children’s education, household finances and healthcare. On the other hand, males were more likely to be responsible for decisions in farm finances, retirement and succession plans. In terms of household decisions, there are higher levels of shared or joint responsibility compared to household tasks with joint responsibility being most common for healthcare, children’s education and retirement plan decisions.
6.4 Personal income
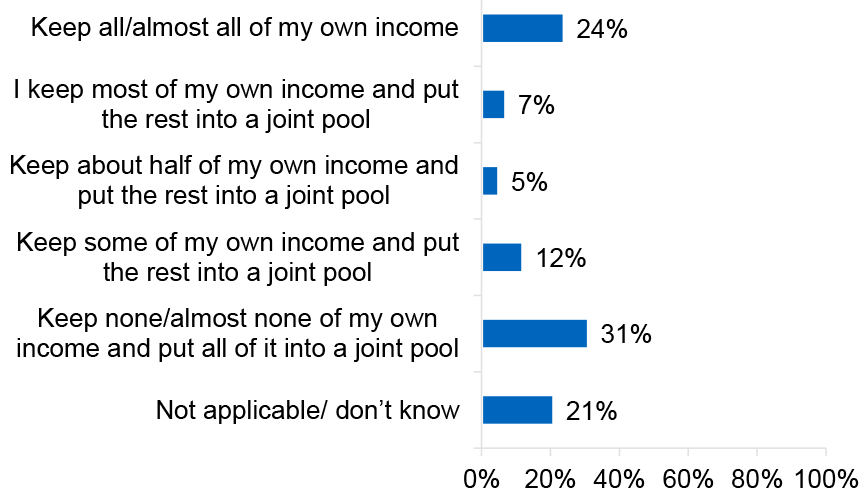
Respondents were asked to select from a list of options, which statement comes closest to what they do with their own personal income. Around one quarter (24%) said they kept all or almost all of their own income while 31% said they did not keep any or almost none and put it into a joint pool. One fifth of respondents (21%) answered don’t know or said this question was not applicable to them. Married respondents and those in civil partnerships were less likely (13%) to say they kept all or almost all of their income than those who were never married (49%), separated (50%), divorced (57%) or widowed (62%).
Base: respondents, n=4,067
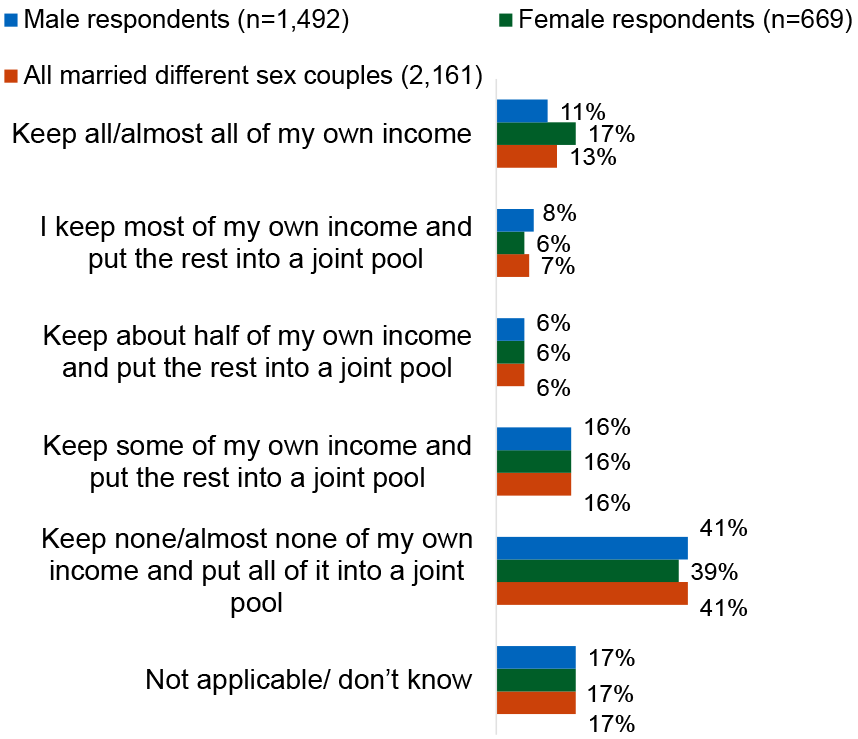
Couples in opposite sex marriages were less likely to say they would keep all or almost all of their own income (13%) than respondents overall (24%). Of those who were in opposite sex marriages, more females said they keep all or almost all of their own income (17%) than males (11%). The Scottish Social Attitude Survey 2019 revealed a similar trend with more women stating they keep all of their own income than men.
6.5 Role of adults in household who do not work
All respondents were asked whether, if there were any adults in the household who do not do paid work, what the primary reasons were for this. Over half of households (54%) had adult(s) not in paid work and 46% said this question was not applicable. The main reasons given for adults not being in paid work were due to retirement (63%), where they were doing unpaid farm work (32%), where they had household responsibilities (19%) or due to ill health (13%).
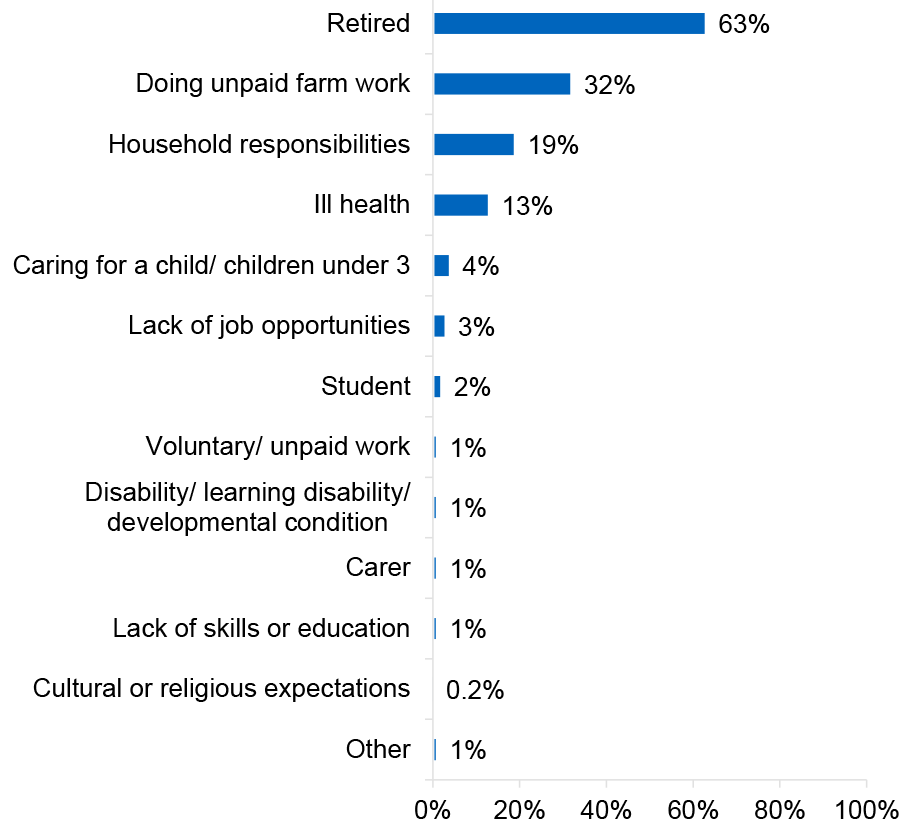
Base: respondents, n=2,052 (excludes % stating not applicable)
Single adult households and households with 2 adults and no children were most likely to say adults in the household were not working as they were retired (78% and 72% respectively). Households with children were more likely than households with no children to say adults in the household were doing unpaid farm work (52%), were caring for children under 3 (18%) and were not working due to household responsibilities (36%).
6.6 Perception of gender roles
Most respondents (94%) strongly agreed or agreed that men and women should have equal rights in terms of making decisions, with 63% strongly agreeing with this statement. One per cent of respondents disagreed or strongly disagreed on men and women having equal rights and 6% had a neutral opinion. Females were more likely to strongly agree with this statement (73%) than males (57%). Single adults with children were less likely to agree that men and women should have equal rights in terms of making decisions (37%) than all other household compositions (between 56% and 70% for other household compositions).
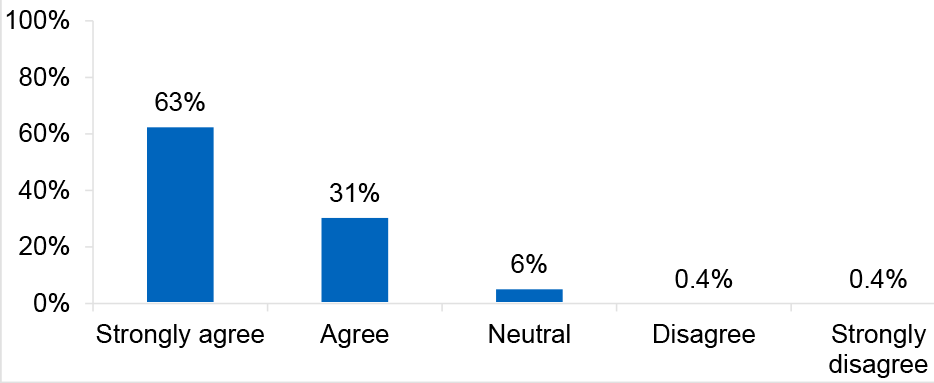
Base: respondents, n=4,176
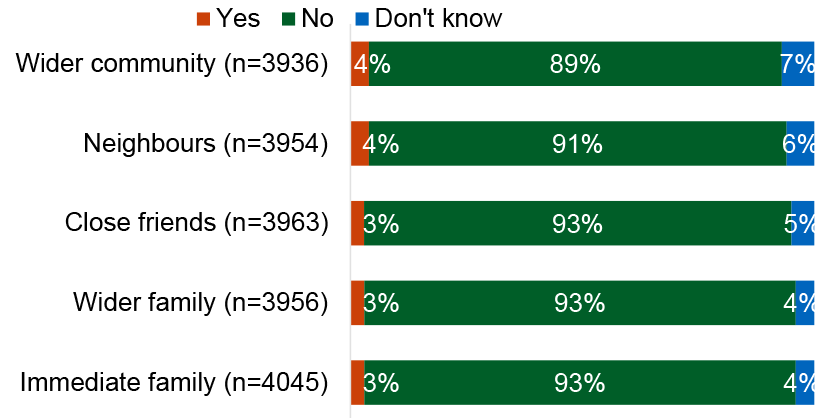
All respondents were asked if they feel uncomfortable talking to different people such as the wider community, neighbours, friends and family about agricultural opportunities for women and girls. Most respondents said they did not feel uncomfortable talking about this and were most likely to feel comfortable talking to close friends (93%), wider family (93%) and immediate family (93%) and slightly less comfortable talking about this with the wider community.
Contact
Email: socialresearch@gov.scot