Agricultural Household Survey 2025 Report
Results from the Agricultural Household Survey 2025
4. Skills
4.1 Introduction
Within the survey it was important to understand the current skills, qualifications, training needs and digital capabilities of adults working on farms and crofts in Scotland. The information was to help identify strengths, gaps and areas where further support or development may be useful.
4.2 Qualifications and CPD
Respondents were asked about their qualifications. Just under half (45%) said they had O Grade, Standard Grade, National 3, 4, or 5, Intermediate 1 or 2 or equivalent. Just under a third were educated to degree level or higher (32%) and 15% had no qualifications.
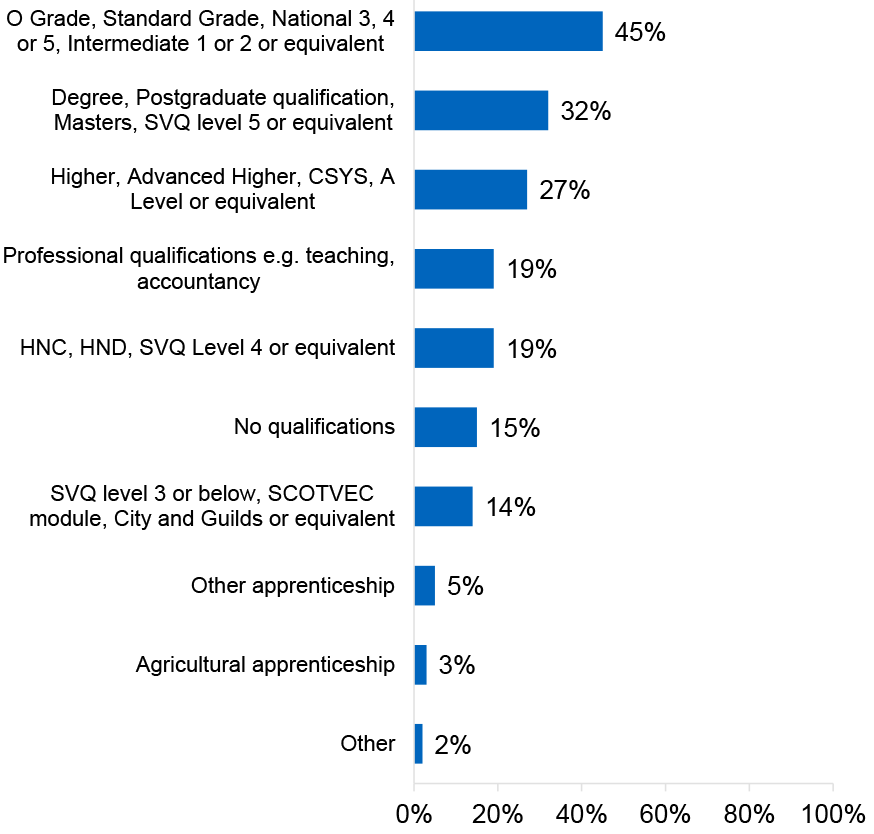
Base: respondents, n=4,093
Further analysis indicated that female respondents were more likely to be educated to degree level or higher (42%) than male respondents (28%). Female respondents were also more likely to have a professional qualification (27%) than male respondents (15%). On the other hand, male respondents were more likely to say they had no qualifications (15%) than female respondents (9%). Age based analysis indicates that older respondents aged 60 and over were more likely than all other age groups to say they had no qualifications (20%).
Where the respondent was not an active farmer or crofter, they were more likely to have a professional qualification such as teaching or accountancy (25%) than respondents who were active farmers or crofters (18%).
Analysis by farm type revealed that respondents from specialist horticulture & permanent crops farms and crofts were more likely to have a degree (61%) than respondents from specialist dairy farms and crofts (24%). Where respondents had no qualifications they were most likely to be from general cropping and forage farms and crofts (21%) compared to 2% of specialist dairy farms and crofts.
Respondents who lived in Scottish islands (20%) were more likely to have said they had no qualifications than respondents who lived in mainland Scotland (13%). Those who lived in mainland Scotland were more likely to be educated to degree level or higher (34%) than respondents who lived on Scottish islands (25%).
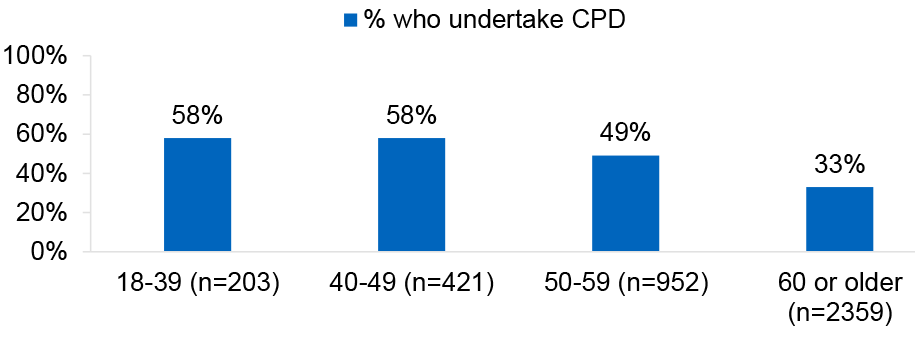
Following on from this, it was explained to respondents that Continuing Professional Development (CPD) is about maintaining and developing any type of learning that increases knowledge, skills, understanding and experiences of a subject area or role. Four in ten respondents (41%) said they had undertaken CPD and this was more likely to be undertaken by active farmers and crofters (44%) than those who were not an active farmer or crofter (21%). Respondents were asked simply whether they had undertaken CPD with no clear timescale noted within the question wording.
Analysis by age reveals that respondents over the age of 60 were least likely to have undertaken CPD (33%) and those aged under 50 (58%) were most likely. Those who had sought help for a stress, emotional or mental health problem in the last year were more likely to have undertaken CPD (52%) than those who had not sought help (40%).
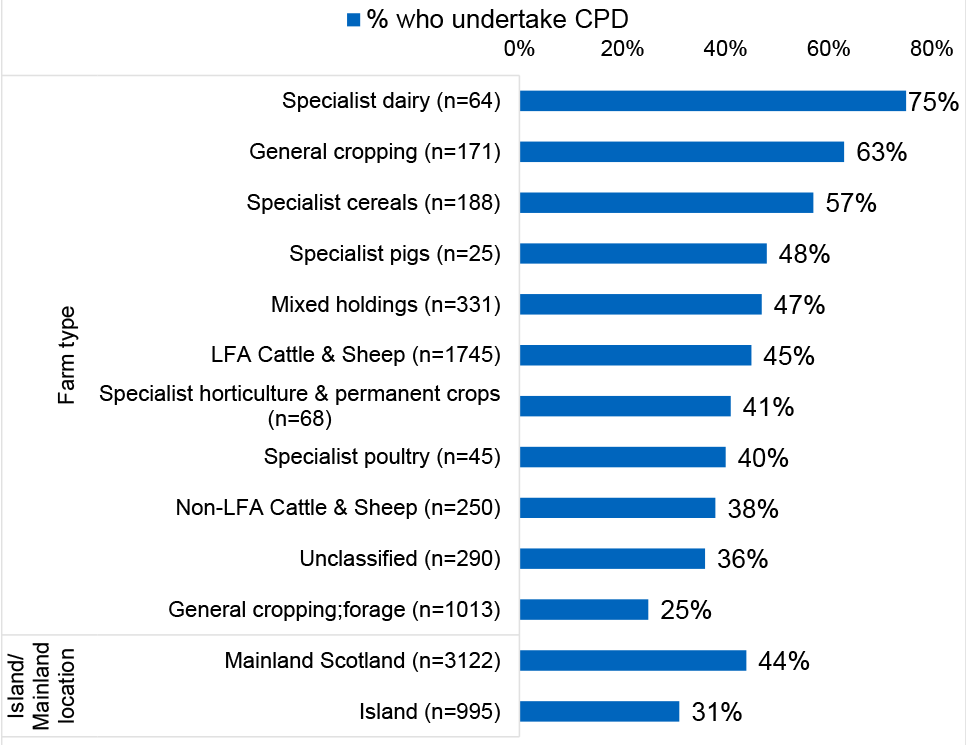
Farms and crofts on Scottish islands were less likely to participate in CPD (31%) than those who lived on farms and crofts in mainland Scotland (44%). Also, those who lived on specialist dairy (75%), general cropping (63%) and specialist cereals (57%) farms or crofts were more likely to undertake CPD than general cropping (forage) farms and crofts (25%).
4.3 Skills farmers and crofters want to improve
A majority of respondents believed adults working on the farm had skills that required improving (58%). This was most likely to be regarding computer literacy and basic IT skills (26%), followed by adapting to new equipment or materials (22%). Other areas where skills were lacking were manual dexterity (19%), specialist knowledge to perform the role (18%) and creative and innovative thinking (17%). Just over a third (34%) said adults on the farm did not need to improve any skills and 8% were unsure.
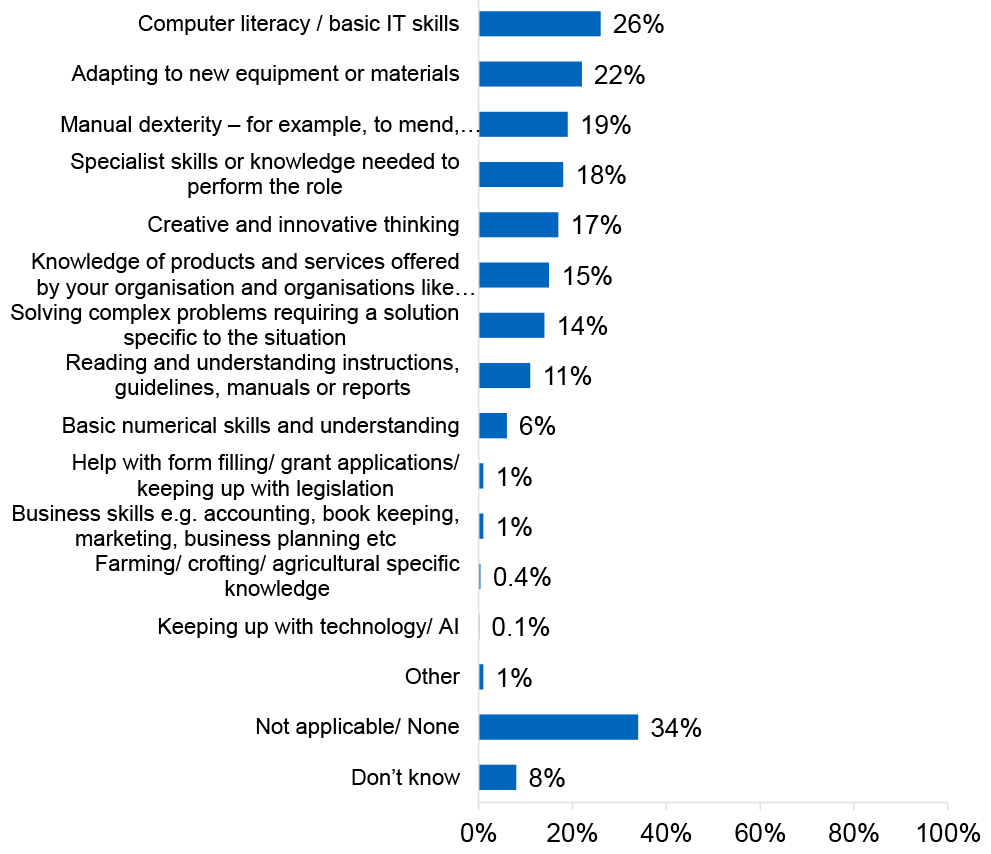
Base: respondents, n=4,112
Respondents aged 60 or over (55%) were least likely to say there were adults on the farm who needed skills improving compared to 63% of respondents aged 50-59, 67% of respondents aged 40-49 and 68% of respondents under 40. For all types of skills, respondents aged over 60 were the least likely to say that those skills were needed. The exception is computer literacy and basic IT skills, where 28% of respondents aged over 60 said this was needed (compared to 22% of respondents aged 40-49).
Analysis by sex shows that male respondents were more likely to say adults on the farm were lacking computer literacy or basic IT skills (31%) than female respondents (20%). Where respondents said they personally would need support providing detailed information to a government department online such as completing a tax return or benefit application, they were more likely to say there were adults on the farm who were lacking in IT and computer skills (41%) than respondents who were able to complete this information themselves (17%). Where respondents said their internet connection was unreliable they were more likely to say there were adults who were lacking in IT and computer skills (38%) than those who said their internet connection was very reliable (19%).
In terms of farm type, specialist cereals (65%), LFA cattle and sheep (65%), specialist dairy (72%) and general cropping (69%) farms and crofts were more likely to say there is a need for skills to be improved than cropping and forage farms and crofts (45%). Computer literacy and basic IT skills was most likely to be mentioned by those who lived in specialist dairy farms or crofts (38%) and least likely for specialist horticulture & permanent crops sites (12%). Specialist skills or knowledge needed to perform the role was most likely to be needed for specialist dairy farms and crofts (33%) than for specialist poultry (14%), general cropping and forage (14%) and non-LFA Cattle & Sheep farms (15%).
Respondents who said there were no skills lacking on the farm were more likely to not be active farmers or crofters (58%) than active farmers or crofters (30%).
4.4 Digital confidence and access
In terms of digital confidence, 87% were able to make a payment or purchase online, such as paying for a TV licence by themselves, 9% said they would need support doing this and 3% were unsure or said this was not applicable. Around the same number (86%) were able to provide basic information to a government department online, such as updating their address by themselves and 11% would need support. Fewer respondents (52%) could provide detailed information to a government department online, such as completing a tax return or benefit application by themselves, 41% said they would need help completing this.
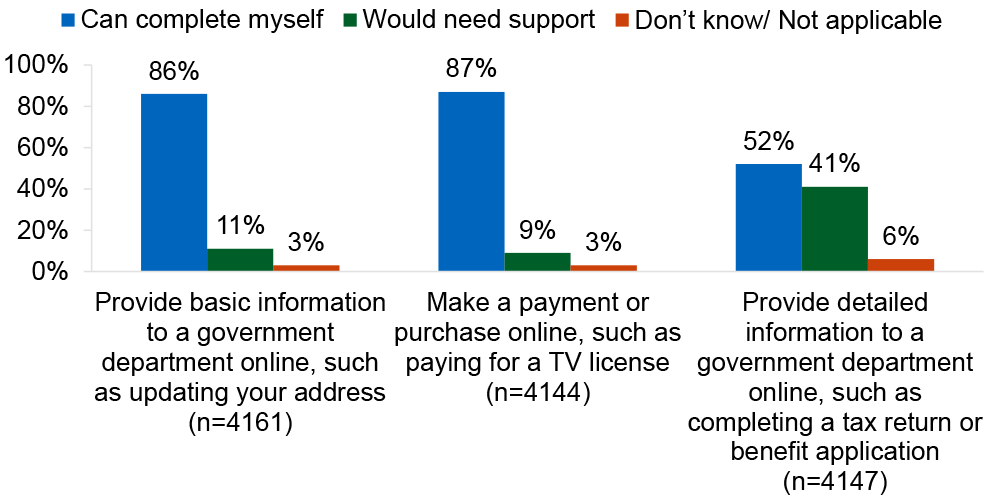
Active farmers and crofters were more likely to say they would need help providing detailed information to a government department online (44%) than respondents who were not active farmers or crofters (26%). Those who said they were contractors (56%) and farm or croft junior partners (56%) were most likely to say they would need support with this. Respondents aged under 40 (45%), males (46%) and those who had a physical or mental condition that affects their day to day life (49%) were most likely to need support providing detailed information to a government department online.
Around one quarter of respondents (27%) said their internet connection was very reliable, a further 51% said it was fairly reliable, 12% considered it to be not very reliable and 6% felt it was unreliable. Just 3% of respondents did not have internet access. It should be noted however that 80% of surveys were completed via email or online and those who responded to the survey in this way are likely to have internet access in some form and therefore we may have an overrepresentation of those with internet access.
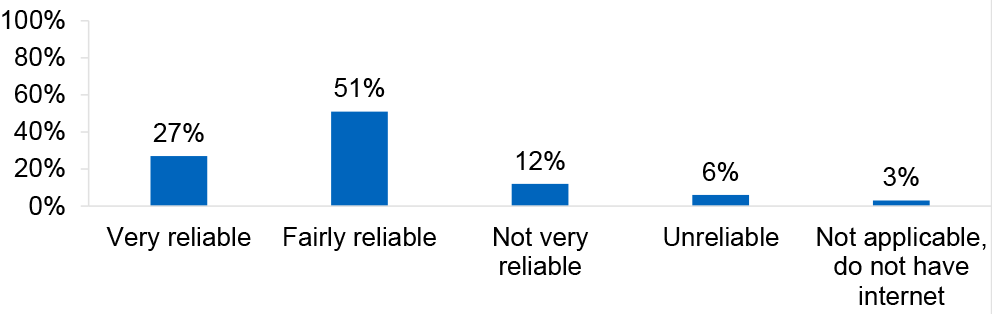
Base: respondents, n=4,220
Analysis by the urban rural 6 fold classification indicates that those who lived in other urban areas were more likely to say their internet connection is very reliable (41%) than those who lived in accessible rural (27%) and remote rural locations (26%).
Table 4.1 Internet reliability analysed by local authority shows that farms and crofts in Stirling (39%) and in East Renfrewshire (38%) were most likely to say their internet service was very reliable.
| Local authority | Base | Very reliable | Fairly reliable | Not very reliable | Unreliable | No internet |
|---|---|---|---|---|---|---|
| Stirling | 67 | 39% | 48% | 4% | 6% | 3% |
| East Renfrewshire | 16 | 38% | 38% | 25% | - | - |
| Eilean Siar | 447 | 33% | 51% | 7% | 3% | 5% |
| East Dunbartonshire | 10 | 30% | 50% | 10% | 10% | - |
| Scottish Borders | 258 | 29% | 59% | 8% | 3% | 1% |
| Fife | 119 | 29% | 51% | 13% | 6% | 1% |
| Aberdeen City | 14 | 29% | 50% | - | 14% | 7% |
| Aberdeenshire | 490 | 29% | 45% | 16% | 6% | 5% |
| Renfrewshire | 24 | 29% | 29% | 25% | 13% | 4% |
| South Ayrshire | 75 | 28% | 60% | 8% | 4% | - |
| Dumfries & Galloway | 387 | 28% | 55% | 10% | 4% | 2% |
| East Ayrshire | 94 | 27% | 56% | 6% | 6% | 4% |
| South Lanarkshire | 105 | 27% | 54% | 15% | 3% | 1% |
| Highland | 935 | 27% | 51% | 12% | 6% | 4% |
| Perth & Kinross | 195 | 26% | 50% | 13% | 10% | 1% |
| West Lothian | 39 | 26% | 44% | 26% | 3% | 3% |
| North Ayrshire | 53 | 25% | 49% | 17% | 8% | 2% |
| Argyll & Bute | 177 | 25% | 46% | 19% | 7% | 3% |
| Orkney Islands | 153 | 24% | 54% | 10% | 8% | 3% |
| Angus | 120 | 22% | 43% | 16% | 17% | 3% |
| Midlothian | 14 | 21% | 57% | 21% | - | - |
| West Dunbartonshire | 10 | 20% | 30% | 20% | 20% | 10% |
| East Lothian | 52 | 19% | 56% | 15% | 10% | - |
| Shetland Islands | 159 | 19% | 52% | 18% | 9% | 2% |
| Falkirk | 22 | 18% | 55% | 9% | - | 18% |
| Moray | 102 | 18% | 54% | 15% | 9% | 5% |
| North Lanarkshire | 23 | 13% | 61% | 17% | - | 9% |
| Clackmannanshire | 11 | 9% | 55% | 27% | - | 9% |
| Edinburgh (City of) | 5 | - | 100% | - | - | - |
| Inverclyde | 4 | - | 100% | - | - | - |
On the other hand, those living in West Dunbartonshire (20%), Angus (17%), Aberdeen (14%) and Renfrewshire (13%) were most likely to say their internet connection was unreliable. This may be affected by the location of the household within the local authority area. Care should be taken when reading these results due to the small number of responses from some local authorities.
4.5 Diversified farm business
Respondents were asked whether they had any agricultural or non-agricultural diversified business on their farm or croft. It was explained that agricultural diversified business could include agrotourism, farm shop, haulage, contract work and Agri services and that non-agricultural diversified business could include businesses such as livery yards, large scale farm shops, restaurants, childcare, outdoor nurseries and renewable energy production. A majority said there was no agricultural or non-agricultural diversified business on their farm or croft (69%), 30% said there was non-farm diversified business taking place on their farm or croft with 17% stating this was agricultural diversified business and 15% said there was non-agricultural diversified business. Just 2% of households said there were both agricultural and non-agricultural diversified businesses on their farm or croft.
As farm size increases, the incidence of non-farm diversified business also increases, for example 1 in 5 farms or crofts under 3 hectares answered yes to this question (20%), compared to 25% of farms that were between 3 and 30 hectares and 39% for farms or crofts that were over 30 hectares. Specialist cereals farms and crofts were also more likely to have non-farm diversified business (43%) and specialist poultry (20%) and general cropping and forage farms (22%) were least likely. Where respondents lived in Scottish islands they were less likely to have answered yes to this question (20%) than farms and crofts in mainland Scotland (33%).
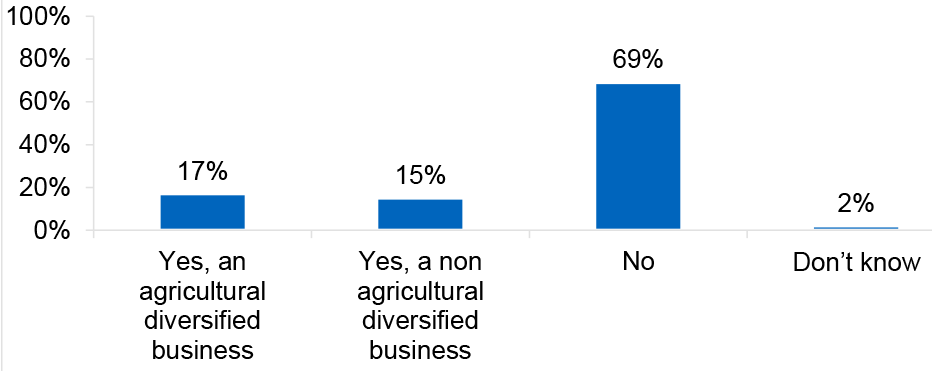
Base: respondents, n=4,209
Where there was diversified business on the farm or croft, this was most likely to be run by the respondent (75%), and a further 33% said it was run by a partner. Please note percentages sum to over 100% as respondents could select more than one response. Over one in five respondents (22%) said there were multiple people who help run the non-farm diversified business.
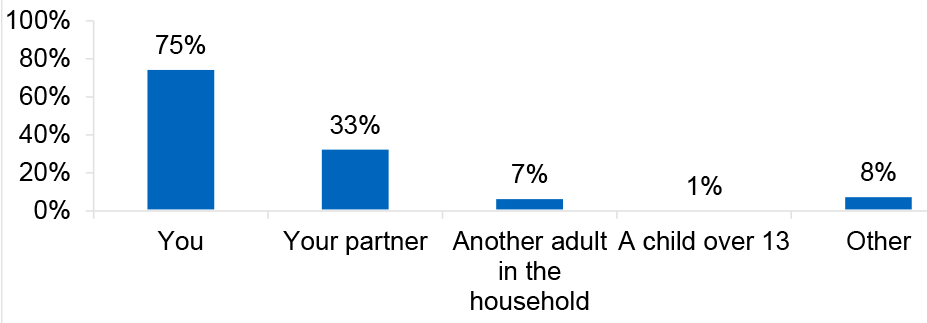
Base: respondents, n=1,205
Contact
Email: socialresearch@gov.scot