Agricultural Household Survey 2025 Report
Results from the Agricultural Household Survey 2025
5. Household finances
5.1 Introduction
One of the Scottish Government’s priorities is to eradicate child poverty. However, lack of data available is a barrier to understanding the impact agricultural schemes have on farming and crofting households. This section focuses on household finances overall and standard of living for households with children.
5.2 Household income
Respondents were asked to provide their household’s total income from all sources over the last 12 months. They were asked to include income (not profit) from each person in the household and all farm businesses and include grants such as LFA payments and not to deduct taxes, National Insurance contributions, Health Insurance Payments and Superannuation payments.
The proportion of respondents whose income fell under £20,000 per annum was 15%, 8% had an income of between £20,000 and £29,999, 20% had an income of between £30,000 and £49,000 and £24% had an income of between £50,000 and £99,999. On the other end of the scale, 8% of households had an annual income of between £100,000 and £199,999, and 3% had more than £200,000. Just under one in four respondents (23%) said they preferred not to provide details of their household income. The median income was between £40,000 and £49,999.
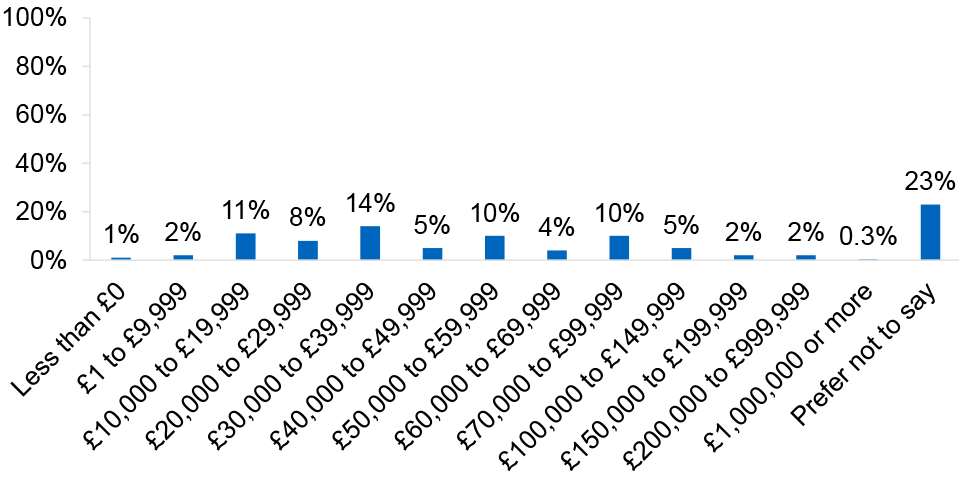
Base: respondents, n=4,040
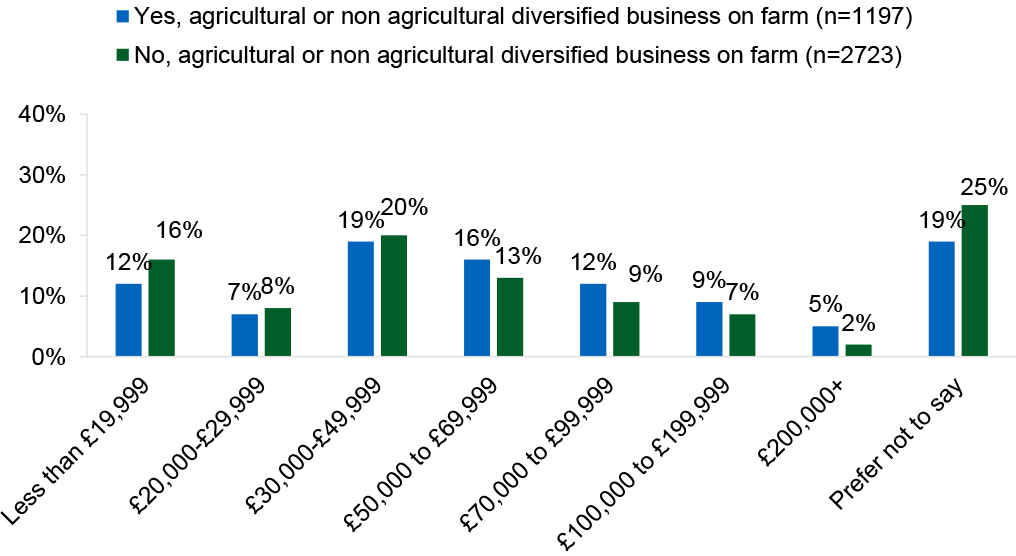
Farms and crofts who have non-farm diversified business activities were more likely to have higher household income over £100,000 (15%) than farms and crofts that do not participate in any non-farm diversified business (9%).
Respondents who lived in farms and crofts over 30 hectares were more likely to have incomes of over £100,000 (14%) than small farms/crofts between 3 and 30 hectares (8%) and under 3 hectares (7%). Households with active farmers were more likely to have incomes of over £100,000 (11%) than households that did not have an active farmer (8%).
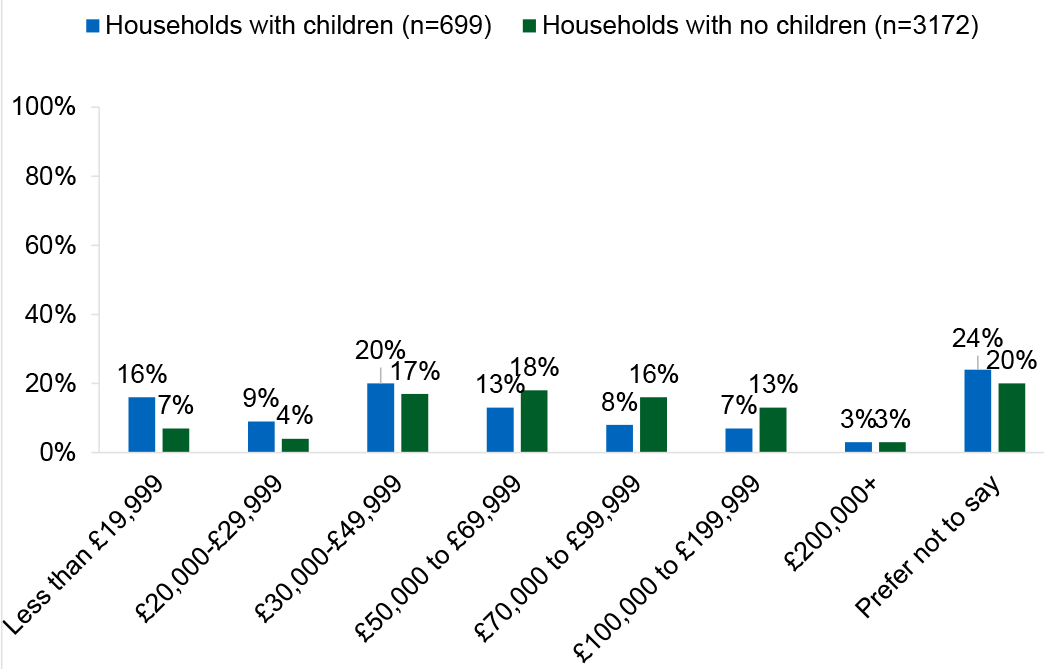
Low income households have been defined as those with income of less than £30,000 per annum. This ties in with comparable thresholds for measuring poverty across the UK. Households with children were less likely to have a household income of less than £30,000 (11%) than households with no children (25%).
5.3 Low income households with children
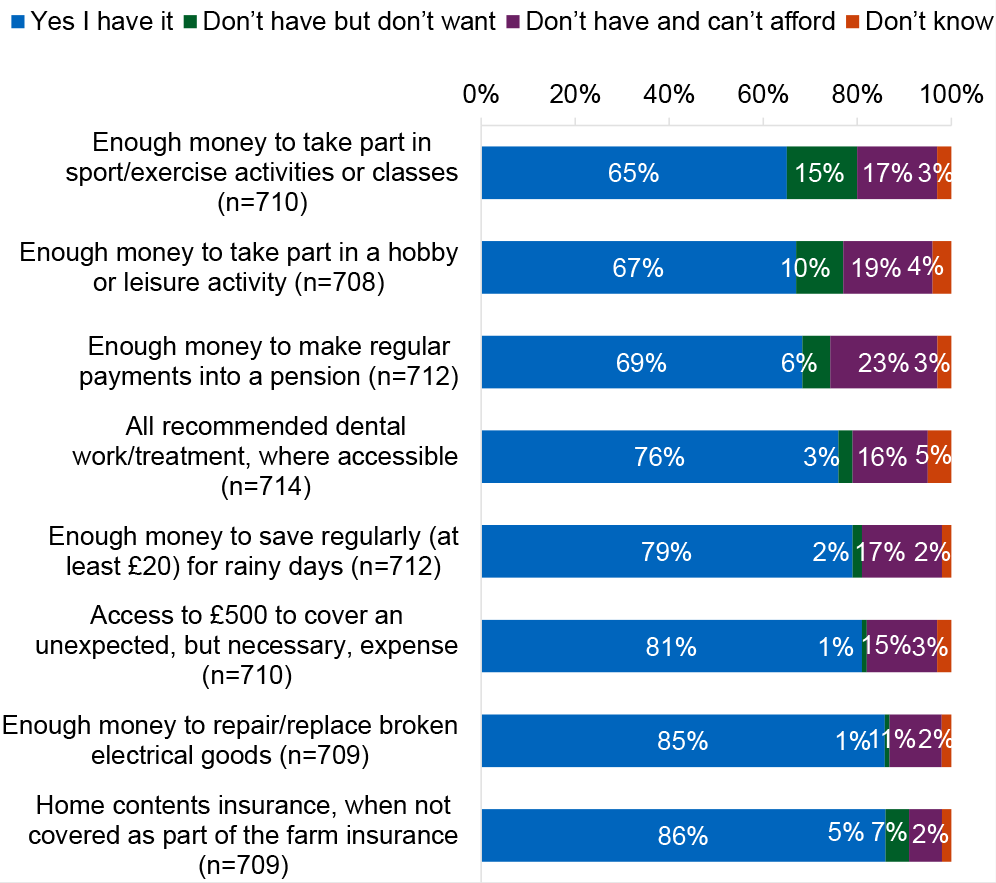
Households with children (18% of responding households) were asked to think about their standard of living and to answer from a list of items which they have, which they don’t have but don’t want, and which they don’t have and can’t afford. As shown in Figure 19, respondents were most likely to say they have and can afford home contents insurance (86%) and that they have enough money to repair or replace broken electrical goods (85%). On the other hand, where they said there were things they don’t have due to affordability this was most likely to be regarding having enough money to make regular payments into a pension (23%), followed by having enough money to take part in a hobby or leisure activity (19%).
In general, where households were on low incomes (below £30,000 per annum) they were most likely to say they do not have and cannot afford these things. For example, 45% of respondents with children who have a household income of less than £30,000 said they did not have enough money to make regular payments into a pension compared to 16% of respondents with children who had a household income of £100,000 or more.
Those who lived in a household with an active farmer were more likely to say they did not have enough money to make regular payments into a pension (24%) than households with no active farmer (9%).
The response to the statements on affordability does not vary significantly by the number of children in the household.
Contact
Email: socialresearch@gov.scot