Young Person's Guarantee - employment and education landscape: current evidence - overview
This evidence paper provides an overview of the current evidence on the employment and education landscape for young people aged 16 to 24 in Scotland, with equalities and Scottish Index of Multiple Deprivation (SIMD) breakdowns provided where possible.
4. Colleges
This chapter examines the available data on 16 to 24 year olds around college enrolments, outcomes, leaver destinations and articulation from college to university. The 16 to 24 year old cohort for enrolments and outcomes data consists of all college students across Further and Higher Education levels and including part-time and full-time modes, however, excluding those in school link programmes. For destinations, the cohort includes full-time qualifiers only who have successfully completed their Further or Higher Education courses. The cohort for articulation data consists of those Higher Education college students moving to university.
The enrolments, outcomes and articulation data examined here largely pre-dates the pandemic, with only the last few months of 2019/20 covered by the first stages of lockdown. College leaver destinations data, however, looks at leavers from the 2019/20 cohort 3 to 6 months after graduation, with the survey period of this data falling in the second half of 2020 and first part of 2021 when the country was under varying levels of covid-19 restrictions.
The number of young people aged 16 to 24 studying in college in Scotland
In 2019/20, there were nearly 106,800 enrolments from students aged 16 to 24. Around 80,700 (or 75.5%) were enrolled in Further Education (FE) courses and around 26,100 (or 24.5%) in Higher Education (HE) courses. The number of enrolments has decreased in both FE and HE courses in the past five years, by 6.1% and 14.9%, respectively.
| 2015/16 | 2016/17 | 2017/18 | 2018/19 | 2019/20 | |
|---|---|---|---|---|---|
| Further Education | |||||
| No. of FE enrolments | 85,929 | 85,384 | 81,745 | 78,378 | 80,663 |
| % of FE enrolments of total | 73.7 | 73.5 | 73.8 | 73.8 | 75.5 |
| Higher Education | |||||
| No. of HE enrolments | 30,674 | 30,854 | 28,993 | 27,876 | 26,114 |
| % of HE enrolments of total | 26.3 | 26.5 | 26.2 | 26.2 | 24.5 |
Source: SG analysis of SFC college enrolments data.
College enrolments by those aged 16 to 24 by equalities and SIMD
In 2019/20 there was a higher proportion of enrolments from 20% most deprived than from 20% least deprived areas in both FE and HE college courses – 28.3% compared to 12.7% in FE and 24.4% compared to 18.5% in HE. There has been only minor changes to these proportions since 2015/16.
Both FE and HE college courses, for this age cohort, are male dominated, with the share of female enrolments at 41.6% in FE and 46.6% in HE in 2019/20. The female share has risen in HE by 0.5 pp since 2015/16 but fallen by 1.0 pp in FE.
The share of college enrolments of those with a self-declared disability has risen at both levels, by 4.6 pp in FE and 5.8 pp in HE between 2015/16 and 2019/20. There is a larger proportion of enrolments in FE (21.1% in 2019/20) than in HE (15.8% in 2019/20) by those with a self-declared disability.
There was a higher share of minority ethnic enrolments in HE (8.2%) than in FE (6.8%) in 2019/20. The share of enrolments has increased in both, by 1.3 pp and 1.4 pp, respectively, between 2015/16 and 2019/20.
The share of enrolments by those with care experience has increased at both levels in the past five years as data collection has improved and support for care experienced students has increased. The share enrolments by those with care experience are considerably lower in HE (2.6%) than in FE (7.6%).
| 2015/16 | 2016/17 | 2017/18 | 2018/19 | 2019/20 | |
|---|---|---|---|---|---|
| Further Education | |||||
| SIMD | |||||
| 20% most deprived | 30.0 | 29.5 | 29.5 | 28.8 | 28.3 |
| 20% least deprived | 11.9 | 11.8 | 11.8 | 12.1 | 12.7 |
| Gender | |||||
| Female | 42.6 | 41.1 | 41.7 | 40.2 | 41.6 |
| Male | 57.3 | 58.8 | 58.1 | 59.4 | 57.8 |
| Disability | |||||
| No known disability | 83.5 | 83.4 | 81.5 | 78.5 | 78.9 |
| Self-declared disability | 16.5 | 16.6 | 18.5 | 21.5 | 21.1 |
| Ethnicity | |||||
| Minority Ethnic | 5.4 | 5.5 | 6.0 | 6.4 | 6.8 |
| Whitea | 94.6 | 94.5 | 94.0 | 93.6 | 93.2 |
| Care Experience | |||||
| No care experience | 98.9 | 98.3 | 97.7 | 95.9 | 92.4 |
| Care experienced | 1.1 | 1.7 | 2.3 | 4.1 | 7.6 |
| Higher Education | |||||
| SIMD | |||||
| 20% most deprived | 22.8 | 23.0 | 23.3 | 23.9 | 24.4 |
| 20% least deprived | 19.1 | 19.5 | 19.1 | 18.6 | 18.5 |
| Gender | |||||
| Female | 46.1 | 46.5 | 47.4 | 46.3 | 46.6 |
| Male | 53.8 | 53.4 | 52.4 | 53.3 | 53.0 |
| Disability | |||||
| No known disability | 90.0 | 89.4 | 87.8 | 84.9 | 84.2 |
| Self-declared disability | 10.0 | 10.6 | 12.2 | 15.1 | 15.8 |
| Ethnicity | |||||
| Minority Ethnic | 6.9 | 7.0 | 6.7 | 7.3 | 8.2 |
| Whitea | 93.1 | 93.0 | 93.3 | 92.7 | 91.8 |
| Care Experience | |||||
| No care experience | 99.6 | 99.4 | 99.1 | 98.2 | 97.4 |
| Care experienced | 0.4 | 0.6 | 0.9 | 1.8 | 2.6 |
Source: SG analysis of SFC College Enrolments data.
aThe 'White' ethnicity group includes minority ethnic white groups such as 'Polish' and 'Gypsy/traveller'.
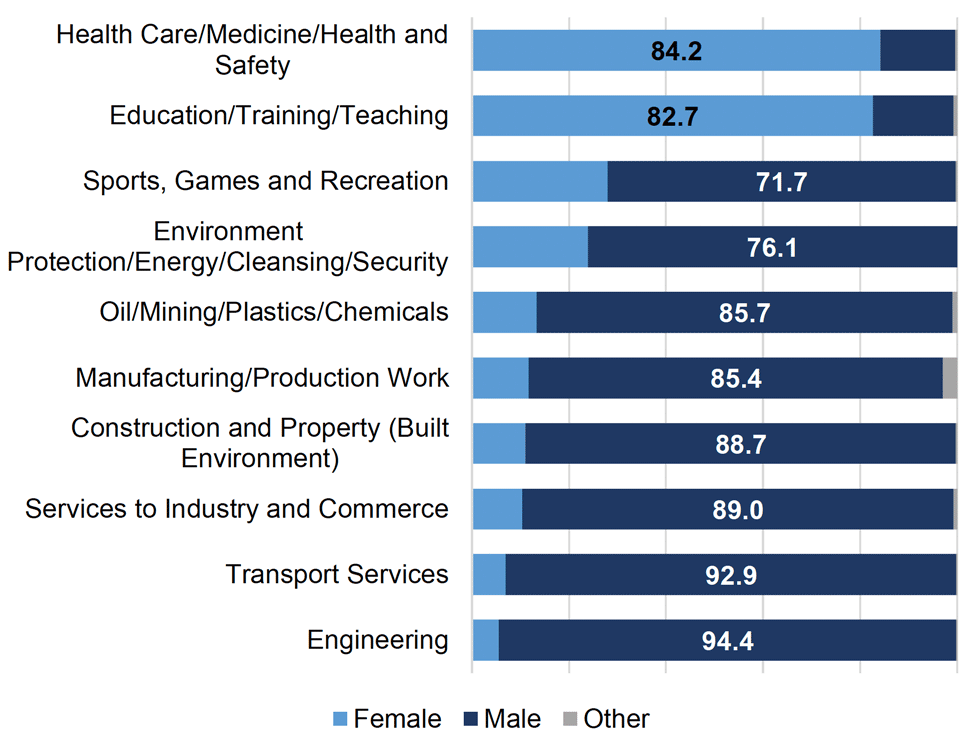
Gender balances in college courses for those aged 16 to 24
All of the ten most gender imbalanced subjects, across HE and FE at college[41], in 2019/20 had gender imbalance of more than 70:30. Eight of the subjects were male dominated, whilst two – Health Care/Medicine/Health and Safety and Education/Training/Teaching – were female dominated. The largest gender gap was in Engineering, where 94.4% of enrolments were male (see Chart 4.1).
Source: SG analysis of SFC College Enrolments data.
STEM participation in college for 16 to 24 year olds by equalities
In 2019/20, 38.1% of all FE and 28.8% of all HE enrolments were in STEM.
Equalities data shows us that the largest differences in STEM participation are between female and male enrolments. Women are considerably less likely to participate in STEM, with 19.1% of all female FE enrolments and 8.6% of all female HE enrolments in STEM, compared to 51.9% and 46.6%, respectively, for male enrolments.
Looking at other equalities groups, we can see that those from 20% most deprived areas, those with a self-declared disability and those who are care experienced are less likely to be enrolled in STEM than their counterparts.
Breaking STEM enrolments down by ethnicity, on the other hand, shows us that STEM enrolments for those from a minority ethnic background are lower than for those who are white in FE but higher in HE.
| Further Education | Higher Education | |
|---|---|---|
| Total | 38.1 | 28.8 |
| SIMD | ||
| 20% most deprived | 33.5 | 25.8 |
| 20% least deprived | 42.9 | 29.8 |
| Sex | ||
| Female | 19.1 | 8.6 |
| Male | 51.9 | 46.6 |
| Disability | ||
| No known disability | 41.2 | 29.8 |
| Self-declared disability | 26.5 | 23.5 |
| Ethnicity | ||
| Minority Ethnic | 27.8 | 32.3 |
| Whitea | 39.2 | 28.5 |
| Care Experience | ||
| No care experience | 38.9 | 29.1 |
| Care experienced | 29.0 | 20.1 |
Source: SG analysis of SFC College Enrolments Data.
a The 'White' ethnicity group includes minority ethnic white groups such as 'Polish' and 'Gypsy/traveller'.
College outcomes for 16 to 24 year olds
In 2019/20, 69.9% of students aged 16 to 24 completed their FE college courses successfully, whilst a further 13.9% had a partial success. FE course withdrawal rate for this age group was 16.2%. The successful completion rates for students in HE courses was higher than for students in FE courses (73.8%) whereas partial success and withdrawal rates were lower (12.7% and 13.5%, respectively).
Those from 20% least deprived areas are more likely to successfully complete their college studies than those from the 20% most deprived areas, with the successful completion rate 9.6 pp higher in FE and 5.4 pp higher in HE in 2019/20. Conversely, those from most deprived areas are more likely to withdraw from their college programmes than those from least deprived areas at both FE and HE levels.
Looking at gender, male students (72.8%) are more likely to successfully complete FE programmes than female students (66.0%), while the situation is reverse for HE (71.6% compared to 76.3%). Female students are more likely to withdraw from both FE and HE programmes than male students (20.3% compared to 13.1% in FE and 14.1% compared to 12.9% in HE), with the gap particularly large in FE, at 7.2 pp.
Those with no known disability are more likely to successfully complete their college programmes than those with a self-declared disability – 71.3% compared to 65.5% in FE and 74.5% compared to 70.2% in HE. Conversely, those with a self-declared disability are more likely to withdraw from their studies at both levels.
The successful completion rate in HE is almost at parity between those who are white (69.9%) and those from a minority ethnic background (70.0%). However, minority ethnic students are less likely to withdraw from their FE studies and more likely to partially succeed than white students. In HE, white students are more likely to successfully complete (74.5%) than minority ethnic students (70.2), with withdrawal rates for these groups almost at parity.
The successful completion rate for those who are care experienced is considerably lower than for any other group in both FE (58.2%) and HE (61.4%). Similarly, the withdrawal rates for this group are higher than for other groups (22.3% in FE and 20.7% in HE).
| % Successful completion | % Partial success | % Withdrawal | |
|---|---|---|---|
| Further Education | |||
| Total | 69.9 | 13.9 | 16.2 |
| 20% most deprived | 64.7 | 15.3 | 19.9 |
| 20% least deprived | 74.3 | 13.5 | 12.2 |
| Female | 66.0 | 13.7 | 20.3 |
| Male | 72.8 | 14.0 | 13.1 |
| Self-declared disability | 65.5 | 15.7 | 18.8 |
| No known disability | 71.3 | 13.3 | 15.4 |
| Minority Ethnic | 70.0 | 15.3 | 14.8 |
| Whitea | 69.9 | 13.8 | 16.4 |
| No care experience | 71.0 | 13.4 | 15.6 |
| Care experienced | 58.2 | 19.5 | 22.3 |
| Higher Education | |||
| Total | 73.8 | 12.7 | 13.5 |
| 20% most deprived | 70.1 | 14.4 | 15.5 |
| 20% least deprived | 75.5 | 12.0 | 12.5 |
| Female | 76.3 | 9.6 | 14.1 |
| Male | 71.6 | 15.5 | 12.9 |
| Self-declared disability | 70.2 | 14.1 | 15.8 |
| No known disability | 74.5 | 12.4 | 13.0 |
| Minority Ethnic | 70.2 | 16.0 | 13.8 |
| Whitea | 74.2 | 12.4 | 13.5 |
| No care experience | 74.2 | 12.5 | 13.3 |
| Care experienced | 61.4 | 17.9 | 20.7 |
Source: SG analysis of SFC College Performance Indicators data.
aThe 'White' ethnicity group includes minority ethnic white groups such as 'Polish' and 'Gypsy/traveller'.
College leaver destinations for those sector leavers aged 16 to 24
The statistics examined in this section look at confirmed destinations for sector leavers who have successfully completed their full-time college studies in the 2019/20 academic year, 3 to 6 months post-qualification. As such, the data was collected during the second half of 2020 and the first half of 2021 when the country was under varying levels of Covid-19 related restrictions. Table 4.5 below presents these leaver destination statistics for 2019/20 by level of study and equalities and SIMD.
The data shows us that HE leavers were more likely to go into positive destinations than FE leavers, 92.8% compared to 75.2% in 2019/20. FE leavers were more likely to go into work (52.6% compared to 27.3%) while HE leavers were more likely to continue their studies (65.5% compared to 22.6%).
Looking at equalities and SIMD, FE leavers who are from the most deprived areas (65.6%), leavers with a self-declared disability (61.0%) and leavers with care experience (57.2%) were the least likely to go into positive destinations compared to their counterparts. Female FE leavers are the most likely to go into further study (34.3%), followed by those from a minority ethnic background (31.6%). Male FE leavers were the most likely to go into work (59.2%), followed by those from the least deprived areas (58.5%) and those with no known disability (58.3%).
The gaps between different equality groups were smaller for HE leavers in 2019/20, with those with a self-declared disability least likely to end up in a positive destination (89.3%). HE leavers from a minority ethnic background were most likely to continue their studies (78.5%), while those who are white were most likely to go into work (28.3%).
The data also highlights that, as with school leaver destinations, college leavers with lower (SCQF level 4 or below) qualifications are less likely to end up in positive destinations that those leaving with qualifications at SCQF level 5 or above (43.8% compared to 89.6% respectively in 2019/20).[42]
| Negative Destination | Other Destination | Total Positive Destination | Study | Work | |
|---|---|---|---|---|---|
| Further Education | |||||
| Total | 19.7 | 5.1 | 75.2 | 22.6 | 52.6 |
| 20% most deprived | 26.7 | 7.7 | 65.6 | 17.6 | 48.0 |
| 20% least deprived | 14.9 | 2.6 | 82.4 | 24.0 | 58.5 |
| Female | 14.8 | 6.1 | 79.0 | 34.3 | 44.8 |
| Male | 23.8 | 4.2 | 72.0 | 12.8 | 59.2 |
| Self-declared disability | 28.0 | 11.1 | 61.0 | 22.6 | 38.3 |
| No known disability | 16.4 | 2.7 | 80.9 | 22.5 | 58.3 |
| Minority Ethnic | 23.3 | 5.3 | 71.4 | 31.6 | 39.8 |
| Whitea | 19.6 | 5.1 | 75.3 | 22.1 | 53.2 |
| No care experience | 18.8 | 4.9 | 76.3 | 22.8 | 53.5 |
| Care experienced | 35.1 | 7.7 | 57.2 | 18.8 | 38.5 |
| Higher Education | |||||
| Total | 6.1 | 1.1 | 92.8 | 65.5 | 27.3 |
| 20% most deprived | 7.8 | 1.6 | 90.6 | 64.9 | 25.8 |
| 20% least deprived | 5.0 | 0.8 | 94.2 | 69.6 | 24.6 |
| Female | 5.3 | 1.4 | 93.3 | 65.9 | 27.4 |
| Male | 7.2 | 0.6 | 92.2 | 64.9 | 27.2 |
| Self-declared disability | 9.0 | 1.7 | 89.3 | 63.9 | 25.3 |
| No known disability | 5.6 | 1.0 | 93.4 | 65.8 | 27.7 |
| Minority Ethnic | 4.3 | 0.9 | 94.8 | 78.5 | 16.3 |
| Whitea | 6.3 | 1.1 | 92.6 | 64.3 | 28.3 |
| No care experience | 6.2 | 1.1 | 92.8 | 65.2 | 27.6 |
| Care experienced | 5.1 | 2.6 | 92.3 | 74.5 | 17.9 |
Source: SG analysis of SFC College Leaver Destinations data.
aThe 'White' ethnicity group includes minority ethnic white groups such as 'Polish' and 'Gypsy/traveller'.
Articulation between Higher National Qualifications (HNQs) at college and university degrees by those aged 16 to 24
Articulation is the movement of students with either a Higher National Certificate (HNC) or Higher National Diploma (HND) gained at college into second or third year of a university degree. When an individual enters a university degree, following completion of these qualifications, there are three ways in which previous study is recognised. These are:
- Progression – where a student enters first year of a degree programme with an HNC/D, therefore receiving no recognition for prior HE study.
- Advanced Progression – where a student, typically, enters second year of a degree programme with a HND, therefore receiving only partial credit for prior HE study.
- Advanced Standing – where a student enters second year of a degree programme with a HNC or third of a degree programme with an HND, therefore receiving full credit for prior HE study.
In 2019/20, there were 5,443 college students who moved from college to a university. As shown in Chart 4.2, over half (55.2%) of those college leavers who went to university did so with Advanced Standing (full academic credit in 2019/20). A further 9.3% only received a partial credit for their prior study, and 35.5% did not articulate and received no credit for their HNC/D level study, entering university at year 1.
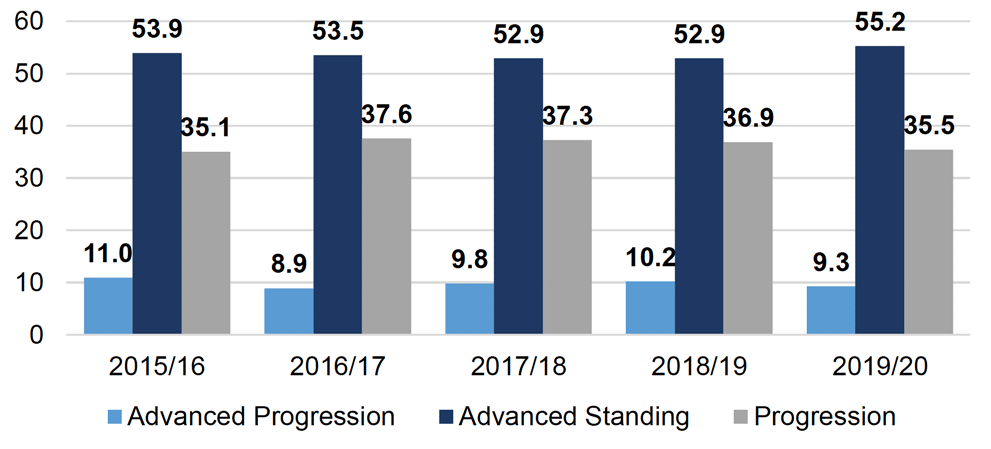
Source: SG analysis of SFC College Articulation data.
Articulation activity by equalities
Data for 2019/20 shows almost equal shares of students moving from HE college courses to university from 20% most and 20% least deprived areas (20.6% compared to 21.0%). This also holds true for both Advanced Standing and Progression, however there is a considerably larger share of students from most deprived areas than from least deprived areas moving to university with Advanced Progression (26.0% compared to 19.0%). When comparing with university enrolments data, we can see that there is a larger proportion of those from most deprived areas moving from HE college courses to a university degree than the proportion of Scottish domiciled first degree enrolments to university (20.6% compared to 11.8%). This is reverse for those from least deprived areas (21.0% compared to 32.5%).
Gender data shows that a larger proportion of female students move from HE college courses to university compared to male students (52.8% compared to 47.0%), which is consistent with university enrolments. However, further breakdowns of articulation data show that there is a considerably larger proportion of female than male students entering university with Progression (63.2% compared to 36.5%), with male students more likely than female students to articulate with Advanced Progression (59.6% compared to 40.4%) and Advanced Standing (51.7% compared to 48.3%).
Breaking down articulation data by disability, the share of HE college students with self-declared disability moving to university is 17.0%. The share of disabled HE college students articulating with the full Advanced Standing is slightly lower, at 15.1%, which is at the same level as the proportion of Scottish domiciled first degree enrolments to university in 2019/20 (15.2%).
Looking at those from a minority ethnic background, there is a slightly higher proportion of HE college students moving to university with an advanced standing from minority ethnic background (10.4%) than the proportion of Scottish domiciled first degree enrolments from a minority ethnic background at university (9.0%) in 2019/20.
Finally, 2.6% of college leavers moving to university with an advanced standing are care experienced. This is higher than the proportion of Scottish domiciled first degree enrolments to university by those who are care experienced in 2019/20.
| Total Leavers moving to university | Progression | Advanced progression | Advanced standing | % of first degree university enrolments | |
|---|---|---|---|---|---|
| SIMD | |||||
| 20% most deprived | 20.6 | 21.5 | 26.0 | 19.0 | 11.8 |
| 20% least deprived | 21.0 | 19.4 | 18.7 | 18.7 | 32.5 |
| Sex | |||||
| Female | 52.8 | 63.2 | 40.4 | 48.3 | 57.9 |
| Male | 47.0 | 36.5 | 59.6 | 51.7 | 42.0 |
| Disability | |||||
| Self-declared disability | 17.0 | 19.2 | 19.9 | 15.1 | 15.2 |
| No known disability | 83.0 | 80.8 | 80.1 | 84.9 | 84.8 |
| Ethnicitya | |||||
| Minority Ethnic | 10.0 | 9.5 | 9.7 | 10.4 | 9.0 |
| White | 90.0 | 90.5 | 90.3 | 89.6 | 91.0 |
| Care Experience | |||||
| Care experience | 2.6 | 2.7 | 1.8 | 2.6 | 1.1 |
| No care experience | 97.4 | 97.3 | 98.2 | 97.4 | 98.9 |
Source: SG analysis of SFC College Articulation data and HESA University Enrolments data.
aThe 'White' ethnicity group includes minority ethnic white groups such as 'Polish' and 'Gypsy/traveller'.