Young Person's Guarantee - employment and education landscape: current evidence - overview
This evidence paper provides an overview of the current evidence on the employment and education landscape for young people aged 16 to 24 in Scotland, with equalities and Scottish Index of Multiple Deprivation (SIMD) breakdowns provided where possible.
1. Demographics and participation in economic activity
This chapter provides a short overview of the size of the 16 to 24 year old population in Scotland and how it is projected to develop in the short and long term as well as a general, high level, overview of young people's participation in economic activity.
Scotland's population estimates and projections for those aged 16 to 24
The number of young people has been decreasing since 2011, falling from 631,000 (11.9% of total population) to around 567,000 (10.4%) in 2020, and is projected[8] to continue to do so long term, with the proportion of young people falling by around 1.1 percentage points (pp) between 2020 and 2043 (see Chart 1.1). In the shorter term, the population aged 16 to 24 is expected to fall until 2023, after which a brief increase is expected, peaking in 2031 at around 586,000 before continuing to fall again.
In 2020, 16 to 19 year olds accounted for 4.1%, and 20 to 24 year olds 6.3% of total population. Longer term, both cohorts, as a proportion of total population, are expected to fall, with the 16 to 19 cohort falling from 4.1% in 2020 to 3.9% in 2043 while the 20 to 24 cohort is projected to fall from 6.3% in 2019 to 5.4% in 2043.
While the pandemic has impacted the number of deaths across Scotland and restricted movement across the UK and overseas, the statistics presented here only capture the impacts on the population for the first four months (March to June 2020) of the pandemic.
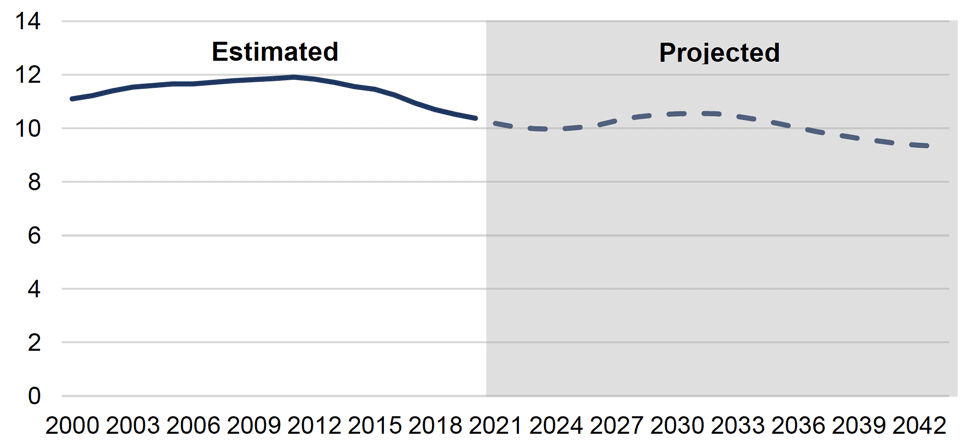
Source: NRS (2021), 'Mid-2020 Population Estimates Scotland' and NRS (2019) 'Projected Population (2018-based)'.
Young people's participation in education, employment and training
Chart 1.2 shows the proportion of 16 to 24 year olds participating in Education, Employment and Training in Scotland. This measure is an inverse of the 'Not in Education, Employment or Training' indicator'[9] which is based on the ONS Annual Population Survey data.
In 2020/21, 87.6% of young people aged 16 to 24 were participating in education, employment or training. This is a fall of 1.9 pp since 2019/20, but an increase of 4.4 pp from 83.2% in 2010/11 (the low following the 2008 recession).
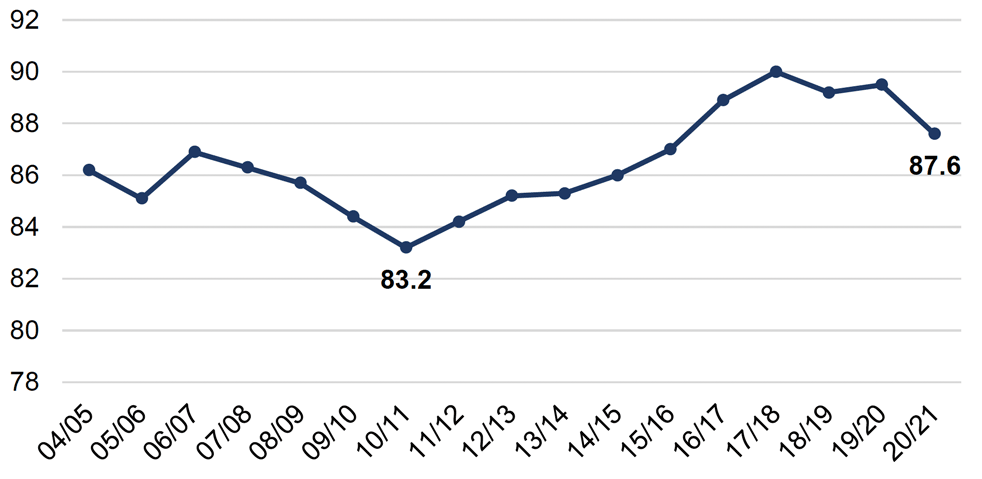
Source: SG analysis of Annual Population Survey data (ONS, Apr-March datasets).
The percentage of 16 to 24 year olds participating in education, employment or training has typically been lower for women (see chart 1.3) than for men, particularly in the years to 2014/15. However, the percentage for men fell to 85.6% in 2020/21, which is 4.0 pp lower than for women.
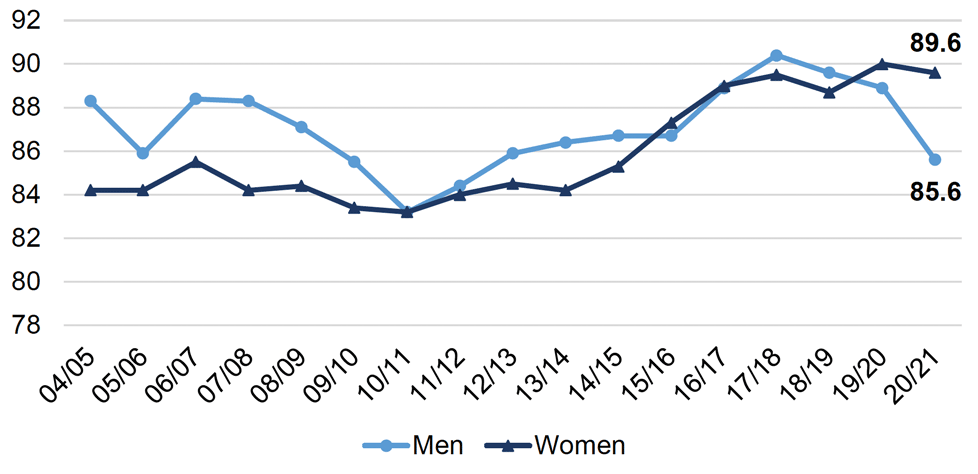
Source: SG analysis of Annual Population Survey data (ONS, Apr-March datasets).
This indicator is a useful, and currently only, tool that shows the proportion of young people aged 16 to 24 participating in employment, education or training in Scotland. However, it has its limitations. The indicator does not include voluntary work in its definition and the measure cannot be broken down by activity. Similarly, data on equality groups beyond gender is not readily available.
Participation statuses of young people aged 16 to 19 years
SDS produces an Annual Participation Measure (APM) which also measures the participation status of young people. The APM includes a wider range of activities in its definition: School pupil, Further Education, Higher Education, Modern Apprenticeships, Full-time employment, part-time employment, self-employed, Employability fund stages 2-4, Activity agreements, other formal training, Personal/Skills Development, and Voluntary Work. The measure can also be broken down to individual activity grouping and by several equality groups as well as by level of deprivation (SIMD). However, the limitation of this measure is that it currently only covers ages 16 to 19 due to lack of robust data on older age groups.[10] The following sections provide an overview of what the APM data says about young people's, aged 16 to 19, participation statuses.
In 2021, the APM data showed that the participation rate for those aged 16 to 19 was 92.2%, a slight 0.1 pp increase on 2020, and the highest participation rate recorded since the inception of the participation measure (see Table 1.1). Most of those participating were in some form of education (74.8%), with school pupil the most common status (43.2%) followed by Higher Education (20.1%). The participation rate for those in education has increased by 2.8 pp compared to 2020 (72.0%).
In 2021, 15.5% of 16 to 19 year olds were in employment, a 2.7 pp decrease compared to 2020 and the lowest rate ever reported. This is likely to have been a consequence of the Covid-19 pandemic and its impact on available opportunities. Similarly, the rate of those participating in MAs has decreased by 1.2 pp, from 6.1% in 2020 to 4.9% in 2021, likely caused by the reduced opportunities due to the pandemic.
The percentage of 16 to 19 year olds not participating decreased every year from 2018 to 2020 but increased in 2021, with 3.2% not participating, out of which 1.3% unemployed seeking and 1.9% unemployed not seeking.
| Annual Participation Measure | |||||
|---|---|---|---|---|---|
| 2018 | 2019 | 2020 | 2021 | ||
| Total 16 to 19 cohort (count) | 211,255 | 207,133 | 205,981 | 207,529 | |
| % Participating | 91.8 | 91.6 | 92.1 | 92.2 | |
| Education | School Pupil | 40.5 | 41.0 | 41.4 | 43.2 |
| Higher Education | 19.8 | 19.9 | 19.6 | 20.1 | |
| Further Education | 11.0 | 10.6 | 11.0 | 11.5 | |
| % Participating in Education | 71.3 | 71.4 | 72.0 | 74.8 | |
| Employment | Modern Apprenticeship | 6.5 | 5.9 | 6.1 | 4.9 |
| Full-Time Employment | 9.4 | 9.5 | 9.6 | 8.2 | |
| Part-Time Employment | 2.6 | 2.6 | 2.4 | 2.3 | |
| Self-Employed | 0.1 | 0.1 | 0.1 | 0.1 | |
| % Participating in Employment | 18.7 | 18.2 | 18.3 | 15.5 | |
| Training and Other Personal Development | Employability Fund | 0.6 | 0.5 | 0.5 | 0.6 |
| Other Formal Training | 0.2 | 0.3 | 0.9 | 0.8 | |
| Personal/Skills Development | 0.3 | 0.3 | 0.3 | 0.3 | |
| Activity Agreement | 0.6 | 0.6 | - | - | |
| Voluntary Work | 0.2 | 0.2 | 0.2 | 0.1 | |
| % Training & Other Development | 1.9 | 2.0 | 1.8 | 1.8 | |
| % Not Participating | 3.4 | 3.1 | 2.8 | 3.2 | |
| Unemployed seeking | 1.7 | 1.5 | 1.1 | 1.3 | |
| Unemployed not seeking | 1.7 | 1.6 | 1.7 | 1.9 | |
| % Unconfirmed | 4.7 | 5.3 | 5.1 | 4.6 | |
Source: SDS (2021), 'Annual Participation Measure 2021 – Supplementary Tables'.
Age
Participation was highest amongst 16 year olds (99.1%) with the majority of them at school (92.0%). The high participation rate for this age group is heavily influenced by most pupils leaving school at a later age.
The lowest participation was amongst 19 year olds (85.4%), with this age group most likely to be participating in higher education (42.7%).
The 18 and 19 age groups were most likely not to participate (5.0% and 4.1%). Similarly, 10.5% of the 19 year olds[11] had an unconfirmed status compared to 0.2% of those aged 16.
SIMD
Those living in more deprived areas are less likely to be reported as participating than those from the less deprived areas. However, the participation gap between those living in the 20% most deprived areas and those in the 20% least deprived areas continues to narrow. The gap has narrowed to 9.3 pp in 2021, compared to 12.9 pp in 2016[12].
Those from the less deprived areas were more likely to remain in education compared to those from more deprived areas. The proportion reported as participating in education in 2021 from the 20% least deprived areas (quintile 5) was 84.6% compared to 67.8% for those from the 20% most deprived areas (quintile 1), a difference of 16.8 pp (see Table 1.2).
In contrast, those from more deprived areas are more likely to be participating in employment than those from least deprived areas.
A higher proportion from more deprived areas were unemployed seeking and unemployed not seeking compared to those from less deprived areas. For example, 2.4% of those from quintile 1 were unemployed seeking compared to 0.6% from quintile 5, and 3.4% of those from quintile 1 were unemployed not seeking compared to 0.7% from quintile 5.
| SIMD Quintile 1 (most deprived) | SIMD Quintile 2 | SIMD Quintile 3 | SIMD Quintile 4 | SIMD Quintile 5 (least deprived) | |
|---|---|---|---|---|---|
| Participating | 87.1 | 90.4 | 93.3 | 94.6 | 96.4 |
| Education | 67.8 | 70.1 | 74.6 | 78.1 | 84.6 |
| Employment | 15.8 | 18.0 | 17.1 | 15.4 | 11.1 |
| Training and Other Personal Development | 3.4 | 2.2 | 1.5 | 1.1 | 0.7 |
| Not Participating | 5.8 | 4.1 | 2.6 | 2.0 | 1.3 |
| Unemployed Seeking | 2.4 | 1.6 | 1.1 | 0.8 | 0.6 |
| Unemployed Not Seeking | 3.4 | 2.5 | 1.5 | 1.2 | 0.7 |
| Unconfirmed | 7.2 | 5.5 | 4.1 | 3.4 | 2.3 |
Source: SDS (2021), 'Annual Participation Measure 2021 – Supplementary Tables'.
Equalities
Women (93.2%) are more likely than men (91.2%) to be participating in education, training or employment. Similarly, women (79.9%) are more likely to be participating in education than men (70.0%). On the other hand, men (19.0%) are more likely than women (11.9%) to be participating in employment, a 7.1 pp difference. Men are also more likely to be unemployed seeking.
Those with a self-declared disability (88.3%) are 4.1 pp less likely to be participating than those identified as not disabled (92.4%). The proportion participating in employment for those identified as disabled is 9.5%, and is markedly lower than those not identified as disabled (15.8%). The proportion unemployed not seeking is also considerably higher for those identified as disabled (5.1%) compared to those with no disability (1.8%).
The participation rate of those identified as minority ethnic (95.4%) was 3.4 pp higher than for those identified as White (92.0%) in 2021. Those self-identifying as minority ethnic are particularly likely to be participating in education, with the participation rate for this activity at 89.0%, 15.2 pp higher than those who are white. The dominance of education as a post 16+ choice for this group has resulted in lower representation in other statuses, meaning they are less likely to be in employment, less likely to be unemployed seeking and less likely to have an unconfirmed status.
| Gender | Disability | Ethnicity | ||||
|---|---|---|---|---|---|---|
| Female | Male | Disabled | Not Disabled | Minority Ethnic | White | |
| Participating | 93.2 | 91.2 | 88.3 | 92.4 | 95.4 | 92.0 |
| % Participating in Education | 79.9 | 70.0 | 73.1 | 74.9 | 89.0 | 73.8 |
| % Participating in Employment | 11.9 | 19.0 | 9.5 | 15.8 | 5.3 | 16.3 |
| % Training & Other Development | 1.5 | 2.2 | 5.7 | 1.7 | 1.1 | 1.9 |
| Not Participating | 2.8 | 3.6 | 6.7 | 3.1 | 2.1 | 3.3 |
| % Unemployed Seeking | 0.9 | 1.7 | 1.6 | 1.3 | 1.0 | 1.3 |
| % Unemployed Not Seeking | 1.9 | 1.9 | 5.1 | 1.8 | 1.1 | 2.0 |
| Unconfirmed | 3.9 | 5.2 | 5.0 | 4.6 | 2.5 | 4.7 |
Source: SDS (2021), 'Annual Participation Measure 2021 – Supplementary Tables'.
Participation Rates Across Scotland
The participation rate also varies by local authority. In 2021, East Renfrewshire had the highest participation rate (97.2%), 7.8 pp higher than Aberdeen City (89.4%) which had the lowest rate.[13]
While there is some variability in rankings across years, the same local authorities tend to stay within the top and the bottom of the scale. For example, Shetland Islands, East Renfrewshire, East Dunbartonshire and Eilean Siar have all ranked in the top 5 for the past five years. Conversely, Dundee City and Glasgow City have both ranked in the bottom five during the same time period.
Volunteering
There is very little existing data on volunteering, with the APM the only source of reliable data on young people, which is why volunteering is only covered in this chapter.
In the APM publication, SDS defines Voluntary Work as work that "involve[s] a young person giving of his/her time and energy through a third party. It will benefit both the young person and others, including individuals, groups and organisations, communities, the environment and society at large. Some volunteering may include a financial allowance. Work experience that is not organised via a formal training programme and un-paid work would also be recorded here."
The participation in Voluntary Work by those aged 16 to 19 has remained relatively steady for the past four years, at 0.2% between 2018 and 2020, falling to 0.1% in 2021. Breaking this down further by age, 16 year olds' participation in Voluntary Work is very minimal (less than 0.05%), while 18 year olds have the highest participation rate in Voluntary Work. 17 and 19 year olds tend to align more closely with the average for Voluntary Work for the total 16 to 19 cohort.
In terms of gender, women have tended to be slightly more likely to participate in Voluntary Work than men (0.3% compared to 0.2% in 2019 and 2020), although this was reversed in 2021 (0.1% compared to 0.2%).
Those identifying as disabled are more likely to be participating in Voluntary Work than those who do not. In 2021, 0.3% of those who identify as disabled participated in Voluntary Work compared to 0.1% of those who do not.
Those from the least deprived areas are somewhat more likely to participate in Voluntary Work than those from the most deprived areas.
| 2018 | 2019 | 2020 | 2021 | |
|---|---|---|---|---|
| Age | ||||
| Total 16-19 Cohort | 0.2 | 0.2 | 0.2 | 0.1 |
| 16 | 0.0 | 0.0 | 0.0 | 0.0 |
| 17 | 0.2 | 0.1 | 0.2 | 0.1 |
| 18 | 0.4 | 0.5 | 0.5 | 0.3 |
| 19 | 0.2 | 0.3 | 0.2 | 0.2 |
| Gender | ||||
| Female | 0.2 | 0.3 | 0.3 | 0.1 |
| Male | 0.2 | 0.2 | 0.2 | 0.2 |
| Ethnicity | ||||
| Mixed or Multiple; Asian; African; Caribbean or Black; and other ethnic groups | * | 0.3 | 0.2 | 0.1 |
| White | 0.2 | 0.2 | 0.2 | 0.1 |
| Not Known/Not Disclosed | * | 0.2 | 0.3 | 0.2 |
| Disability | ||||
| Identified as Disabled | 0.4 | 0.4 | 0.5 | 0.3 |
| Not Identified as Disabled | 0.2 | 0.2 | 0.2 | 0.1 |
| SIMD | ||||
| 20% Most deprived | 0.2 | 0.2 | 0.2 | 0.1 |
| 20% Least Deprived | 0.3 | 0.3 | 0.3 | 0.1 |
Source: SDS (2021), 'Annual Participation Measure 2021 – Supplementary Tables'
*Disclosure control has been applied where figures are less than 5 or where such small numbers can be identified through differencing.