Young Person's Guarantee - employment and education landscape: current evidence - overview
This evidence paper provides an overview of the current evidence on the employment and education landscape for young people aged 16 to 24 in Scotland, with equalities and Scottish Index of Multiple Deprivation (SIMD) breakdowns provided where possible.
3. School Leavers
As the Young Persons Guarantee focuses on young people from age 16 to 24, and many individuals in this age range are still in or just leaving school, this section examines the available information and evidence around the senior phase pupils (S4 to S6) and their destinations after leaving school.[30]
School leaver cohort by stage of leaving
In 2019, there were nearly 128,000 pupils studying in S4, S5 and S6[31]. Separate figures show that there were around 47,500 school leavers in 2019/20[32]. Comparing these figures suggests that around 80,000, or 62.8%, stayed in school at the end of the academic year 2019/20 - around 89.7% of S4 pupils and 72.6% of S5 pupils are estimated to have stayed in school to continue their studies.
The percentage of the total school leaver cohort who were in S6 fell very gradually between 2015/16 and 2018/19. However, the 2019/20 leaver cohort saw an increase in the percentage of S6 leavers as well as a reduction in the size of the total school leaver cohort – which was reported to be the smallest leaver cohort since consistent records began.[33]
According to the Scottish Government Summary Statistics for Attainment and Initial Leaver Destinations[34], this reduction in size of the school leaver cohort does not appear to correspond to a reduction in the associated number of senior phase pupils recorded in the school rolls at the beginning of the year. This suggests that some S4 and S5 pupils, who might have otherwise left school in 2019/20, have decided instead to stay at school for reasons related to the pandemic. This would also explain the increase in the percentage of S6 leavers of the total leaver cohort.
School leaver destinations by destination category
As table 3.1 shows, the majority of school leavers are in a positive destination nine months after the end of the school year (92.2% in 2019/20) – i.e. they are in further education, higher education, training, employment or voluntary work.
Of the leavers, 66.5% were in Higher or Further Education, the highest rate since consistent records began in 2009/10. The percentage of school leavers in Employment, on the other hand, decreased from 28.0% in 2018/19 to 21.3% in 2019/20, the lowest figure on record.
The percentage of school leavers who were unemployed has increased from 5.8% in 2018/19 to 6.8% in 2019/20.
| Destination Category | 2014/15 | 2015/16 | 2016/17 | 2017/18 | 2018/19 | 2019/20 |
|---|---|---|---|---|---|---|
| Higher Education | 36.8 | 37.3 | 38.3 | 39.0 | 38.4 | 42.9 |
| Further Education | 23.4 | 22.4 | 23.0 | 22.6 | 23.3 | 23.6 |
| Training | 2.5 | 1.5 | 1.5 | 1.6 | 2.3 | 3.2 |
| Employment | 27.8 | 28.7 | 28.3 | 28.3 | 28.0 | 21.3 |
| Voluntary work | 0.4 | 0.4 | 0.5 | 0.6 | 0.5 | 0.3 |
| Other | 1.1 | 1.3 | 1.5 | 1.2 | 0.4 | 0.8 |
| Positive destinations | 92.2 | 91.6 | 93.1 | 93.3 | 92.9 | 92.2 |
| Unemployment seeking | 5.6 | 5.7 | 4.3 | 3.8 | 3.5 | 4.1 |
| Unemployment not seeking | 1.6 | 1.8 | 1.8 | 1.8 | 2.3 | 2.7 |
| Unknown[35] | 0.6 | 0.9 | 0.7 | 1.1 | 1.3 | 1.0 |
| Other Destinations | 7.8 | 8.4 | 6.9 | 6.7 | 7.1 | 7.8 |
Source: Scottish Government (2021), 'Summary Statistics for Follow-up Leaver Destinations'.
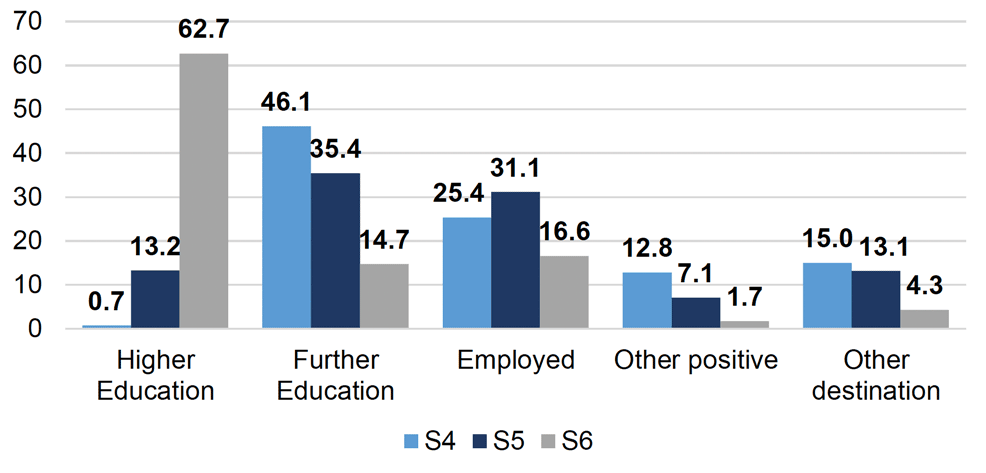
The majority of S6 leavers were in Higher Education nine months after the end of the school year 2019/20, as shown in Chart 3.1. The most common destination for S5 and S4 leavers was Further Education. This is consistent with previous years.
Nine months after leaving school, 15.0% of S4 leavers were in other (i.e. non-positive) destinations, compared to 13.1% of S5 and 4.3% of S6 leavers. For S5 and S6 leavers, these are slightly higher than the previous year, when 16.5% of S4, 11.4% of S5 and 3.4% of S6 leavers were in non-positive destinations. Pupils who leave school at a later stage are more likely to enter a positive destination than those who leave earlier.
Source: Scottish Government (2021), 'Summary Statistics for Follow-up Leaver Destinations'.
School leaver destinations by SIMD
A smaller percentage of pupils from the most deprived areas reach positive destinations than those from the least deprived areas. This gap has been gradually closing, from 18.7 pp in 2009/10 to 8.3 pp in 2019/20, with the positive follow-up destination rate rising in both cohorts. The most recent data show that this rate decreased in the 2019/20 cohort for both groups by roughly the same amount.[36]
Looking at the breakdown of follow-up school leaver destinations by SIMD for 2019/20, pupils from the most deprived areas are less likely to enter Higher Education than those from the least deprived areas (27.0% of leavers from the most deprived areas compared to 62.6% from the least deprived areas). Further, 10.8% of leavers from the most deprived areas were unemployed, compared to 3.6% of leavers from the least deprived areas.
| Initial Destination | 0-20% (Most Deprived | 20-40% | 40-60% | 60-80% | 80-100% (Least Deprived) | Percentage point gap |
|---|---|---|---|---|---|---|
| Higher Education | 27.0 | 33.5 | 42.7 | 50.3 | 62.6 | 35.6 |
| Further Education | 31.5 | 27.8 | 23.5 | 20.3 | 14.2 | -17.4 |
| Training | 6.3 | 4.2 | 2.3 | 1.7 | 1.0 | -5.3 |
| Employment | 20.5 | 23.8 | 23.7 | 21.6 | 17.4 | -3.1 |
| Voluntary Work | 0.4 | 0.3 | 0.4 | 0.3 | 0.3 | -0.1 |
| Personal Skills Development | 1.9 | 0.7 | 0.5 | 0.5 | 0.4 | -1.5 |
| Positive Destinations | 87.6 | 90.3 | 93.0 | 94.7 | 95.9 | 8.3 |
| Unemployed Seeking | 6.6 | 5.2 | 3.8 | 2.7 | 2.2 | -4.4 |
| Unemployed Not Seeking | 4.2 | 3.4 | 2.2 | 2.0 | 1.4 | -2.8 |
| Unknown | 1.6 | 1.2 | 0.9 | 0.6 | 0.6 | -1.1 |
| Other Destinations | 12.4 | 9.7 | 7.0 | 5.3 | 4.1 | -8.3 |
Source: Scottish Government (2021), 'Summary Statistics for Follow-up Leaver Destinations'.
School leaver destinations by equalities
School leavers with and Additional Support Need (ASN) are less likely to be in a positive destination, with 87.2% being in a positive follow-up destination in 2019/20, compared to 94.9% of leavers without a recorded ASN, as shown in Table 3.3.
Data is not available for all ethnic groups for all years due to small numbers of school leavers but, based on the data that is available, pupils of an Asian ethnic background tend to be more likely to be in a positive destination. Pupils from a white or mixed ethnic background were less likely to be in a positive destination in 2019/20 compared with 2018/19. Pupils from Asian or African/Black/Caribbean backgrounds were actually more likely to be in a positive destination in 2019/20 than 2018/19.
Women are more likely to be in a positive destination than men, with 93.6% of women being in a positive follow-up destination in 2019/20 compared to 90.9% of men.
| Pupil Characteristic | 2014/15 | 2015/16 | 2016/17 | 2017/18 | 2018/19 | 2019/20 |
|---|---|---|---|---|---|---|
| Sex | ||||||
| Male | 91.4 | 90.9 | 92.4 | 92.4 | 92.1 | 90.9 |
| Female | 92.9 | 92.3 | 94.0 | 94.3 | 93.7 | 93.6 |
| Ethnicity | ||||||
| White – Scottish | 92.1 | 91.5 | 93.0 | 93.2 | 92.7 | 92.0 |
| White – non-Scottish | 92.2 | 92.8 | 93.9 | 94.2 | 93.5 | 92.3 |
| Mixed or multiple ethnic groups | 93.0 | 93.0 | 92.7 | 93.6 | 92.8 | 91.7 |
| Asian – Indian | 96.3 | 96.9 | * | 97.2 | 94.4 | 95.4 |
| Asian – Pakistani | 95.2 | 92.5 | 95.7 | 93.5 | 94.8 | 95.6 |
| Asian – Chinese | 97.1 | 95.9 | * | 96.8 | * | * |
| Asian – Other | 96.2 | 95.1 | 95.3 | 93.9 | * | * |
| African/Black/ Caribbean | 94.4 | 92.3 | 93.9 | 96.0 | 94.1 | 95.1 |
| All other categories | 91.2 | 88.4 | 94.5 | 92.0 | 93.6 | 93.3 |
| Not disclosed/Not known | 90.6 | 88.8 | 90.7 | 89.8 | 88.9 | 90.2 |
| Additional Support Needs | ||||||
| ASN | 86.2 | 85.2 | 87.7 | 88.4 | 87.9 | 87.2 |
| No ASN | 93.7 | 93.5 | 95.0 | 95.3 | 95.1 | 94.9 |
Source: Scottish Government (2021), 'Summary Statistics for Follow-up Leaver Destinations'.
*value suppressed to protect against the risk of disclosure of personal information.
School leaver destinations for looked after children?[37]
Looked after children are a group of vulnerable young people who are also referred to as 'care-experienced'. A young person may become looked after for a number of reasons, including neglect, abuse, complex disabilities which require specialist care, or involvement in the youth justice system.
Based on Scottish Government's report 'Education Outcomes for Looked After Children – 2019/20'[38] published in June 2021, there were an estimated 943 young people who were looked after at any point between August 2019 to July 2020 and who were in the 2019/20 school leaver cohort. This represents 2% of the 47,454 school leavers in 2019/20.
This data show that looked after children are more likely to leave school in earlier stages (S4 and S5), with 43.2% of looked after children leaving school at S4 or earlier and 39.0% at S5, compared to 11.4% at S4 and 25.8% at S5 of all school leavers. Only 17.8% of looked after children leave after S6, compared to 62.8% of all school leavers.
In 2019/20, 80.5% of the school leavers who were looked after entered an initial positive destination. While this has improved considerably in the past decade, rising from 58.1% in 2009/10, it is still much lower than the same figure for the entire school leaver cohort (93.3% in 2019/20).[39]
Compared to all school leavers, looked after children are more likely to go into Further Education (49.1% compared to 28.1% as initial destination) and considerably less likely to go into Higher education (7.2% compared to 44.2%). Looked after children are also more likely to become unemployed compared to all school leavers (18.3% compared to 5.9%).
Looking at follow-up destinations, the data highlight a fall in looked after leavers in positive destinations, 75.3% compared to 80.5% in initial destinations. This is a larger drop than for the entire school leaver cohort, where 92.2% continued to be in positive follow-up destinations compared to 93.3% in positive initial destinations.
| Destination Category | Looked after leavers | All school leavers | ||
|---|---|---|---|---|
| Initial | Follow-up | Initial | Follow-up | |
| Higher Education | 7.2 | 6.6 | 44.2 | 42.9 |
| Further Education | 49.1 | 42.5 | 28.1 | 23.6 |
| Training | 13.6 | 12.0 | 3.7 | 3.2 |
| Employment | 8.7 | 10.5 | 16.2 | 21.3 |
| Voluntary work | 0.2 | 0.2 | 0.5 | 0.3 |
| Other | 1.7 | 3.5 | 0.8 | 0.8 |
| Positive destinations | 80.5 | 75.3 | 93.3 | 92.2 |
| Unemployment seeking | 9.8 | 10.1 | 4.1 | 4.1 |
| Unemployment not seeking | 8.5 | 11.6 | 1.8 | 2.7 |
| Unknown | 1.3 | 2.9 | 0.7 | 1.0 |
| Other Destinations | 19.5 | 24.7 | 6.7 | 7.8 |
Source: Scottish Government (2021), 'Education Outcomes for Looked After Children – 2019/20'.
Note: Figures may not add to 100% due to rounding.
School leaver destinations by local authority
The proportion of leavers in a positive destination varies across Scotland. In 2019/20, Aberdeen City had the lowest proportion of school leavers in a positive destination (89.5%), while Na h-Eileanan Siar had the highest proportion (97.1%).
However, it should be noted that the order is variable from year to year. For example, South Ayrshire had the fifth lowest proportion of school leavers in positive destinations in 2018/19 and the third highest in 2019/20.[40]
School leaver destinations by highest SCQF level achieved
School leavers with higher attainment levels are more likely to be in a positive destination – 57.6% of school leavers who did not achieve a pass at SCQF level 3 or better were in a positive destination, as shown in Table 3.5. This increased to 78.3% of leavers who achieved at SCQF level 4, to 89.6% for leavers who achieved at SCQF level 5, 96.0% of leavers who achieved at SCQF Level 6 and 98.1% of leavers who achieved at SCQF level 7.
The table also shows that majority of school leavers with one pass or more at SCQF level 6 or 7 entered Higher Education. The most common destination for school leavers whose highest qualification was at SCQF level 5 or below is Further Education.
| Destination Category | No passes at SCQF 3 or better | SCQF level 3 | SCQF level 4 | SCQF level 5 | SCQF level 6 | SCQF level 7 |
|---|---|---|---|---|---|---|
| Higher Education | 1.6 | - | 0.4 | 2.7 | 54.1 | 86.9 |
| Further Education | 24.3 | 30.6 | 38.0 | 45.8 | 19.2 | 3.7 |
| Training | 15.0 | 18.2 | 11.8 | 4.3 | 0.8 | 0.2 |
| Employment | 16.7 | 15.9 | 24.7 | 35.6 | 21.4 | 7.3 |
| Voluntary work | * | 0.7 | 0.5 | 0.2 | 0.3 | * |
| Personal Skills Development | * | 3.9 | 2.9 | 1.0 | 0.2 | * |
| Positive destinations | 57.6 | 69.3 | 78.3 | 89.6 | 96.0 | 98.1 |
| Unemployment seeking | 10.7 | 12.1 | 11.3 | 6.0 | 2.5 | 0.9 |
| Unemployment not seeking | 20.3 | 14.8 | 8.3 | 2.8 | 0.9 | 0.5 |
| Unknown | 5.5 | 3.8 | 2.1 | 1.6 | 0.5 | 0.1 |
| Other Destinations | 36.5 | 30.7 | 21.7 | 10.4 | 4.0 | 1.5 |
Source: Scottish Government, June 2021, 'Summary Statistics for Follow-up Leaver Destinations'.
*value suppressed to protect against the risk of disclosure of personal information