Young Person's Guarantee - employment and education landscape: current evidence - overview
This evidence paper provides an overview of the current evidence on the employment and education landscape for young people aged 16 to 24 in Scotland, with equalities and Scottish Index of Multiple Deprivation (SIMD) breakdowns provided where possible.
2. Employment, Fair Work and Skills
This section examines the statistics on employment, unemployment and inactivity rates for young people aged 16 to 24. It will also look at statistics on the quality of work as well as examine statistics on skill levels for those in employment.
Employment, unemployment and inactivity rates for young people in Scotland
As shown in Table 2.1, in 2020/21 (April-March), the employment rate for 16 to 24 year olds (including those in full-time education) was estimated at 52.8%, 1.8 pp lower than a year ago (54.7%). The rate is now the lowest since 2013/14.
As expected, the employment rate for those not in full-time education is higher, although this has also fallen by 2.7 pp over the year to 71.9%.
The unemployment rate for 16 to 24 year olds was estimated at 12.5% in 2020/21, 3.6 pp higher than the year before (8.9%). The last time the unemployment rate for young people was higher was in 2015/16 (15.0%). The unemployment rate excluding those in full-time education follows very similar patterns and was estimated at 13.2% in 2020/21, a 4.7 pp increase over the year.
The inactivity rate[14] for 16 to 24 year olds was estimated at 39.6% in 2020/21, 0.4 pp lower than the year before (40.0%). Since the series began, the rate has been steadily rising, and has increased by 4.7 pp in the past six years. Over three quarters 76.8% of young people (16 to 24 years) in 2020/21 who were economically inactive were in full-time education[15], which is why the inactivity rate for those not in full-time education is at a considerably lower level than for 16-24 year olds overall.
| Employment (%) | Unemployment (%) | Inactivity (%) | ||||
|---|---|---|---|---|---|---|
| Not in Full-Time Education | All | Not in Full-Time Education | All | Not in Full-Time Education | All | |
| 2013/14 | 69.2 | 52.1 | 17.8 | 19.7 | 15.8 | 35.1 |
| 2014/15 | 70.9 | 54.4 | 16.3 | 16.4 | 15.4 | 34.9 |
| 2015/16 | 72.2 | 55.9 | 14.3 | 15.0 | 15.7 | 34.3 |
| 2016/17 | 74.9 | 57.2 | 9.3 | 10.0 | 17.4 | 36.4 |
| 2017/18 | 76.2 | 58.8 | 8.4 | 9.3 | 16.8 | 35.2 |
| 2018/19 | 76.8 | 58.3 | 9.4 | 9.9 | 15.2 | 35.3 |
| 2019/20 | 74.6 | 54.7 | 8.5 | 8.9 | 18.5 | 40.0 |
| 2020/21 | 71.9 | 52.8 | 13.2 | 12.5 | 17.2 | 39.6 |
Source: Scottish Government (2021), 'Labour Market Statistics for young people (16-24 years): Scotland and UK – April 2020 to March 2021.
Employment, unemployment and inactivity rates for 16 to 24 year olds by equalities and SIMD
Gender
There is no considerable gap in employment rates between women and men aged 16 to 24. In April 2020 to March 2021, young women had a higher employment rate (53.5%) than young men (52.2%), however, this has varied across the past several years.
Young women, in general, tend to have lower unemployment rates compared to young men (11.9% compared to 13.1% in 2020/21), but a higher economic inactivity rate, except for in 2020/21 when men had a slightly higher inactivity rate (39.9% compared to 39.3%).
| Employment (%) | Unemployment (%) | Economic Inactivity (%) | ||||
|---|---|---|---|---|---|---|
| Women | Men | Women | Men | Women | Men | |
| 2013/14 | 51.0 | 53.3 | 19.5 | 19.7 | 38.4 | 35.1 |
| 2014/15 | 56.1 | 52.7 | 13.0 | 19.7 | 35.5 | 34.4 |
| 2015/16 | 57.2 | 54.6 | 12.1 | 17.7 | 35.0 | 33.6 |
| 2016/17 | 58.2 | 56.3 | 7.7 | 12.1 | 36.9 | 36.0 |
| 2017/18 | 57.1 | 60.5 | 8.5 | 10.0 | 37.6 | 32.9 |
| 2018/19 | 56.8 | 59.9 | 8.8 | 10.8 | 37.8 | 32.8 |
| 2019/20 | 54.9 | 54.5 | 8.3 | 9.4 | 40.1 | 39.9 |
| 2020/21 | 53.5 | 52.2 | 11.9 | 13.1 | 39.3 | 39.9 |
Source: Scottish Government (2021), 'Labour Market Statistics for young people (16-24 years): Scotland and UK – April 2020 to March 2021.
Disability[16]
Looking at the employment rate by disability, the gap between the disabled and not disabled employment rates for 16 to 24 year olds has shown very little improvement in the past six years. The gap was at its lowest in the series in 2019/20, at 16.4 pp, however, rising to its highest in 2020/21, to 26.1 pp, as the employment rate for those aged 16 to 24 who are disabled fell by 9.5 pp from 41.1% in 2019/20 to 31.6% in 2020/21 while the rate for those aged 16 to 24 who are not disabled rose by 0.2 pp from 57.5% to 57.7%.
Similarly, the disability inactivity rate gap has shown no improvements in this time period, and was at its highest in 2020/21, at 21.1 pp, with the inactivity rate at 56.6% for those aged 16-24 who are disabled compared to 35.6% for those who are not.
Finally, the disability unemployment rate gap for young people also remains considerable, and rose from 4.1 pp to 16.7 pp between 2019/20 and 2020/21 However, it should be noted that the unemployment rate for those aged 16 to 24 who are disabled in 2020/21 is based on a small sample size which may have resulted in less precise estimates and should therefore be used with caution.
| Employment (%) | Unemployment (%) | Economic Inactivity (%) | ||||
|---|---|---|---|---|---|---|
| Not Equality Act Disabled | Equality Act Disabled | Not Equality Act Disabled | Equality Act Disabled | Not Equality Act Disabled | Equality Act Disabled | |
| 2014/15 | 56.7 | 36.7 | 14.8 | 32.6 | 33.5 | 45.6 |
| 2015/16 | 58.3 | 38.5 | 14.0 | 23.0 | 32.2 | 49.9 |
| 2016/17 | 60.4 | 38.6 | 9.3 | 15.4 | 33.4 | 54.4 |
| 2017/18 | 61.1 | 42.5 | 8.0 | 20.4 | 33.6 | 46.6 |
| 2018/19 | 61.9 | 37.0 | 8.3 | 23.0 | 32.5 | 52.0 |
| 2019/20 | 57.5 | 41.1 | 8.3 | 12.3 | 37.3 | 53.2 |
| 2020/21 | 57.7 | 31.6 | 10.4 | 27.1 | 35.6 | 56.6 |
Source: SG analysis of Annual Population Survey data (ONS, April-March datasets).
Note: Bolded estimates are based on a small sample size. This may result in less precise estimates, which should be used with caution.
Ethnicity
While the APS does collect data on personal characteristics, such as ethnicity, the employment rate estimates for the minority ethnic 16 to 24 year old population are not as reliable as the estimates for other age groups and are therefore not presented here.
However, there have been some recent UK-wide studies on the impact of the pandemic on young people from minority ethnic backgrounds that may have relevance in the Scottish context.
Analysis of the UK-wide Office of National Statistics (ONS) Labour Force Survey by the Resolution Foundation[17] and the Institute for Employment Studies[18] suggests that non-white young people have seen larger falls in employment than white young people as a result of the pandemic. As non-white young people had poorer work prospects before the pandemic[19], this has led to the exacerbation of inequalities.
On a UK level, the unemployment rate for young people rose from 11.8% to 14.2%[20] during the pandemic. At the same time, the rate rose to 35% for young Black people (a 10 pp increase) and to 24% for young Asian people (a 3 pp increase). This is much higher than the corresponding unemployment rate for young white people which rose to 13% (a 3 pp increase).
Similarly, Black and Asian young people have accounted for two-thirds of the total fall in youth employment, despite only making up an eighth of the number of young people in employment in the UK. The structural barriers that drive disparities for those from minority ethnic backgrounds remain.
SIMD
Looking at employment rates by SIMD between 2017 and 2020 (January-December), we can see that those from 20% least deprived areas have in general had a higher employment rate than those from 20% most deprived areas. However, those from most deprived areas had a higher employment rate in 2020 (50.3% compared to 47.6%).
| 20% most deprived | 20% least deprived | |
|---|---|---|
| 2017 | 50.2 | 54.9 |
| 2018 | 52.9 | 58.3 |
| 2019 | 54.3 | 57.4 |
| 2020 | 50.3 | 47.6 |
Source: SG analysis of Annual Population Survey data (ONS, Jan-Dec datasets).
Employment rates by level of education
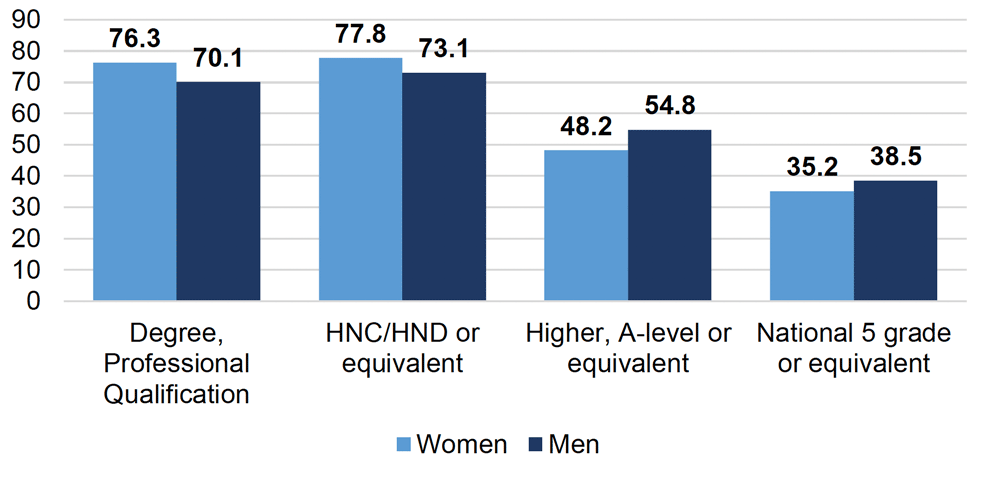
In 2020/21, young people in Scotland with further or higher education qualifications have higher employment rates than those with lower qualifications.
Young women (16-24 years) whose highest qualification was 'Degree, Professional Qualification' or 'HNC/HND or equivalent' had higher employment rates than men aged 16-24 who had the same level of qualification. This was reverse for those young people whose highest qualifications were 'Higher, A-level or equivalent' and 'National 5 grade or equivalent'.
Source: SG analysis of Annual Population Survey data (ONS, Apr 2020-March 2021).
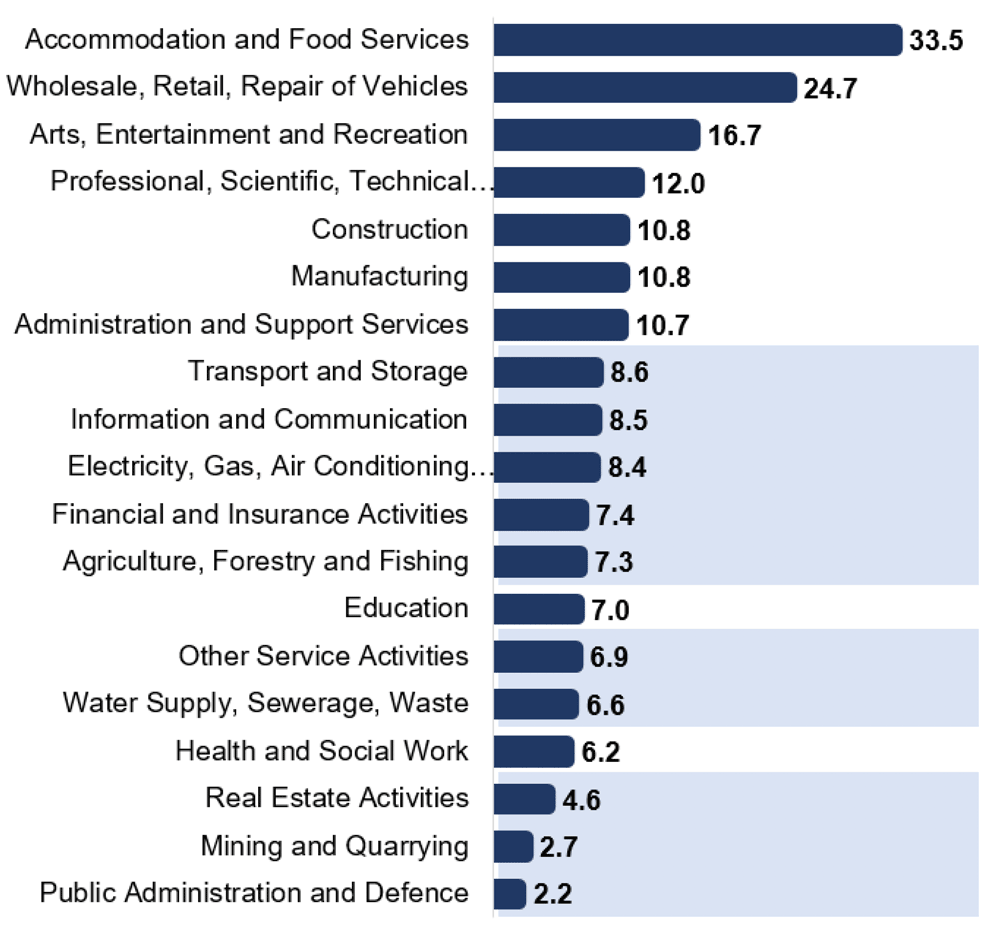
Young people's employment by industry
Chart 2.2 shows the proportion of workforce aged 16 to 24 by industry in April 2020-March 2021. People aged 16 to 24 accounted for an estimated 11.3% of the workforce in Scotland, however, they made up an estimated 33.5% of the workforce in Accommodation and Food Services sector, 24.7% of the Wholesale, Retail, Repair of Vehicles sector and 16.7% of Accommodation and Food Services sector, all of which have been hard hit by the pandemic related restrictions.
Based on a Scottish Government publication on public sector employment in Scotland, young people accounted for 4.6% of total employment in the devolved public sector in the first quarter of 2021.[22]
Source: Annual Population Survey, ONS. Data from Scottish Government (2021), 'Scotland's Labour Market - People Places and Regions -Charts - 2021'.
1. Shaded estimates are based on a small sample size. This may result in less precise estimates, which should be used with caution.
Young people in contractually secure employment
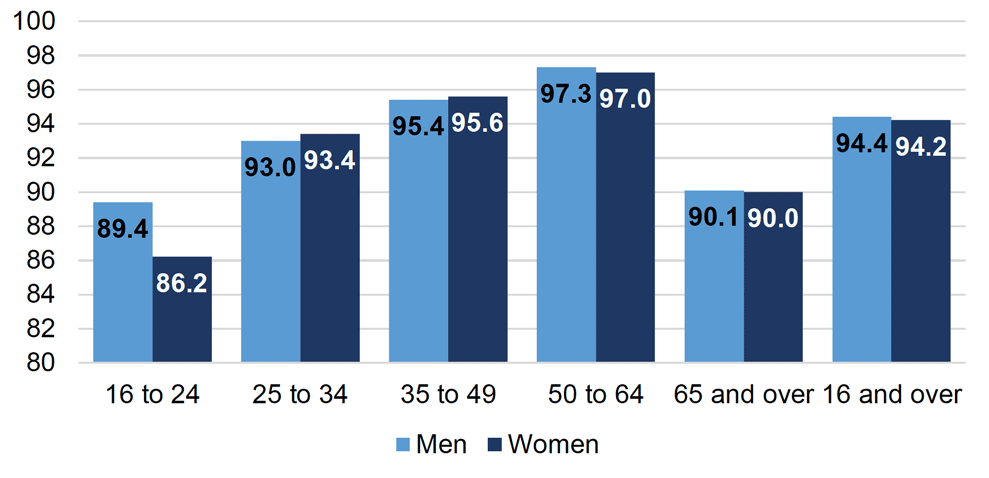
Chart 2.3 shows the proportion of young people aged 16 to 24 years in contractually secure employment by sex in April 2020 – March 2021. Contractually secure employment measures the proportion of employees who have indicated that their job is permanent.
Young people aged 16 to 24 were the least likely to be in contractually secure employment in 2020/21. Across all age groups, the proportion of employees in contractually secure work is above 90.0%, except for those aged 16 to 24 (87.8%)[23].
Women aged 16 to 24 were less likely to be in contractually secure work than men by 3.2 pp. This gap was considerably higher for young people than for the total population aged 16 or over where the gap between women and men in contractually secure work was 0.2 pp.
Source: Annual Population Survey, ONS. Data from Scottish Government (2021), 'Scotland's Labour Market - People Places and Regions -Charts - 2021'.
Young people's underemployment
There are two different types of underemployment, hours based and skills based. At the moment, data is only available for the former by age.
Hours based underemployment is defined as those who look for additional hours in their existing role (at the same rate of pay), those who look for an additional job (to supplement their existing job), and those seeking for a different job with more hours.
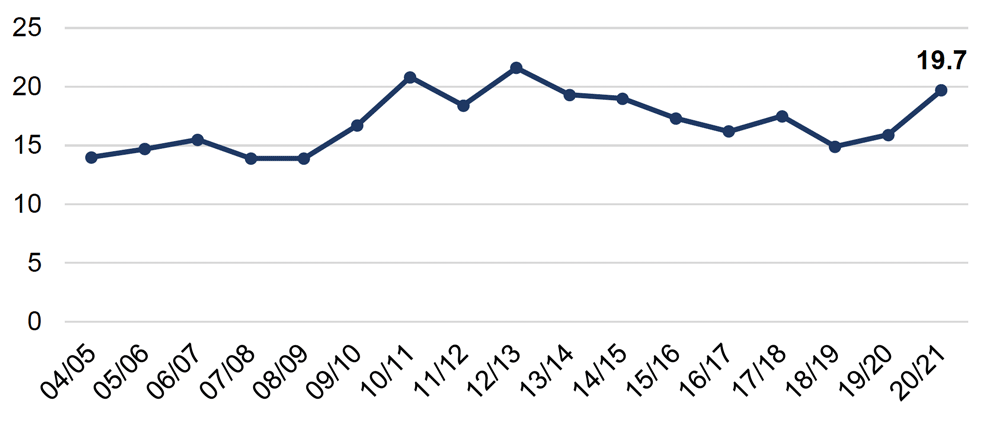
In Scotland, underemployment rate was estimated to be highest amongst those in employment aged 16 to 24 years and, at 19.7% in 2020/21, was over double the average for all age groups (8.5%). The underemployment rate rose after the 2008 recession, linked to the rise of part-time work as companies cut hours to reduce costs but retain employees. Since 2012/13, the rate was on a gradual downward trend, however, increasing again in 2020/21 likely due to the pandemic.
Source: Annual Population Survey, ONS. Data from Scottish Government (2021), 'Scotland's Labour Market - People Places and Regions -Charts - 2021'.
Young people's earnings compare to average earnings across all age groups
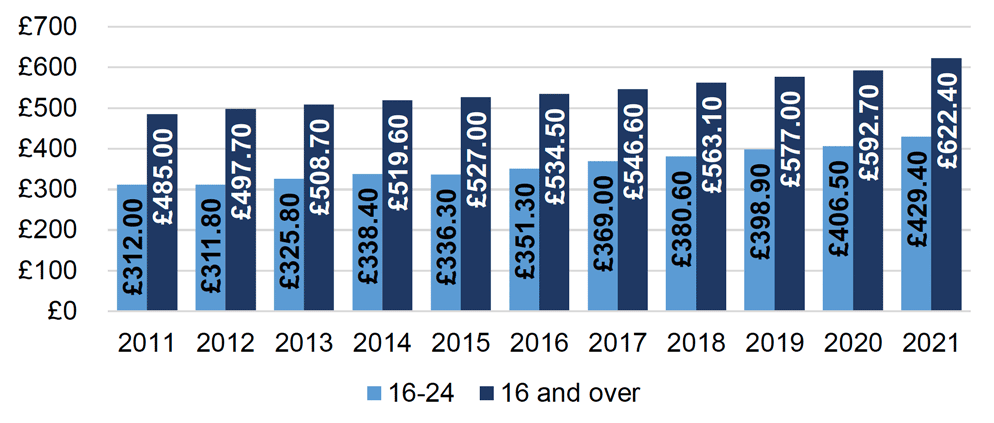
Earnings for full-time employees aged 16 to 24 and 16 and over (all adult ages) on adult rates of pay (i.e. excluding those on young, training and apprenticeship rates) have increased in the past decade, with median weekly earnings in 2021 at £429.40 for those aged 16 to 24 and at £622.40 for those aged 16 and over. Young people (16 to 24 years) earn around 31% less than the median for those aged 16 and over.
However, young people's earnings have increased at a faster pace, by around 38% since 2011 compared to around 28% for those aged 16 and over.
Source: Annual Survey of Hours and Earnings, ONS.
16-24 data – SG analysis of Annual Survey of Hours and Earnings (ONS, 2021); data for 16 and over – Scottish Government (2021), 'Annual Survey of Hours and Earnings 2021'.
The real Living Wage for those aged 18 to 24
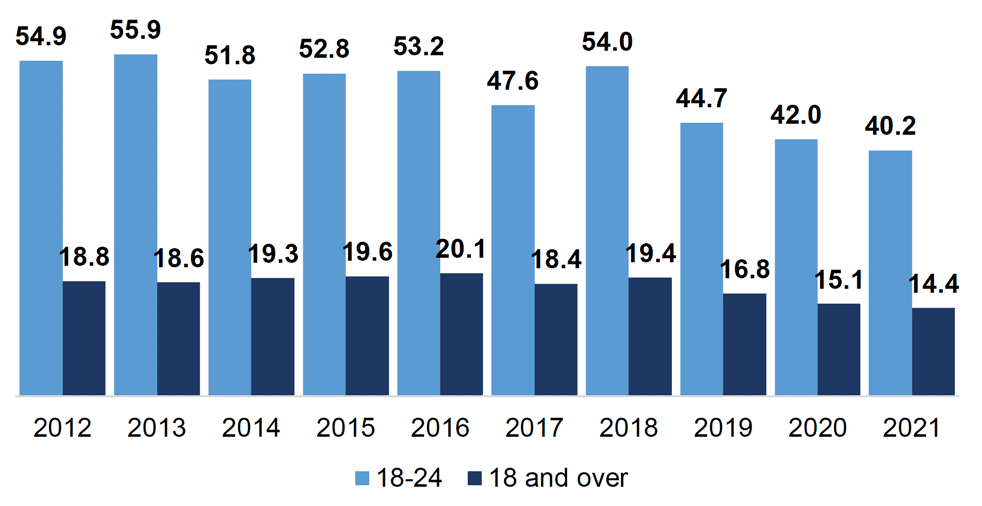
In 2021, 40.2% of employees aged 18 to 24[24] in Scotland earned less than the real living wage (£9.50). This rate was 14.4% for all employees aged 18 or over. The rate has improved for both age groups since 2012, from 54.9% in 2012 to 40.2% in 2021 for employees aged 18 to 24 years old, and from 18.8% to 14.4% for employees aged 18 and over.
Source: Annual Survey of Hours and Earnings, ONS. Data from Scottish Government (2021), 'Annual Survey of Hours and Earnings 2021'.
The gender pay gap for those aged 16 to 24
The gender pay gap for all employees (i.e. including all work patterns) within the 16 to 24 age group has been on a downward trajectory since 2014, falling from 10.6% to -1.8% in 2021, as shown in Table 2.5. A negative gender pay gap means that, on average, women's hourly earnings (excluding overtime) are higher than those of men.
It is in particular in the full-time employment cohort where the gender pay gap was considerably negative, at -17.0% in 2021, for this age group.
It is important to note, that while the gender pay gap for this age group is negative, women still earn less than men on average in the older age groups. For example, for the cohort aged 35 to 49, gender pay gap was 14.1% for all employees (full-time and part-time) and 3.5% for full-time employees in 2021. And as the table shows, the gap continues to grow for both all working patterns and full-time employees the older the age group is. This will be partly impacted by subject choices typically made in senior phase, further and higher education and apprenticeships; workplace practices including the "motherhood penalty"[25], whereby women who become mothers suffer a wage penalty; and occupations being low paid because of the way skills and values are socially constructed which can mean that certain types of work generally undertaken by women is undervalued[26].
| 16-24 | 25-34 | 35-49 | 50-64 | |||||
|---|---|---|---|---|---|---|---|---|
| All | Full time | All | Full time | All | Full time | All | Full time | |
| 2014 | 10.6 | 14.8 | 7.7 | 0.9 | 20.4 | 7.5 | 23.3 | 12.0 |
| 2015 | 7.3 | 8.8 | 6.1 | -1.5 | 19.4 | 7.7 | 23.2 | 12.5 |
| 2016 | 6.7 | 7.5 | 8.8 | 0.7 | 17.1 | 6.0 | 19.3 | 10.9 |
| 2017 | 3 | 3.8 | 11.6 | 1.8 | 19.5 | 8.2 | 21.1 | 11.1 |
| 2018 | 1.5 | -3.1 | 8.7 | 1.0 | 16.2 | 8.0 | 21.8 | 10.6 |
| 2019 | 0.8 | -0.4 | 13.0 | 7.4 | 14.2 | 6.3 | 21.2 | 12.2 |
| 2020 | -2.7 | -8.7 | 8.5 | 2.1 | 12.5 | 5.1 | 17.9 | 5.6 |
| 2021 | -1.8 | -17.0 | 1.2 | -4.3 | 14.1 | 3.5 | 18.8 | 7.7 |
Source: Annual Survey of Hours and Earnings, ONS. Data from Scottish Government (2021), 'Annual Survey of Hours and Earnings 2021'.
1. Bold figures indicate a reasonably precise estimate, rather than precise
2. 'All' includes full-time and part-time working patterns.
The Longitudinal Education Outcomes (LEO)[27] data can also be used to examine the gender pay gap as it provides details on earnings for university graduates and completers of Modern Apprenticeships five years post-graduation and college graduates completing an HE level course 3 years post-graduation.
According to the LEO data, which covers all ages, female median earnings in 2016/17 were £3,100 lower than male median earnings five years after graduation for university graduates (£26,000 compared to £29,100)[28], £2,100 lower for HE college graduates three years after graduation (£15,000 compared to £17,000), and £9,800 lower for Modern Apprenticeship completers five years after completing (£16,000 compared to £25,800).[29]
While not restricted to the 16 to 24 age cohort, this data adds to the understanding of how one's earnings develop by gender when an individual moves from education to employment and reinforces the statistics presented above. However, some caution is also required as the differences in earnings can be influenced by subject studied, level of qualification and mode of employment. This is especially the case in Modern Apprenticeship statistics where the large difference in earnings between males and females can partially be explained by the occupation choice.
Skills profile of the population aged 18 to 24
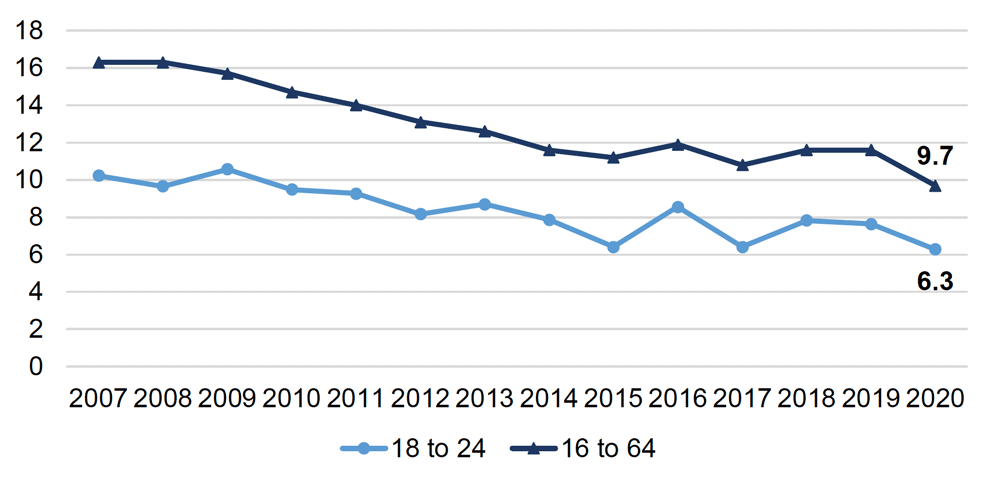
One of the National Performance Framework indicators looks at the skill profile of the population through a measure on the proportion of the population (aged 16 to 64) with low (SCQF level 4 or below) or no qualifications.
Chart 2.7 shows that there is a smaller proportion of young people aged 18 to 24 with low or no qualifications compared to the population aged 16 to 64 – 6.3% compared to 9.7% in 2020. However, the gap has narrowed from 6.1 pp in 2007 to 3.4 pp in 2020. The proportion has decreased over time, from 10.2% in 2007 to 6.3% in 2020 for those aged 18 to 24 and from 16.3% in 2007 to 9.7% in 2020 for those aged 16 to 64.
The reason why the focus here is on 18 to 24 year olds rather than 16 to 24 year olds is to allow young people aged 16 to 17 the opportunity to obtain qualifications above SCQF level 4.
Source: SG analysis of Annual Population Survey data (ONS, Jan-Dec datasets)