Welfare reform - impact on households with children: report
A report that presents analysis of the impacts of UK Government reform on households with children in Scotland.
Part of
5 Cumulative impacts
Background
When new policies are introduced, they interact with those which are already in place. Considering the cumulative impacts of reversing both recent reforms and historical reforms therefore allows us to consider how welfare policies combine to impact the living standards of families.
Expenditure
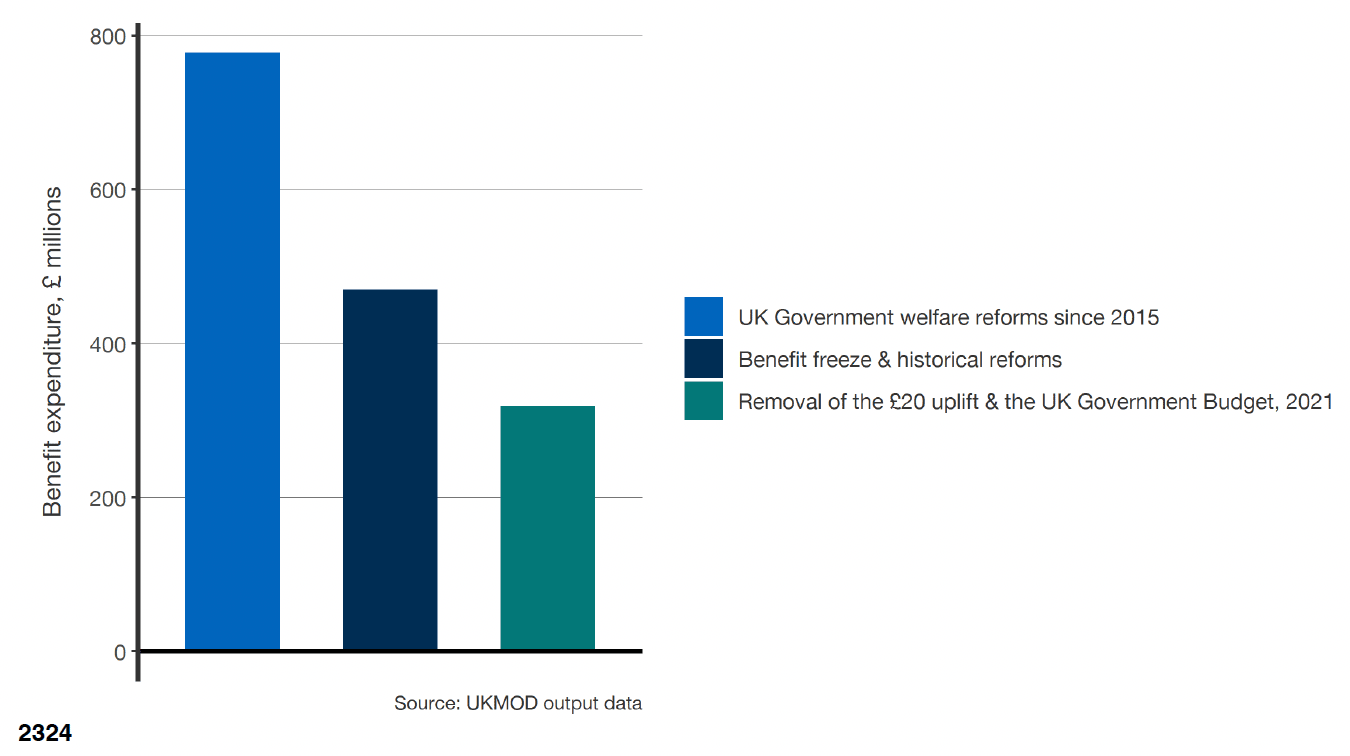
As shown in the graph (figure 5.1), the total cost of reversing UK Government reforms since 2015 would be around £780 million in 2023-24. This is a cumulative figure, with the cost of reversing the benefit freeze, the two-child limit and the removal of the family element (£470 million) and the reversal of recent reforms (£320 million) contributing to the total, including the offsetting effect of reversing the 2021 budget measures. These figures include both expenditure made by the UK Government (£730 million) on reserved benefits such as Universal Credit and by the Scottish Government on devolved social security (£50 million) such as the Scottish Child Payment.
Disposable income
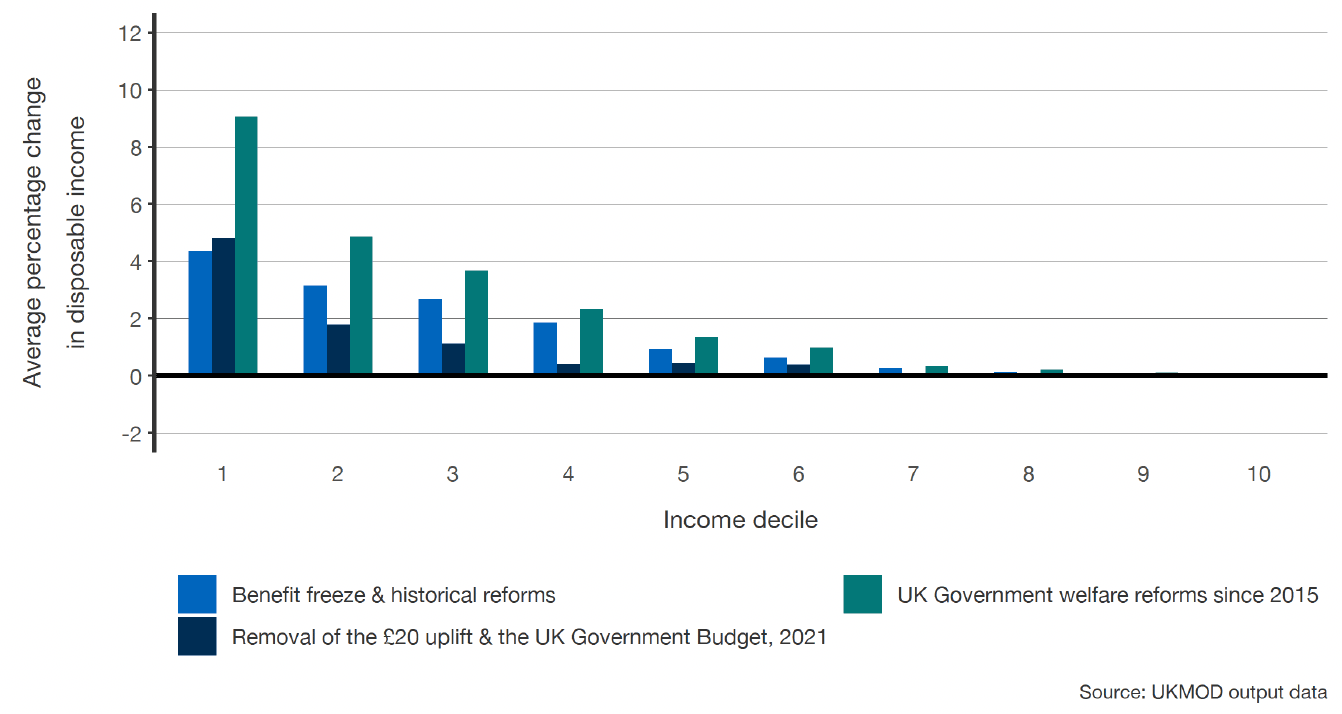
As shown in the graph (figure 5.2), reversing both sets of reforms would have most impact on those in the lowest disposable income deciles, with the 10% of people in households with lowest incomes seeing increases of around 9% on average. The impact on incomes reduces as incomes increase, with recent welfare reforms contributing to this effect.
Depending on the median income in 2023-24, all households in income decile one and two and most in decile three will be in poverty. The cumulative impact of reversing all UK government reforms on people near the poverty line could be less than half that in the lowest income decile.
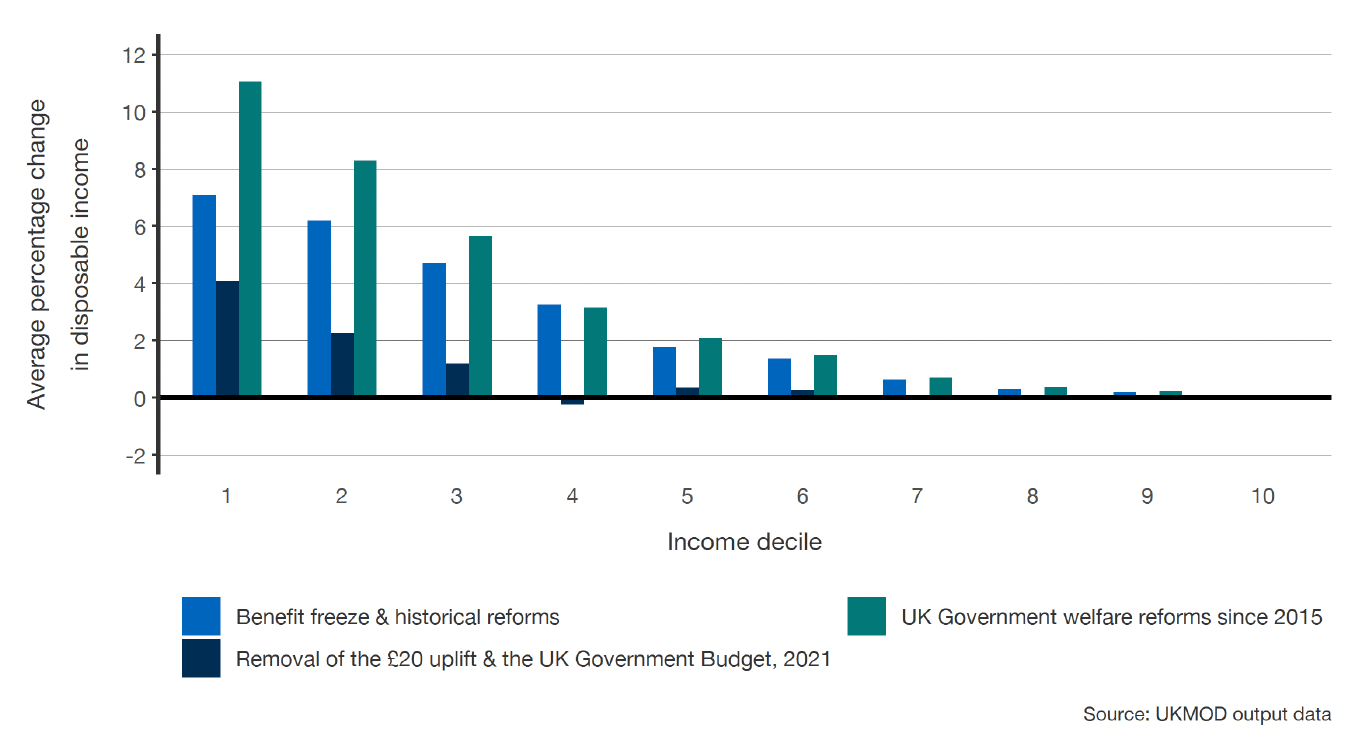
Figure 5.3 demonstrates that reversing all reforms would have a much larger impact on households with children, with significant increases in household income for those in the lowest income deciles (around 11%).
Recent welfare reforms are less important for children in these lower income deciles, and have negligible impact on those in decile 4 and above. Reversing the benefit freeze, the two-child limit and the removal of the family element would have a much more significant impact.
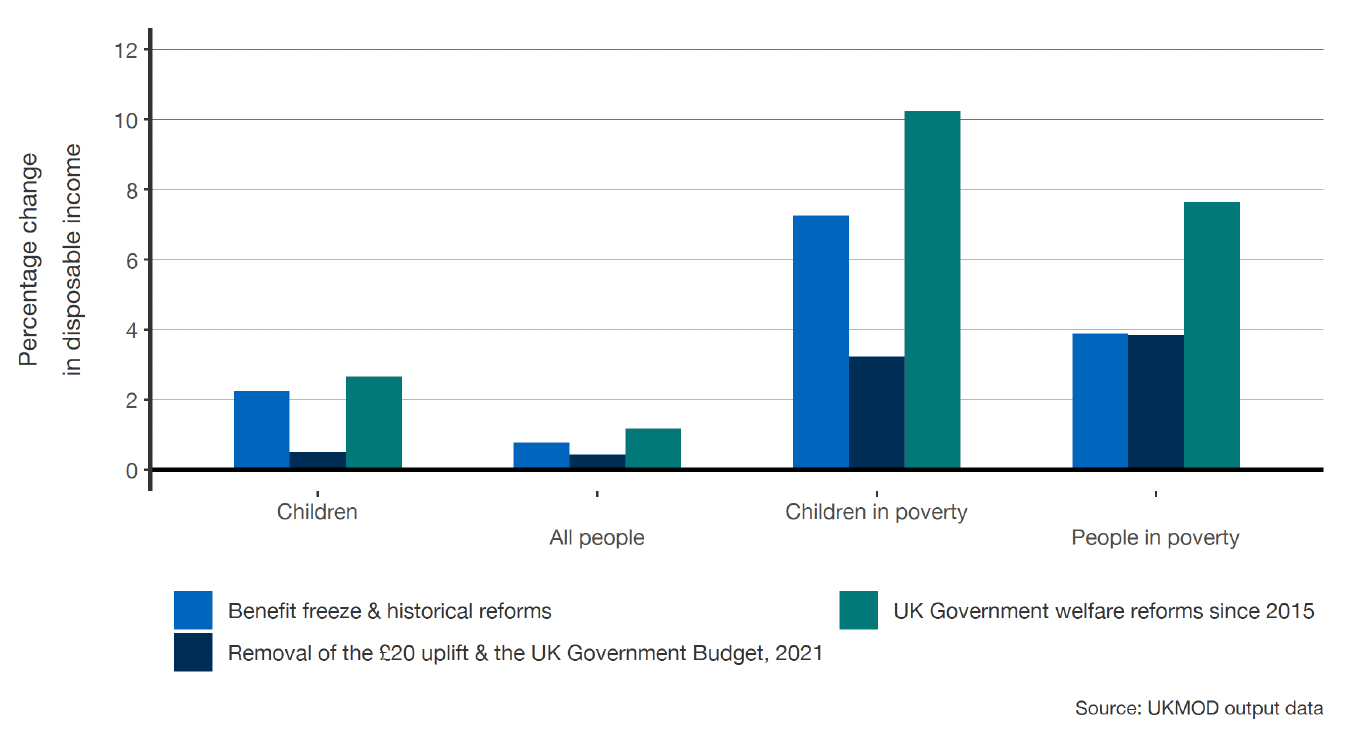
Figure 5.4 shows how reversing UK Government welfare reforms will have a marginal impact on incomes on average (around 1%). However, there will be a significant change for people under the poverty line in 2023-24 if all reforms are reversed. There is a particular impact on households in poverty with children (around 10% increase, on average), with reversing the two-child limit, the removal of the family element and the benefit freeze a more important policy change compared with the impact on other households.
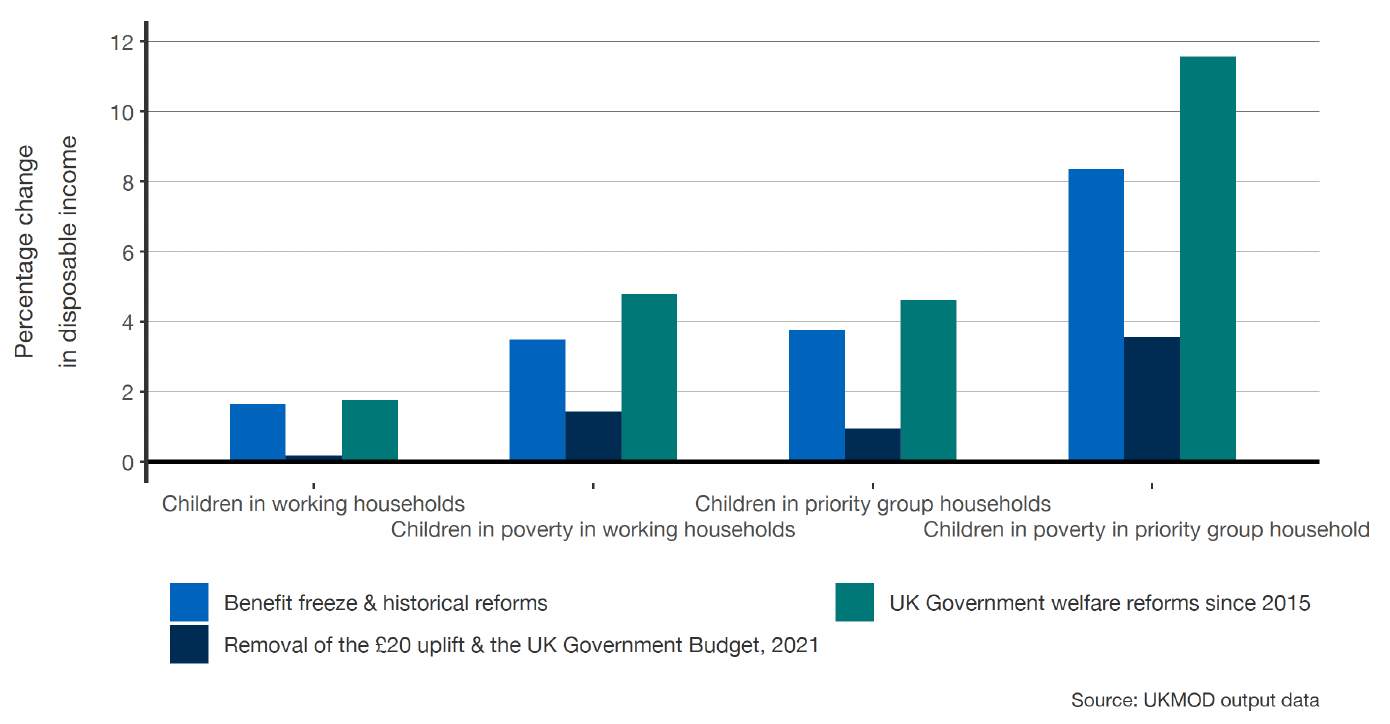
Figure 5.5 further demonstrates how important reversing the two-child limit and the removal of the family element would be for children in poverty, while reversing all reforms would lead to a very significant increase of nearly 12% for the average income of children in poverty in the child poverty priority groups.
Household example: In 2023-24, the Hewitt household has earnings of £2,600 per month, with one adult working full time on the minimum wage and another working three days per week. They have three children. They live in Stirling and receive support for their housing costs with an Universal Credit award of £790 per month and Child Benefit of £52 per month. They pay income taxes of £180 per month.
- - Reinstating the £20 uplift would increase their household income by £93 per month in 2023-24.
- - Reversing the change to the Universal Credit earnings taper rate and work allowances would reduce their new, higher award by £203 per month, with their earnings eating into their benefit award at a higher rate of 63%.
- - Abolishing the two-child limit and reinstating the family element would increase their award by an additional £303 per month, with their third child now recognised in their benefit award.
- - Reversing the residual impact of the benefit freeze would impact on every non-housing element of their Universal Credit award (including the reinstated family element) along with child benefit. This would further increase their award by £91 per month, taking into account of the period when benefits were frozen between 2015 and 2019.
The cumulative impact of reversing all these reforms would increase their benefit award by £283 per month (34%). It would increase their disposable income (after housing costs) by 12%.
Poverty
The cumulative impact of reversing all UK Government reforms would reduce poverty in 2023-24. The graph above (figure 5.6) shows this would have a particular impact on child poverty, reducing the poverty rate by 3 percentage points. However, working households in poverty are less likely to be affected by the changes.
| Benefit freeze, the two-child limit and the removal of the family element | Removal of the £20 uplift & the UK Government Budget, 2021 | UK Government welfare reforms since 2015 | |
|---|---|---|---|
| All people | -1 | -1 | -1 |
| Children | -2 | -1 | -3 |
| People in working households | * | * | -1 |
| Children in working households | -1 | * | -1 |
| Children in single households | -5 | -2 | -7 |
| Children in couple households | -1 | * | -1 |
| Children in priority group households | -4 | -1 | -5 |
| People in absolute poverty | -1 | -1 | -2 |
| Children in absolute poverty | -2 | -1 | -3 |
Figure 5.6 demonstrates that the poverty rate for children in single adult households would be particularly affected by the reversal of these reforms, reducing it by around 7 percentage points. There is also a significant impact for children in priority group households (5 percentage points). The cumulative impact of reversing the benefit freeze, the two-child limit and the removal of the family element contributes more to these changes than more recent welfare reforms. The poverty rate for children in couple households is less sensitive to these changes.
The table also demonstrates that the absolute poverty rate for both children is about as sensitive to reversing all UK Government reforms as the relative poverty rate, while it is higher for people in general. The child poverty rate is more responsive to reversing the benefit freeze, the two-child limit and the removal of the family element relative to more recent reforms.
| Benefit freeze, the two-child limit and the removal of the family element | Removal of the £20 uplift & the UK Government Budget, 2021 | UK Government welfare reforms since 2015[27] | |
|---|---|---|---|
| All people | 30,000 | 30,000 | 70,000 |
| Children | 20,000 | 10,000 | 30,000 |
| People in working households | 10,000 | 10,000 | 20,000 |
| Children in working households | * | * | 10,000 |
| Children in single households | 20,000 | * | 20,000 |
| Children in couple households | 10,000 | * | 10,000 |
| Children in priority group households | 20,000 | * | 30,000 |
Reversing UK Government welfare reforms since 2015 would have a significant impact on poverty rates in Scotland. The table above (figure 5.7) shows that 70,000 people would be moved out of poverty in 2023-24, including 30,000 children.
10,000 of these children would be in working households, and 20,000 would be in single adult households. 30,000 are in priority groups for child poverty.
We can combine our analysis of additional expenditure and poverty rates to find which policies are most cost-efficient for moving people above (or below) the poverty line.
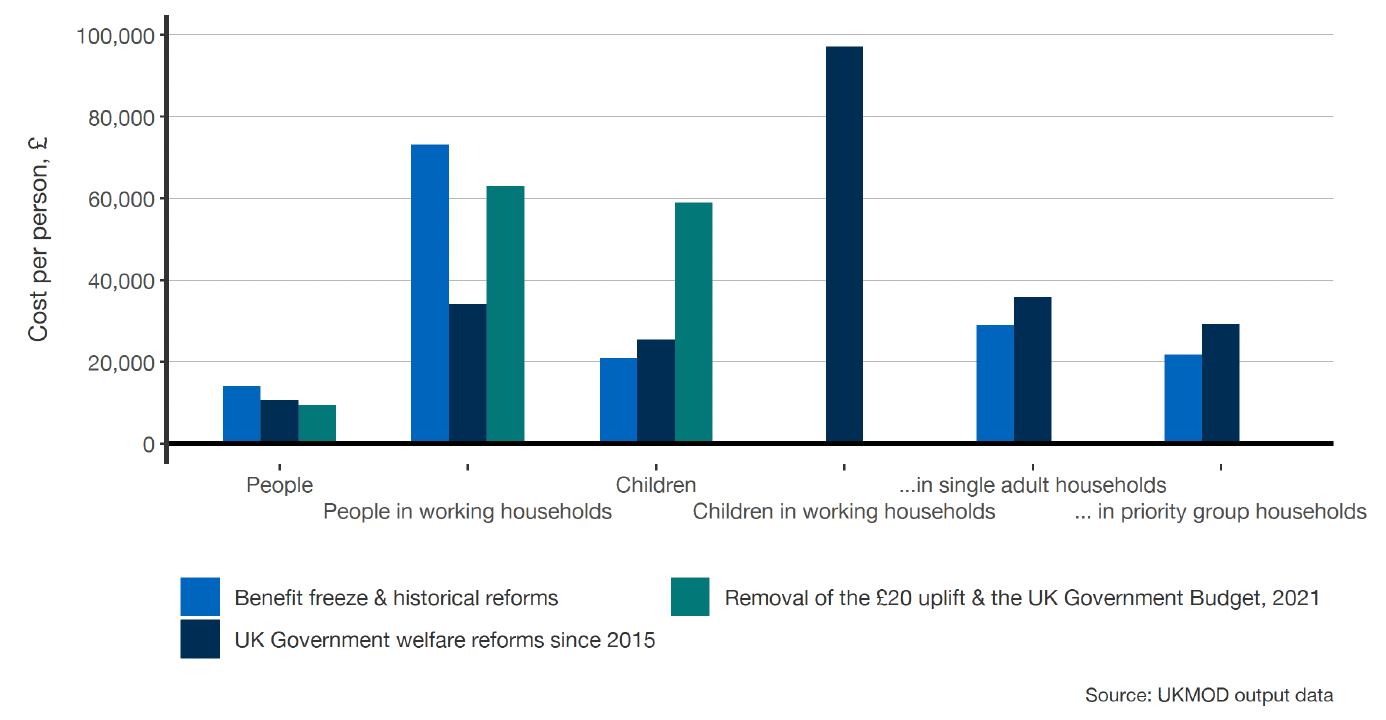
As shown in the graph (figure 5.8), reversing all welfare reforms since 2015 would cost less than £10,000 per person taken out of poverty.
Given the lower number of people in working households and children, it generally costs more to bring them out of poverty. However, the graph does show that reversing older reforms is more effective for targeting children, generally, while for working households reversing all UK Government reforms is most cost-effective (even though this increases the earnings taper rate and work allowance). Only for working households is there an efficiency gain by reversing all reforms.
There are a number of types of household, such as children in working households, where few people were brought in or out of poverty; the only discernible impact on poverty rates would come from reversing all reforms.
Work incentives
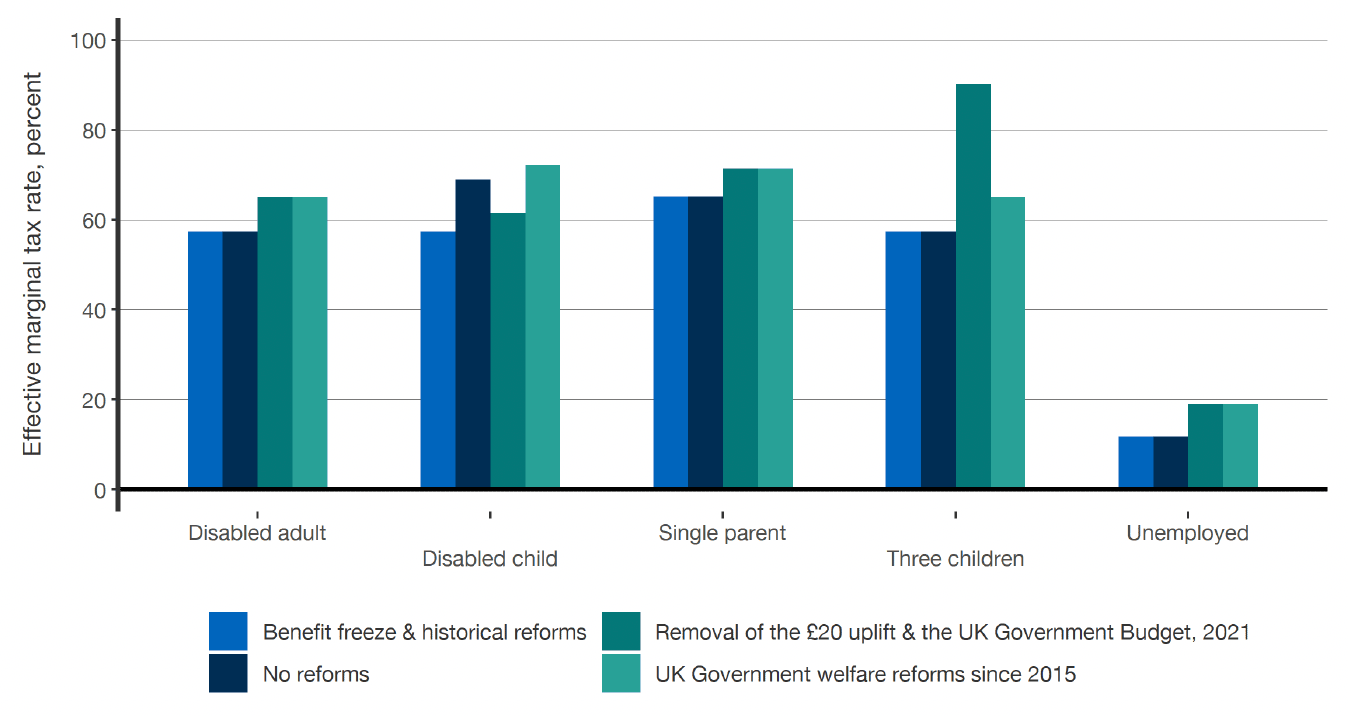
The graph above (figure 5.9) demonstrates that reversing all UK Government welfare reforms since 2015 increase the 'tax rate' for these example households, as increases in benefit award interact with changes in the Universal Credit earnings taper rate.
The graph also demonstrates the interactions between the policy reforms; for families with a large number of children, reversing the change to the taper rate would have a significant impact on the 'tax rate', but this impact would be largely offset by reversing other reforms.
Contact
Email: spencer.thompson@gov.scot