Welfare reform - impact on households with children: report
A report that presents analysis of the impacts of UK Government reform on households with children in Scotland.
Part of
4 The two-child limit, the removal of the family element and the benefit freeze
Background
The benefit cap and the 'bedroom tax'.
The benefit cap and the 'bedroom tax' will both be mitigated by the Scottish Government by 2023-24 through Discretionary Housing Payments. This analysis therefore does not assess the impact of these interventions. Mitigation through Discretionary Housing Payments is incorporated into the model.
The two-child limit
The two child limit was introduced in 2017 and limits child tax credit and Universal Credit awards to two children per household. The policy affects those born from 6 April 2017. There are a number of exceptions to the rule.
We can expect the number of households affected by the two child limit to increase over time as more children have birthdays after April 2017. The number will continue to increase until April 2033, when all eligible children will have been born after April 2017.
The removal of the family element
In line with the two child limit, the family element of child tax credit and Universal Credit (also known as the 'first child premium') were removed in 2017. The family element is now only available to households with children born before 6 April 2017, and constitutes a cut of over £545 per annum for households with all children born after this date.
The benefit freeze
The benefit freeze was in place between 2015 and 2019 and affected a number of UK Government benefits such as Universal Credit, working tax credit and housing benefit. While these benefits have been uprated for inflation since 2019, the residual impact of the freeze is retained in the benefit rates available now and in 2023-24.
Universal Credit standard allowances would be 6% larger in 2023-24 had the allowances not been frozen between 2015 and 2019.
Expenditure
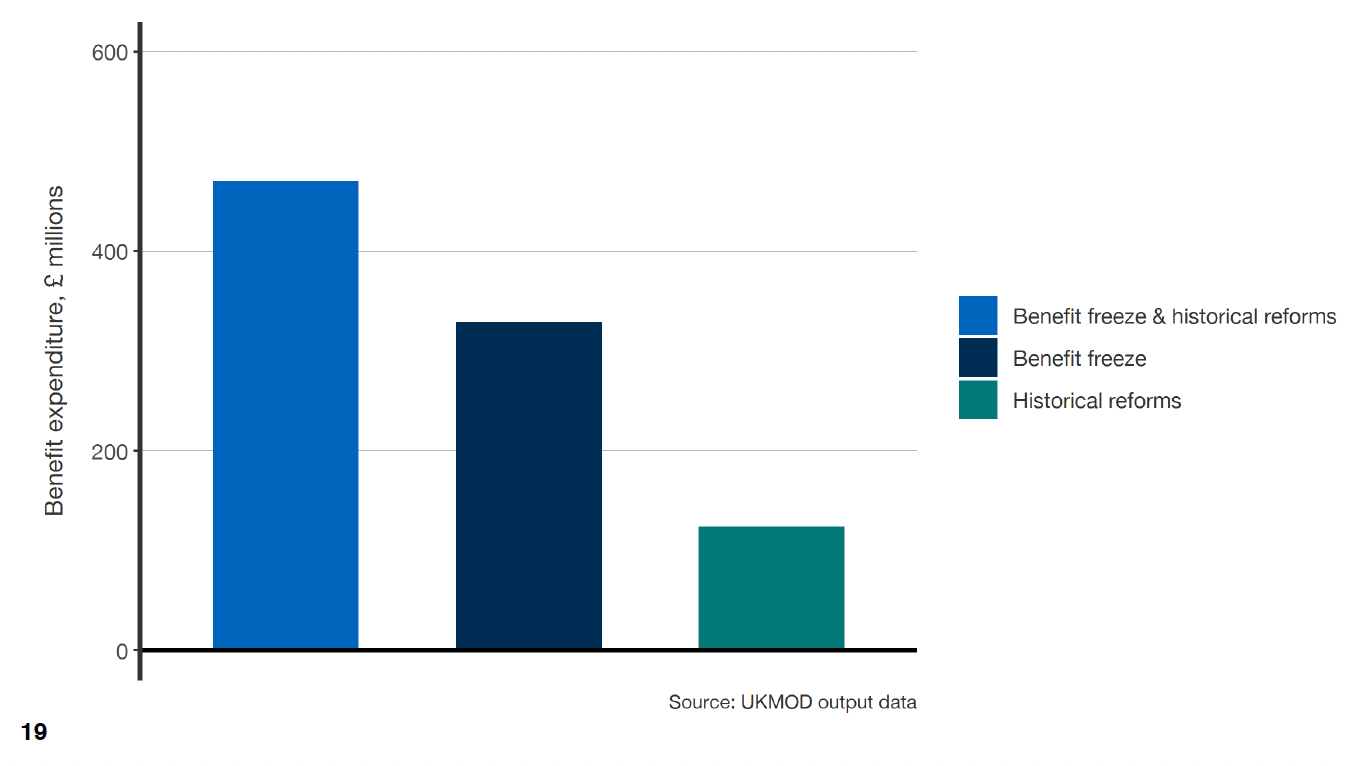
As shown in the graph (figure 4.1), the total cost of reversing the benefit freeze, the two-child limit and the removal of the family element would be around £470 million per annum in 2023-24. This is a cumulative figure, with the cost of reversing the benefit freeze (£330 million) complemented by the reversal of the two-child limit and the removal of the family element (£120 million). The figures include both expenditure made by the UK Government on reserved benefits such as Universal Credit and by the Scottish Government on devolved social security such as the Scottish Child Payment.
The expenditure figures for the two sets of policies do not add up to the cumulative total for reversing both together. This is a result of the interactions between the two sets of policies.
Household example: After the reversal of the two-child limit and the reintroduction of the family element, the Donald household now have additional benefit income allocated to them for their third child born after 2017 (£254), plus an additional payment for their first child (£49). – a total of £303 per month.
This income is further increased by the reversal of the benefit freeze, with their benefits – including those allocated for their third child – being uplifted in line with inflation between 2015 and 2019.
Disposable income
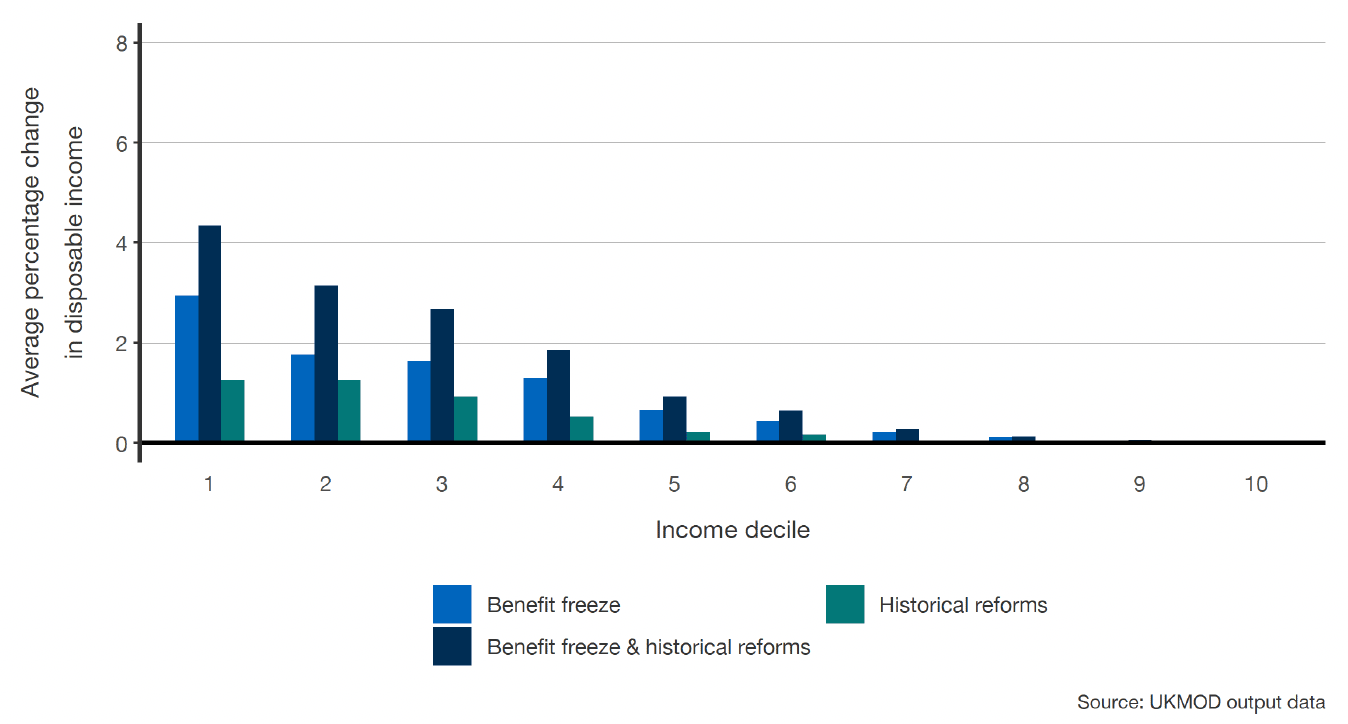
As shown in the graph (figure 4.2), reversing both these reforms would have most impact on those in the lowest disposable income deciles, with the 10% of people in households with lowest incomes seeing increases of around 4% on average.
The impact of reversing the benefit freeze is less progressive than reversing the two-child limit and the removal of the family element, with a smaller proportional impact on people with lower incomes relative to those on higher incomes.
Depending on the median income in 2023-24, all households in income decile one and two and most in decile three will be in poverty. The cumulative impact of reversing both reforms would have a significant positive impact for these households.
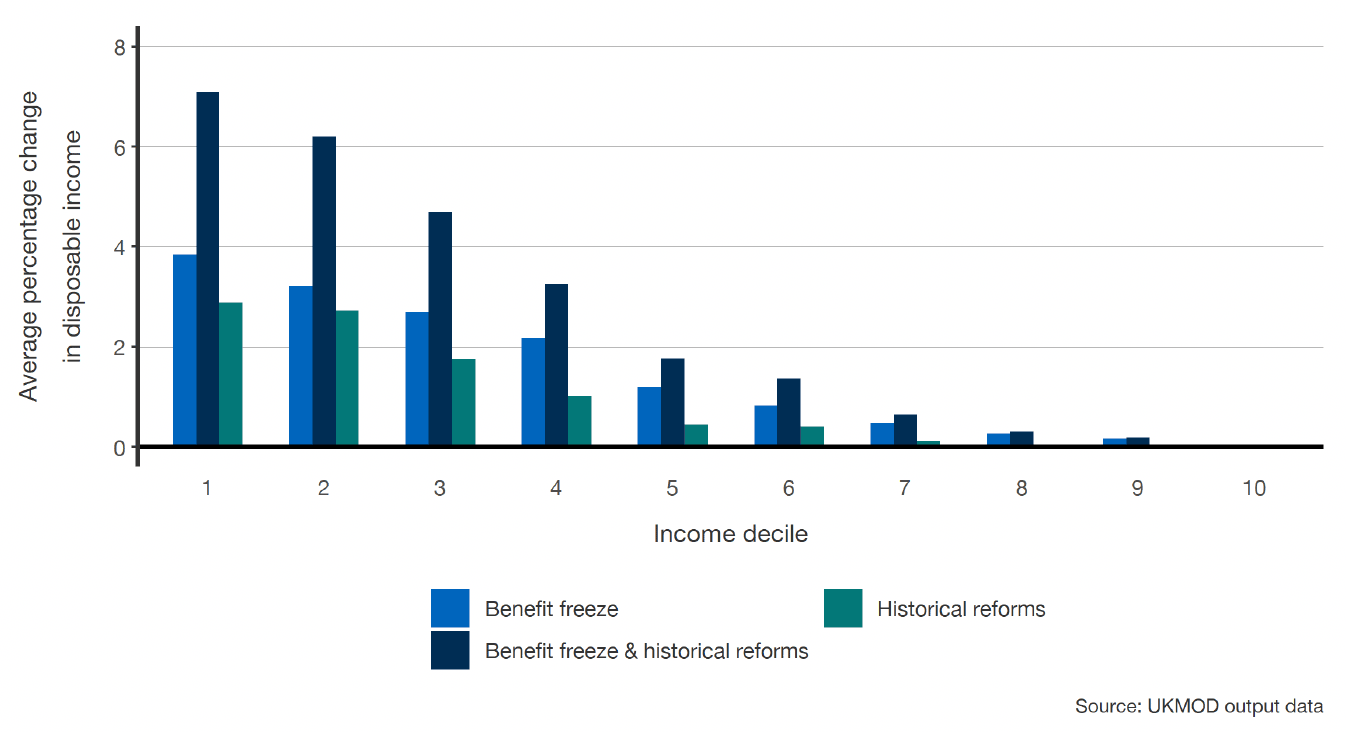
Figure 4.3 demonstrates that, as expected, reversing the reforms would have a much larger impact on households with children, with significant increases in household income for those in the lowest income deciles.
In particular, the impact of reversing the benefit freeze is above 2% across deciles one to four, and is likely to influence the poverty rate for households with children. Reversing the two-child limit and the removal of the family element has a more significant influence on those with the very lowest incomes.
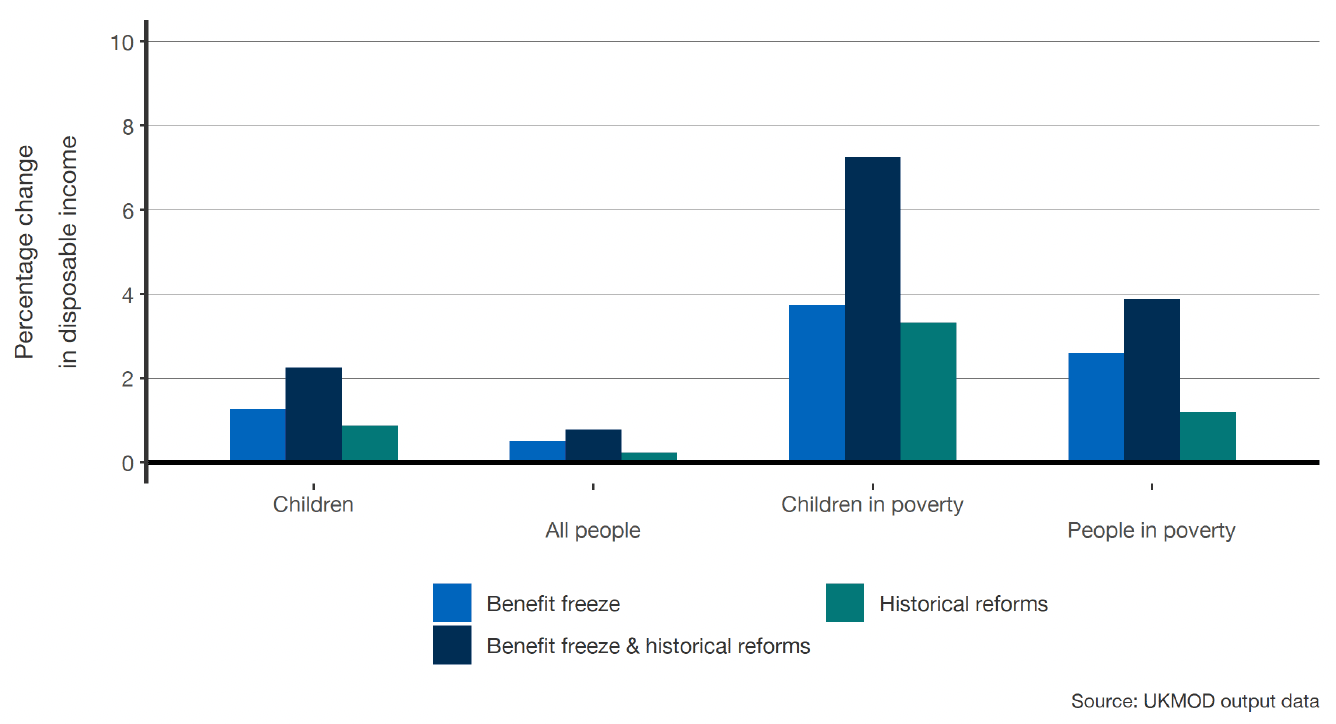
Figure 4.4 shows how reversing these reforms will have a marginal impact on disposable income on average. However, there will be a significant change, in aggregate, for people under the poverty line in 2023-24 if both sets of reforms are reversed. There is a particular impact on households in poverty with children, with reversing the two-child limit and the removal of the family element being a more important policy change relative to other households.
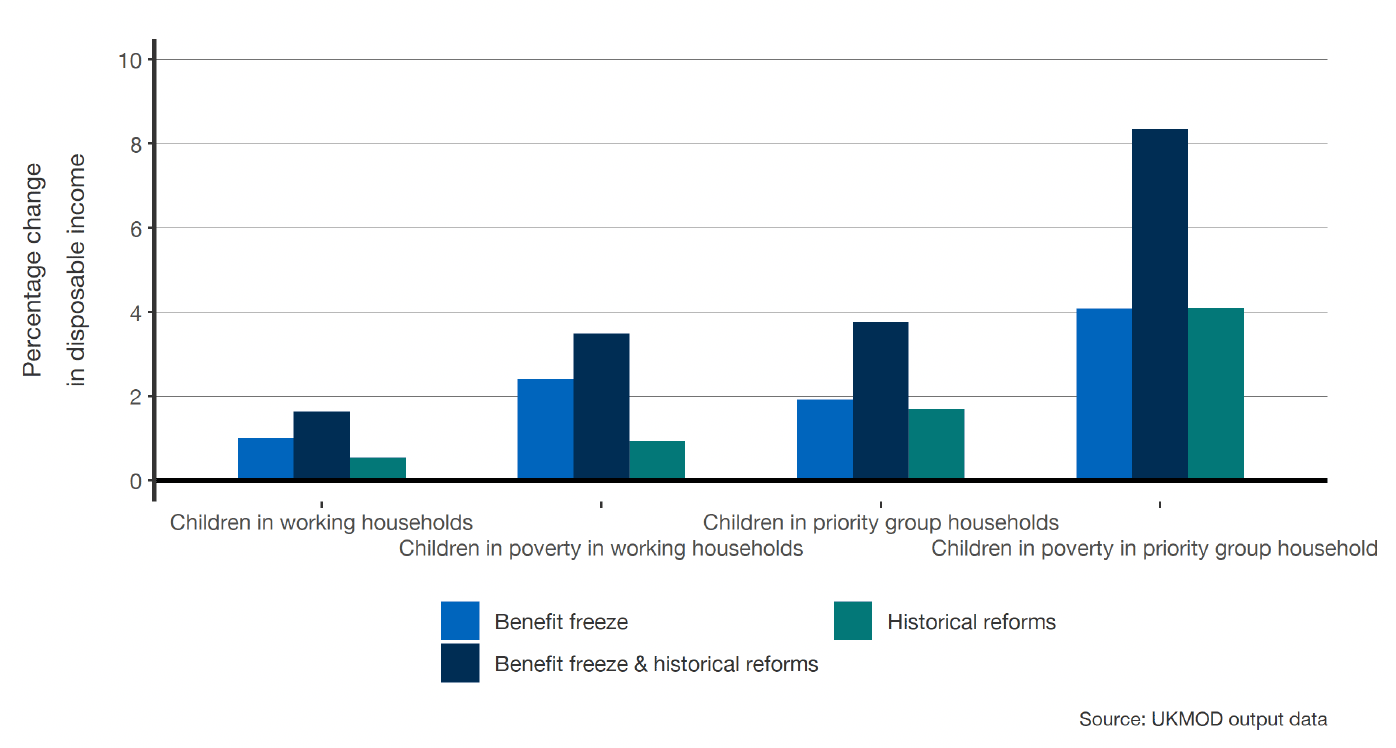
Figure 4.5 further demonstrates how important reversing the two-child limit and the removal of the family element would be for children in poverty, while reversing both reforms would lead to a significant increase of 8% for the average income of children in poverty in the priority groups.
Reversing the benefit freeze tends to have more impact on children in working households compared with other types of household.
Poverty
The cumulative impact of reversing the benefit freeze, the two-child limit and the removal of the family element would reduce poverty in 2023-24. The table below (figure 4.6) shows how both reforms would reduce child poverty. However, working households in poverty are less likely to be affected by the changes.
| Benefit freeze | Two-child limit and the removal of the family element | Both | |
|---|---|---|---|
| All people | * | * | -1 |
| Children | -1 | -1 | -2 |
| People in working households | * | * | * |
| Children in working households | * | * | -1 |
| Children in single households | -3 | -3 | -5 |
| Children in couple households | * | * | -1 |
| Children in priority group households | -2 | -2 | -4 |
| People in absolute poverty | -1 | * | -1 |
| Children in absolute poverty | -1 | -1 | -2 |
Figure 4.7 demonstrates that the poverty rate for single adult households with children would be particularly affected by the reversal of these reforms. The same is true for children in priority group households. However, the poverty rate for children in couple households is less sensitive to these changes.
The absolute poverty rate for both children is about as sensitive to reversing these reforms as the relative poverty rate, with both reforms having a similar impact.
| Benefit freeze | Two-child limit and the removal of the family element | Both[22] | |
|---|---|---|---|
| All people | 20,000 | 10,000 | 30,000 |
| Children | 10,000 | 10,000 | 20,000 |
| People in working households | * | * | 10,000 |
| Children in working households | * | * | * |
| Children in single households | 10,000 | 10,000 | 20,000 |
| Children in couple households | * | * | 10,000 |
| Children in priority group households | 10,000 | 10,000 | 20,000 |
Reversing historical reforms and the benefit freeze has a large impact on those on or around the poverty line. The table above (figure 4.7) shows that 20,000 people would be moved out of poverty in 2023-24, including 10,000 children.
This would not have a significant impact on in-work poverty, but does have a particular impact on children in priority group households. The majority of children affected are in single adult households.
We can combine our analysis of additional expenditure and poverty rates to find which policies are most cost-efficient for moving people above (or below) the poverty line.
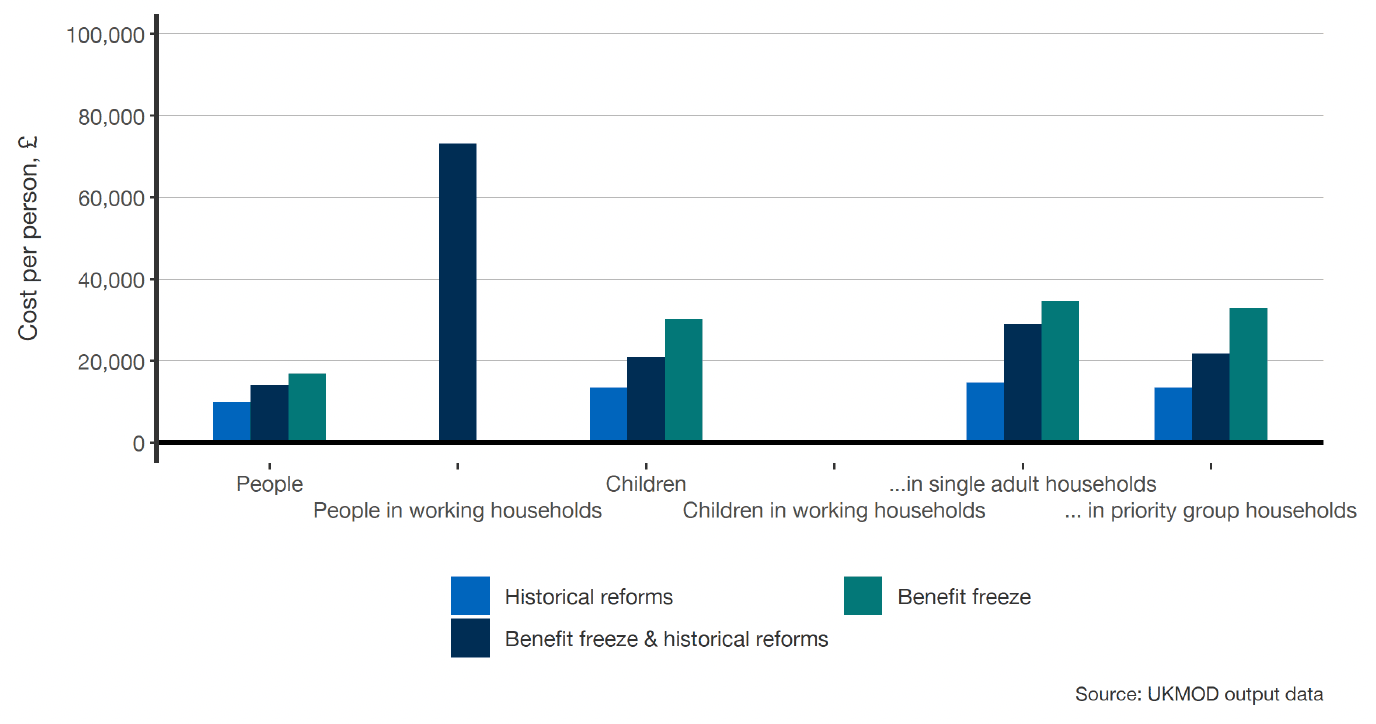
As shown in the graph (figure 4.8), reversing the two-child limit and the removal of the family element would cost less than £10,000 per person taken out of poverty.
There are no cases where reversing both reforms leads to efficiencies, with reversing the two-child limit and the removal of the family element usually the most cost-effective option, particularly for children. This is despite the benefit freeze having a larger overall impact on poverty rates.
There are a number of types of household, such as children in working households, where few people were brought in or out of poverty. These results have not been included in the chart, and demonstrate where reversing the reform would have no discernible impact on poverty rates for that group.
Work incentives
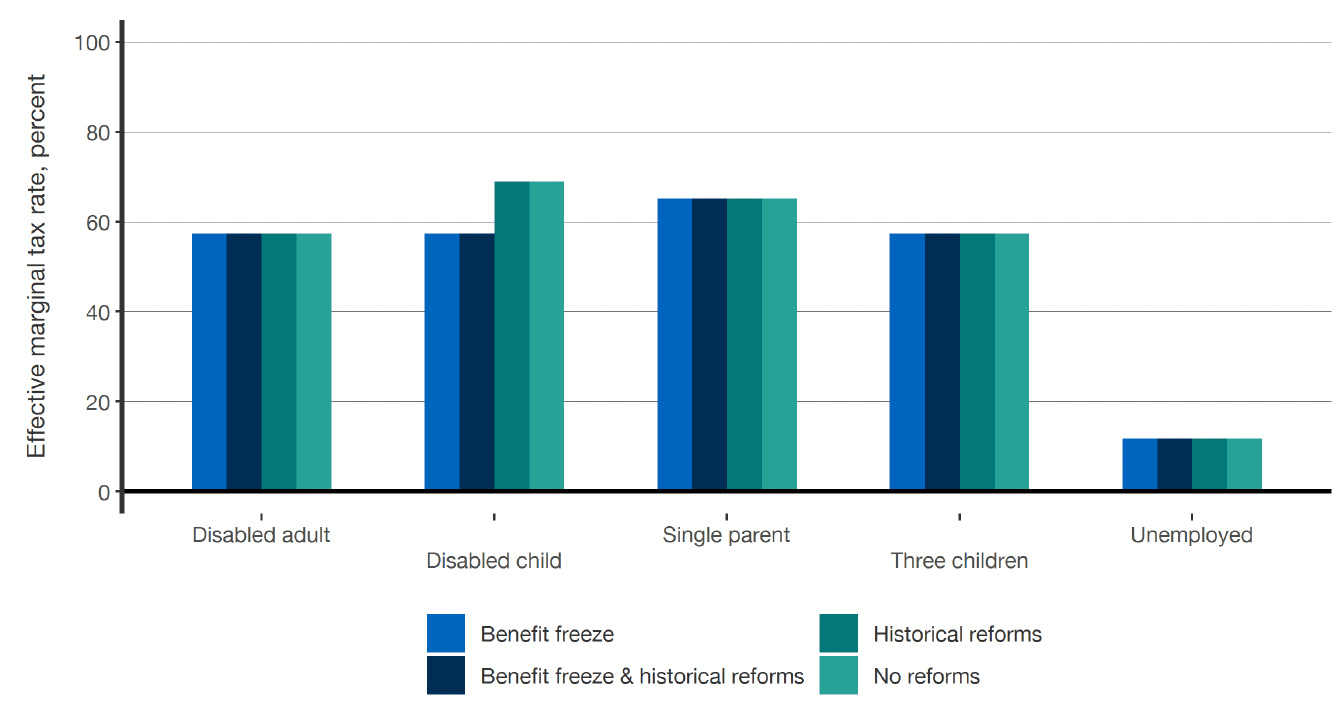
The graph above (figure 4.9) demonstrates that compared with changes to the Universal Credit taper rate and work allowances, the reforms detailed in this section only have an impact on work incentives if households are close to the threshold for eligibility for benefits.
For most households the marginal effective rate is unchanged as a result of reversing these policies. For a household with a disabled child, reversing the benefit freeze reduces the effective tax rate because the increased benefit award keeps them above the eligibility income threshold for other benefits.
Contact
Email: spencer.thompson@gov.scot