Welfare reform - impact on households with children: report
A report that presents analysis of the impacts of UK Government reform on households with children in Scotland.
Part of
2 Introduction
This report is part of the Scottish Government's Welfare Reform report series. We have used the microsimulation model 'UKMOD' to assess the impact of reversing a number of UK Government welfare reforms on households with children, and is the second such report to focus on this type of household.[1] We focus on the impact of reversing these reforms in the future, rather than the effect of the reforms themselves at the time they were implemented, to enable us to make a like-for-like assessment in the same period, namely 2023-24.
Of particular interest is child poverty. In 2017 the Scottish Parliament passed the Child Poverty (Scotland) Act which sets statutory targets for the reduction of child poverty by 2030, with interim targets to be met in 2023. This report sheds light on the impact of UK Government policy on poverty in Scotland, and what interventions might be most effective for reaching these targets. It therefore complements the Cumulative Impact Assessment which was published alongside the second Tackling Child Poverty Delivery Plan, setting out the impact of Scottish Government policies on child poverty and projecting the child poverty rate in 2023-24.[2]
As shown in the graph below (figure 2.1), people in households with children tend to have lower disposable incomes compared with people in households without children. The income distribution of such households is also more concentrated, which means more people in these households have incomes between the poverty line and the median income line.
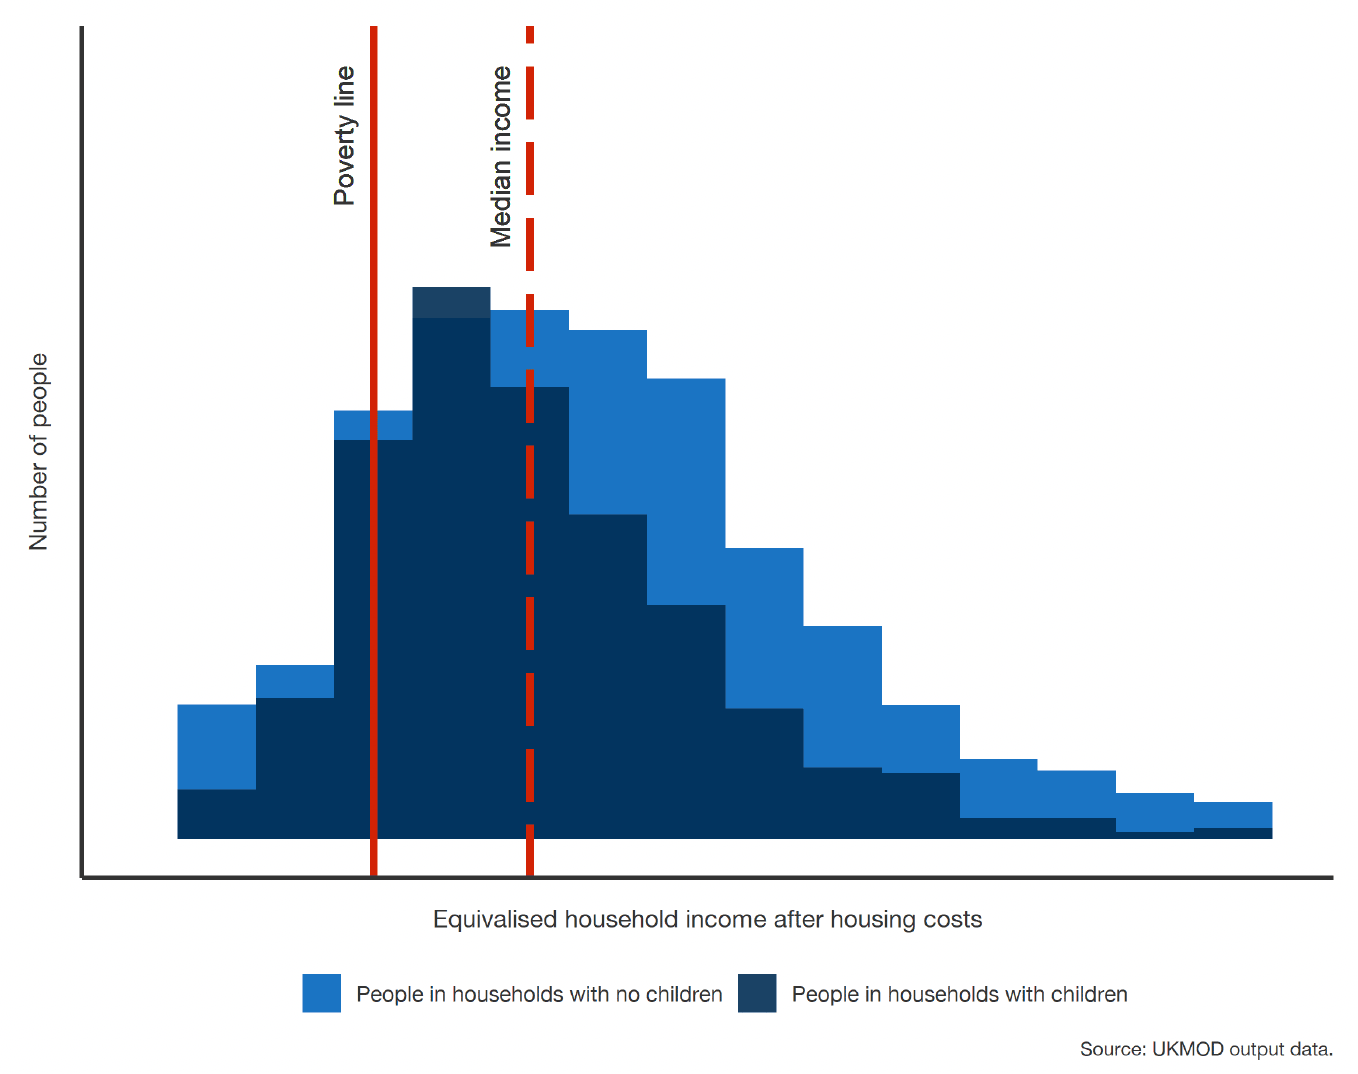
As a result, the poverty rate for people in households with children can be sensitive to policy reform, with potentially many people being moved above or below the poverty line (indicated here with the solid vertical line) when changes are made. This is particularly the case if such policies do not have a large impact on the UK median income (dashed line), the base from which the poverty line is calculated.
We also know from OECD data that a key distinction between the United Kingdom and countries with lower child poverty rates is the rate of in work poverty, as show in figure 2.2. Despite rates of out of work poverty being significantly lower in the United Kingdom compared with Sweden or Norway, the large number of people who are in poverty while in work means the overall child poverty rate is higher than elsewhere.
| Out of work | In work | All | |
|---|---|---|---|
| United Kingdom | 39% | 7% | 12% |
| Sweden | 77% | 5% | 9% |
| Norway | 59% | 4% | 8% |
| Iceland | 17% | 5% | 6% |
| Denmark | 32% | 2% | 4% |
| Finland | 35% | 1% | 3% |
We also know that the proportion of households in poverty that are in work has increased in Scotland from 48% in 1996-99 to 59% in 2014-17. [6] As such, a particular focus of this report is the impact of welfare reform on working households with children.
There have been a number of welfare reforms over the past five years that have had an impact on households with children. To explore how these have affected the distribution described above, we have selected a number of key reforms and broken these down into three groups:
- Recent reforms, including the change to the Universal Credit earnings taper rate and work allowances, and the removal of the temporary £20 uplift to Universal Credit;
- Historical reforms, including the benefit freeze, the two-child limit, and the removal of the family element from Universal Credit and Tax Credits;
- A cumulative assessment of all these reforms.
We do not model the impacts of the benefit cap, which was introduced in 2013 and lowered in 2016. While this policy primarily affects households with children, the second Tackling Child Poverty Delivery Plan committed to mitigate the cap as fully as possible through Discretionary Housing Payments, beginning in 2022. This commitment is incorporated in the model. The impacts of some of the other policies modelled here are likely to be higher as a result of mitigating the benefit cap. This is because the benefit cap would have previously limited the impacts of policies for households which were subject to the cap.
In order to provide a full picture of the impact of each policy, and how that impact may differ for households with children, this report assesses changes to:
- Benefits expenditure (including Scottish Government social security spending)[7]
- Poverty
- Child poverty
- Income for people in priority groups for child poverty[8]
- Income for working and non-working households, with and without children
- Income for single and couple households, with and without children
- Income, broken down by income deciles, with and without children.
By comparing changes in benefits expenditure with indicators such as child poverty, we also estimate how efficient reversing each reform would be for reducing the number of people in poverty.
In addition to these short term impacts, this report also considers the behavioural impact of these changes on families by estimating the 'effective marginal tax rate' for households considering working an additional 10 hours a week. This measures the proportion of additional earnings which are lost to taxes and a reduction in benefit entitlements, which could affect the incentive to undertake paid work.
We have developed a set of hypothetical households that represent the characteristics of the child poverty priority groups to test the impact on work incentives using this measure. Further detail is set out in Appendix D.
Contact
Email: spencer.thompson@gov.scot