Economic conditions of crofting: survey 2019 to 2022
This report provides a detailed outline of the uses and financial situation of crofts in the years between 2019 and 2022.
5. Investment in crofts and looking to the future
5.1. Summary of key points
- Where crofters had invested, this was most likely in livestock (46%). The median amount invested from crofters’ own money was £3,350 (£5,000 in 2018), and the mean was £12,832 (£20,007 in 2018). 39% of crofters had invested money from grant money or support schemes in the last three years, the median amount invested from grant money or support schemes being £5,000, while the mean investment was £4,612.
- One in ten respondents who had invested in their croft in the last three years reported additional income received because of the investment they made (16% in 2018). The median reported additional income was £1,000, down from £1,500 in 2018.
- 62% of respondents planned to invest in their croft in the next four years (up from 48% in 2018), and again crofters were most likely to invest in livestock (52%). The most common reason for not planning for future investment was due to the financial outlay or where it was believed that the costs would be too great (36%).
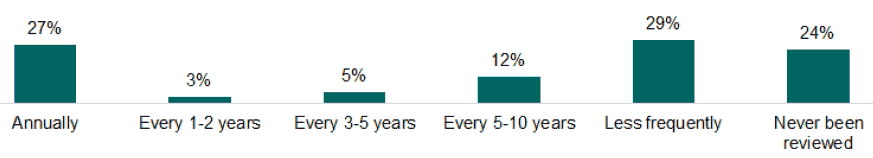
- The proportion of crofters with a succession plan in place has continued to increase with each survey, from 46% in 2014 to 47% in 2018 and 60% in 2022.
61% of respondents said they had invested in their croft in the last three years, which is a slight decrease from the 2018 survey where 68% had done so. This is higher than the proportion of crofters who said they planned to invest in the 2019-2022 period in the previous survey (48% in 2018). It is interesting to note that respondents aged 65 and over were less likely to have invested in their croft (49%) than respondents aged under 65 (69%). Furthermore, those who had been crofting for 20 years or more were less likely to have invested in their croft (54%) than those who had been crofting for less than three years (77%). Analysis by tenure indicates that owner occupiers were more likely to have invested in their croft (66%) than tenants (57%).
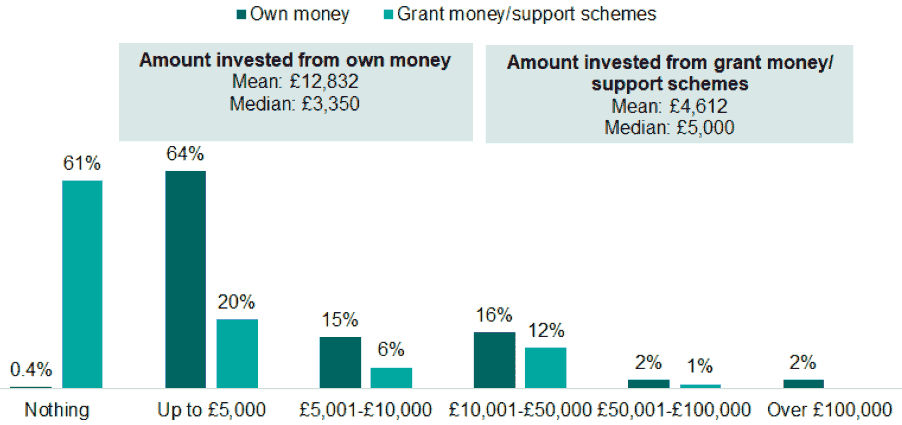
Base: Invested from own money, n=510; Invested from grant money/ support schemes, n=329
Those who had invested were asked about the amount they had invested from their own money and also any investment from grant money or support schemes since 2019. Firstly, in terms of investment from crofters’ own money, the median figure was £3,350 (£5,000 in 2018), and the mean was £12,832 (£20,007 in 2018). As shown in Figure 5.1, the majority had invested up to £5,000 (64%) of their own money with an additional 15% investing between £5,001 and £10,000 and 21% investing over £10,000.
39% of crofters had invested money from grant money or support schemes in the last three years, an increase from 24% in 2018. The median amount invested from public funding was £5,000 (£1,000 in 2018), while the mean investment was £4,612 (£6,554 in 2018).
In terms of the nature of the investment, just under half (46%) said the money was invested in livestock, 27% said it was for fencing or gates, 24% said it was for crops and 15% said it was for forestry or woodland creation.
5.3. Investment sourced from secured and unsecured loans
19 crofters (2%) said they had used a secured loan (i.e. a loan that requires something of value to be offered as collateral in case you cannot pay back the loan) for their investment and 15 crofters (2%) said they had used an unsecured loan (i.e. a loan made without an asset given as security). With regard to secured loans the mean was £12,705 and for unsecured loans the mean amount received was £23,213.
5.4. Additional income received as a result of investment
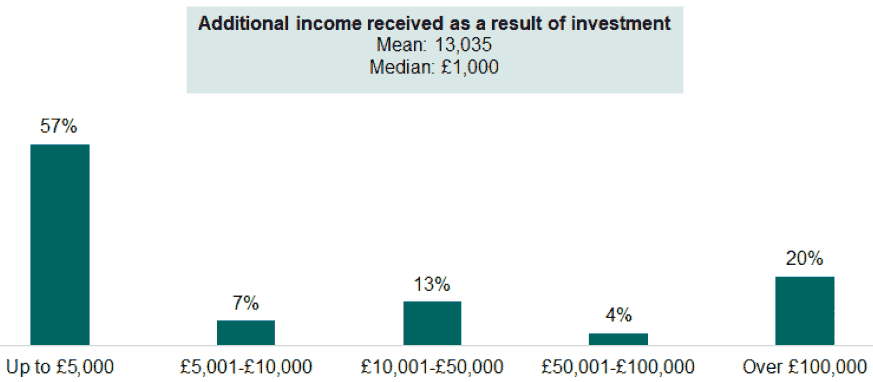
Base: n=56. NB This is crofters who have invested in their croft and provided income details.
10% of the crofters who had invested in their croft during the 2019-2022 period provided details of the additional income they had received as a result of the said investment. This is less than in the 2018 survey where 16% reported that they had received additional income. The median reported additional income has fallen from £1,500 in 2018 to £1,000 in 2022, however the mean income has risen from £6,219 to £13,035.
The majority of respondents did not anticipate there being any change in their income as a result of the investment made to their croft, while 17% said it was likely to increase (12% in 2018) and 11% said it was likely to decrease (4% in 2018).
When asked to provide their reasons for any anticipated change in their income as a result of investment made to their croft, 14% said that the improvements made were not to make profit and that they were, for example, to make processes easier, repairs or improving the ground. 11% mentioned rising costs and 10% said that increased productivity would mean a change to their income in the next 12 months.
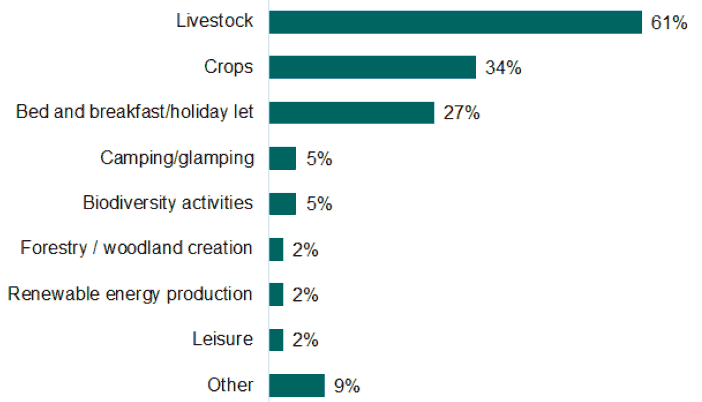
Base: respondents, n=494
Livestock (61%) was by far the greatest contributor to additional income among crofters, which was also the case in the previous survey (63%). This was followed by crops (34%) and bed and breakfast and holiday lets (27%). These were also the next two biggest contributors reported in the 2018 survey (13% and 17% respectively) and both have seen an increase compared to the previous survey.
5.5. Planned investment for 2023-2026
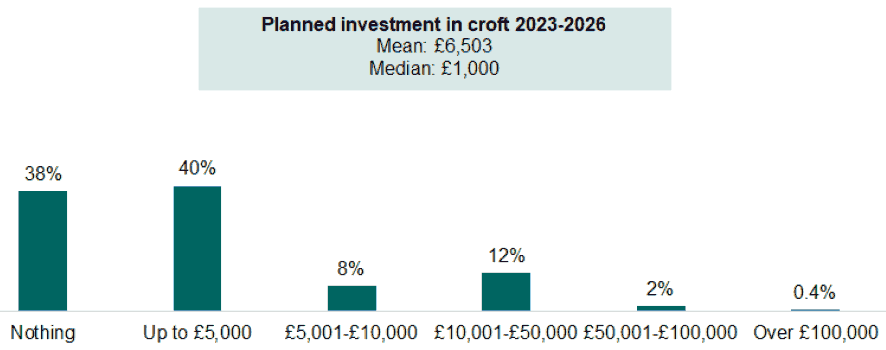
Base: respondents, n=793
Crofters were then asked about their planned investment for 2023-2026. Of those respondents, 62% had plans for investment which is up from the 48% reported in the 2018 survey and 55% in the 2014 survey. The median planned investment stated was £1,000, down from £2,000 in 2018 and the mean figure was £6,503, down from £16,450 in 2018 and £9,100 in 2014.
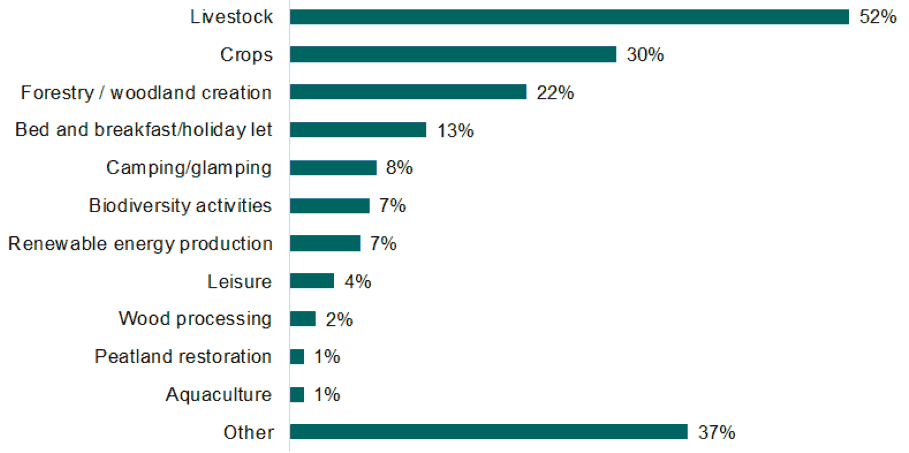
Base: respondents, n=464
Livestock was again by far the most common response when asked about how crofters plan to invest between 2023-2026 (52%), followed by crops (30%) and forestry and woodland creation (22%). In 2018 the three most common responses were livestock (57%), crops (28%) and bed and breakfast/ holiday let (16%).
Planning to invest in livestock was more common in crofters aged 16-44 (65%) and aged 45-54 (63%), than those aged 55-64 (46%) and aged 65 and over (40%). Crofters aged 65 and over were the least likely to plan to invest in camping or glamping facilities (2%). The nature of the planned investment does not vary significantly by gender.
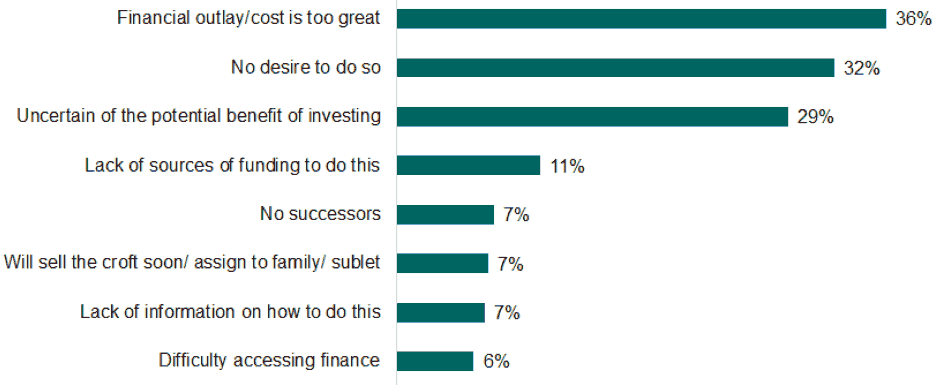
Base: respondents, n=263
Just under 36% of respondents did not plan on investing in their croft during 2023-2026. The most common reasons given were crofters believed the financial outlay or cost would be too great (36%), they had no desire to do so (32%), or they were uncertain of the potential benefit of investing (29%). These were also the top three reasons cited in 2018.
Crofters aged 65 and over were the most likely to have no desire to invest in their croft (40%), while those aged 55-64 were most likely to say the financial outlay or cost prevents them from investing in their croft. Crofters aged 16-44 were most likely to say that a lack of sources of funding stops them from being able to plan any investment (29%). A lack of information was cited by significantly more crofters aged 55-64 (21%) than aged 65 and over (5%).
5.6. Succession plans
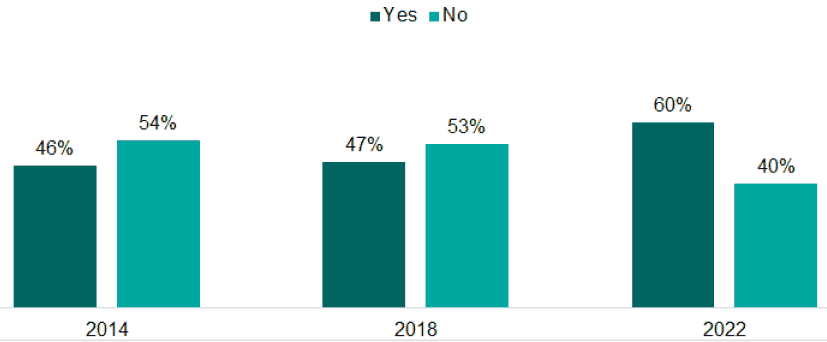
Base: respondents, 2022, n=887
The proportion of crofters with a succession plan in place has continued to increase with each survey, from 46% in 2014 to 47% in 2018 and 60% in 2022 as shown in Figure 5.7. Of those who had been crofting for 20 years or more, 71% reported to have a succession plan in place, compared to 44% of crofters who had been crofting for less than three years.
| Base: n=292 | % |
|---|---|
| No potential successor | 33% |
| Children/ successor not interested in crofting | 18% |
| No interest in making succession plan | 18% |
| Unsure/ haven't considered it yet | 16% |
| Legislation preventing succession to more than one successor | 7% |
| Children are too young, not made a decision yet | 5% |
| Other (e.g. only just bought croft, will consider once older, don’t have children) | 9% |
Of those who did not have a succession plan in place the most common reason was where respondents did not have a potential successor (33%). This was followed by those whose children or successors were not interested in crofting, and those that had no interest in making a succession plan, both of which came in at 18%.
5.7. Opinions on crofting
Base: respondents, n=873-888
Crofters were also asked to consider the extent to which they agreed or disagreed with a number of statements about the longer-term outlook and future role of crofting in Scotland. The results in Figure 5.8, show an increasing trend in the level of agreement over the three surveys.
Almost all crofters were in agreement that crofting is not economically viable without household members supplementing income from work outside of crofting activities (92%), which is consistent with 2018 (95%) and 2014 results (88%).
64% of crofters agreed that income from, for example, wind farm developments on the common grazing should benefit the whole community. This has continued to increase with each survey from 50% in 2014 to 60% in 2018. The majority (61%) of crofters expressed the view that it was necessary for crofting to continue to diversify from agricultural-based activities in order to secure its economic future. This view is consistent with the 2018 survey and more than was reported in 2014 (54%). Furthermore, 60% of crofters know where to find information on economic or financial help for crofting (65% in 2018 and 62% in 2014).
The level of agreement was lowest regarding opinions on the Scottish Government being committed to protecting the future of crofting (42%) and regarding crofters’ perception that crofting in its present form has a sustainable future (34%). Both have seen a decrease in the level of agreement compared to the 2014 and 2018 surveys.
Analysis by age reveals that respondents aged 65 and over were most likely to agree that the Scottish Government is committed to protecting the future of crofting, with 46% of those in agreement, compared to 35% of those aged 45-54. Furthermore, 63% of respondents aged 65 and over and 64% of respondents aged 55-64 were in agreement that diversification from agricultural-based crofting activities is the only way to secure the economic future of crofting, compared to 52% of respondents aged 45-54.
The level of agreement does not vary significantly by age with the exception of knowing where to find information on economic or financial help for crofting activities, where those aged 65 and over were most likely to agree (76%).
Crofters were given the opportunity to make any further comments regarding their croft or the future of crofting in Scotland. 20% of crofters took the opportunity to do so. The most common themes mentioned were:
1. A perceived lack of financial support available to crofters (19%);
2. A perception that crofting is dying out and that more needs to be done to encourage crofting (15%);
3. Comments regarding succession plans (10%);
4. More support needed from the Crofting Commission to support crofters (7%); and
5. More needing to be done to attract younger people to crofting (7%).
Contact
Email: socialresearch@gov.scot