Economic conditions of crofting: survey 2019 to 2022
This report provides a detailed outline of the uses and financial situation of crofts in the years between 2019 and 2022.
4. Financial issues in crofting
4.1. Summary of key points
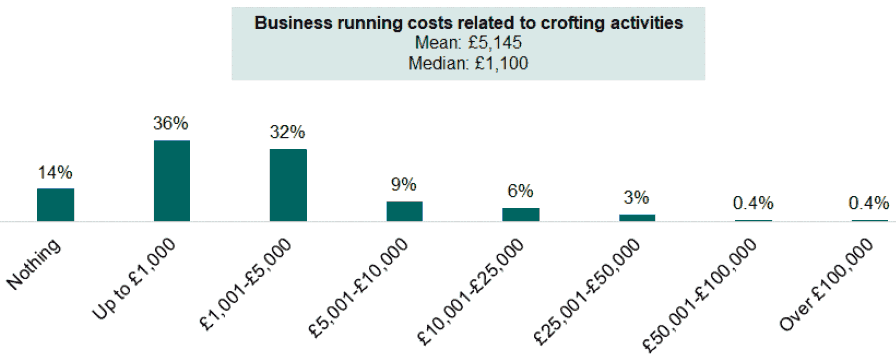
- The majority of crofters reported no running costs (14%) relating to their crofting-based activities or running costs of under £5,001 (67%). The median running cost was reported as £1,100 (up slightly from £1,000 in 2018).
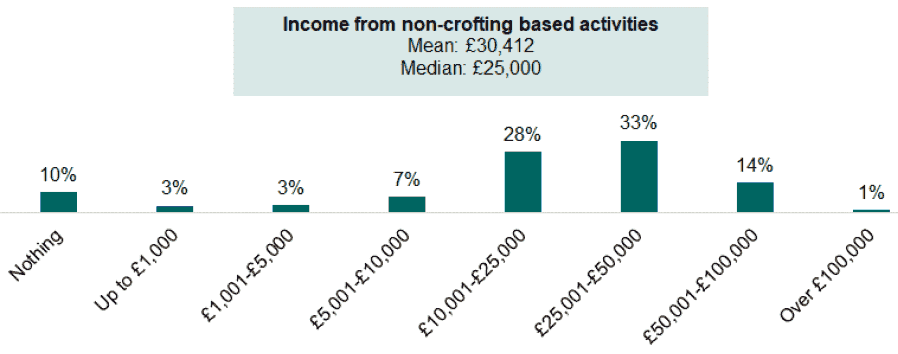
- 61% of respondents reported their non-crofting income as between £10,001 and £50,000 (64% in 2018). The median household income reported from non-crofting activities was £25,000 consistent with the 2018 survey results (£25,000).
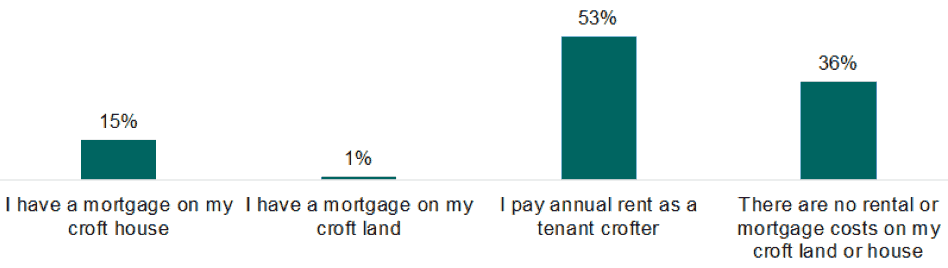
- Just under two-thirds of crofters had rental and/ or mortgage costs on their land or croft house (64%), an increase from 57% in 2018.
Base: respondents, n=707
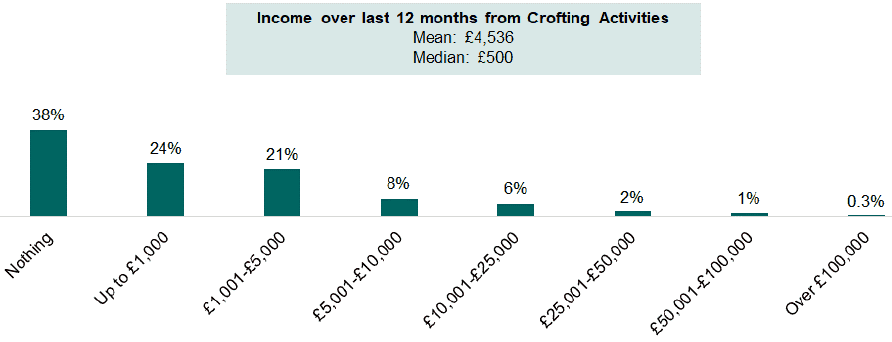
Crofters were asked to approximate their income from crofting-based activities in the last 12 months, including any income from grant money or support schemes and before deducting costs. 38% made no income (25% in 2018), 44% made up to £5,000 (42% in 2018), 14% made between £5,001 and £25,000 (24% in 2018) and 4% made over £25,000 (6% in 2018). The mean income reported was £4,538 (£13,095 in 2018), and the median is £500 (£2,000 in 2018).
| Length of time | Base | Mean (£) | Median (£) | |
|---|---|---|---|---|
| Length of time crofting | Less than 3 years | 71 | 1,976 | 0 |
| 3 to less than 10 years | 164 | 2,929 | 200 | |
| 10 to less than 20 years | 158 | 7,795 | 500 | |
| 20 years or more | 307 | 4,260 | 800 | |
| Local Authority | Argyll And Bute | 33 | 5,657 | 1,500 |
| Highland | 327 | 4,373 | 500 | |
| Na h- Eileanan Siar | 249 | 2,550 | 100 | |
| Orkney Islands | 15 | 40,773[10] | 10,000 | |
| Shetland Islands | 82 | 4,187 | 1,000 | |
| Tenure | Tenant | 463 | 3,234 | 500 |
| Owner Occupier | 243 | 7,035 | 500 |
Those who had been crofting between 10 and 20 years (mean income of £7,795) and 20 years or more (mean income of £4,260), had higher income levels than those who were newer to crofting (mean income of £1,976 for those crofting for less than three years). The median value increases with length of time crofting from £0 for those who have been registered crofters for less than three years to £800 for those who have been crofting for 20 years or more.
Mean and median values vary considerably by local authority, however the base sizes were too small for these differences to be significant. Please note that the mean for Orkney Islands is skewed by a small number of respondents who noted a very high level of income. In terms of tenure, while the median remains consistent at £500 for both groups the mean value is considerably higher for owner occupiers (£7,035) than tenants (£3,234).
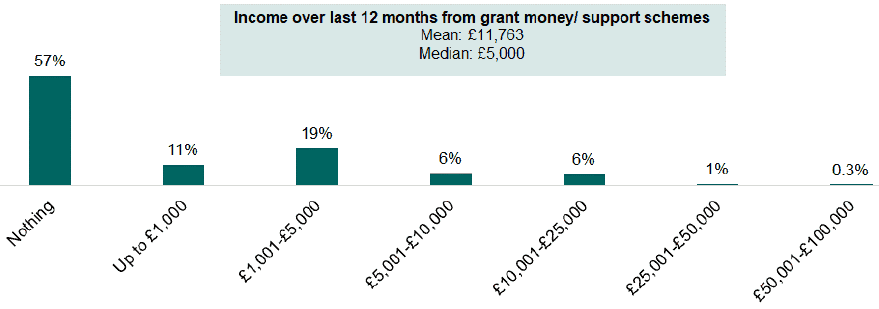
Base: respondents, n=650. NB the mean and median values have been calculated only for those who have received grant money or support (129 respondents)
The majority of crofters (57%) said they had not generated any income from grant money or support schemes, 30% had received up to £5,000 and 13% had received over £5,000.
Those who had been crofting for the least amount of time (three years or less) were most likely to have received public funding (81%).
The mean and median values have been calculated only for those who have received income from grant money or support schemes. The mean value has been calculated as £11,763 and the median is £5,000. This was a new question in the 2022 survey and therefore there is no comparison.
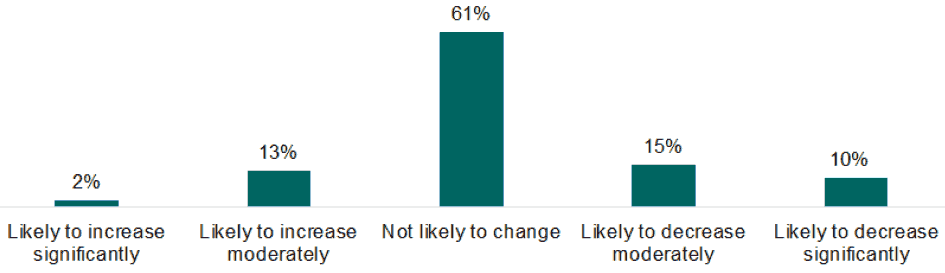
Base: respondents, n=870
The majority of respondents felt their income position was not likely to change in the next 12 months (61%). This is less than was reported in 2018 (81%) and not significantly different from the 2014 survey (63%). More respondents were of the opinion their income was likely to decrease (25%) than increase (15%). The proportion of respondents expecting an increase in income is more than the 2018 survey (6%) and similar to the 2014 survey (14%). On the other hand, those expecting a decrease in income is more than the 2018 survey (12%) and similar to the 2014 survey (22%).
Crofters were asked the reasons for their anticipated changes to their income position. The top response was in regard to rising costs such as feed, transport, electricity, materials etc. (25%). One in ten respondents said they saw no change in their income position and a further 9% said their crofting activities do not generate a profit or income. A further 9% said their income would be dependent on funding, and 9% mentioned retirement or ill health may have an impact on their income from crofting activities.
4.3. Business running costs and household income
Base: respondents, n=703
The majority of crofters reported no running costs relating to their crofting-based activities or running costs of £5000 or under (82%), which is higher than was reported in the 2018 survey (73%). The median running cost reported was £1,100 (up slightly from £1,000 in 2018) and the mean was £5,145 (£8,385 in 2018).
Base: respondents, n=682
Crofters were also asked about their total household income from all non-crofting activities in the last 12 months, including all sources of paid employment, pensions, benefits and interest on bank deposits and investments.
In 2022, 10% of respondents reported no income from non-crofting based activities (6% in 2018). 62% of respondents reported their non-crofting income as between £10,001 and £50,000 (64% in 2018), 7% said it was up to £5,000 (7% in 2018), 7% between £5,001 and £10,000 (7% in 2018) and 15% said it was over £50,000 (16% in 2018).
The median household income reported from non-crofting activities was £25,000, consistent with the 2018 survey results (£25,000) and slightly higher than the 2014 median value of £21,000. Despite the spread of income being similar, the mean value was reported as £30,412, less than the £41,760 reported in 2018. It should be noted that the proportion of respondents who had a household income from non-crofting activities of over £100,000 has decreased from 5% in 2018 to 1% in 2022, which may explain the reduction in the mean income for 2022.
The median combined revenue from both crofting and non-crofting activities, minus business running costs was £29,810, higher than the result from the 2018 survey (£29,000), and the median Scottish household income of £27,716[11].
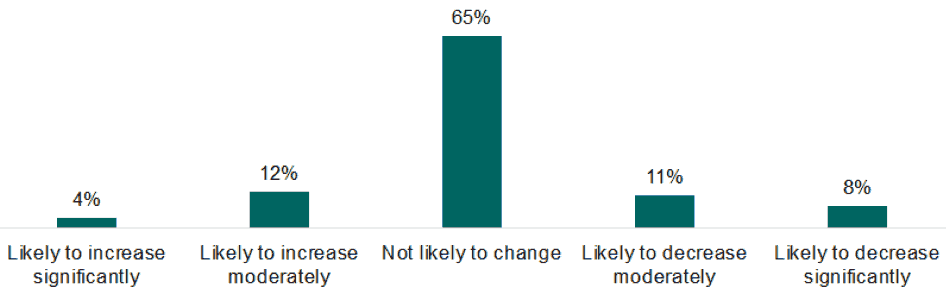
Base: respondents, n=753
The majority of respondents said their non-crofting income and business running costs were not likely to change in the next 12 months (65%), 16% said it was likely to increase and 19% said it was likely to decrease. The main reasons given for any changes were due to pension funds or retirement (23%), rising costs and inflation (22%) and career progression or promotion (8%).
4.4. Rent/ mortgage costs
Base: respondents, n=884
When asked about rent or mortgage costs for both croft land or housing, 64% of respondents (57% in 2018) reported having rental or mortgage costs. Please note that respondents could select both mortgage and rent as options. Among those who did, it was most common for respondents to pay annual rent as a tenant crofter (53%).
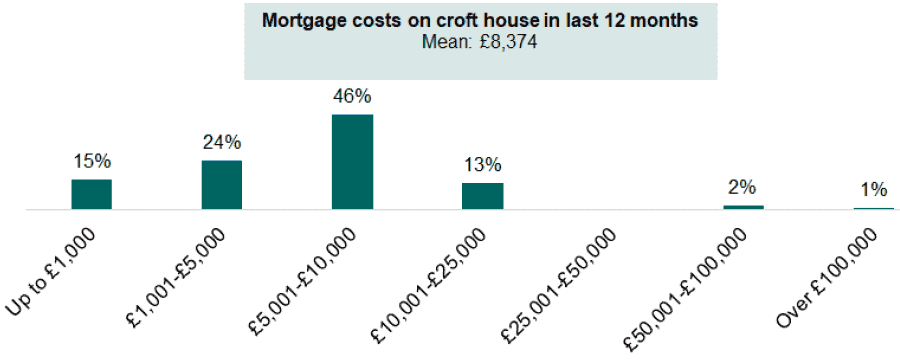
Base: respondents, n=117
Those who had rental or mortgage costs were asked what their costs for housing were in the last 12 months. As Figure 4.8 above illustrates, just under half said their mortgage costs were between £5,001 and £10,000 (46%), 38% said they were under £5,001 and 15% said they were over £10,000. The mean value was calculated at £8,374 and a median of £6,000. No comparison has been made to this question as the 2018 survey combined mortgage and rent costs in the one question whereas they have been separated in the 2022 survey.
Only five crofters said they had a mortgage on croft land.
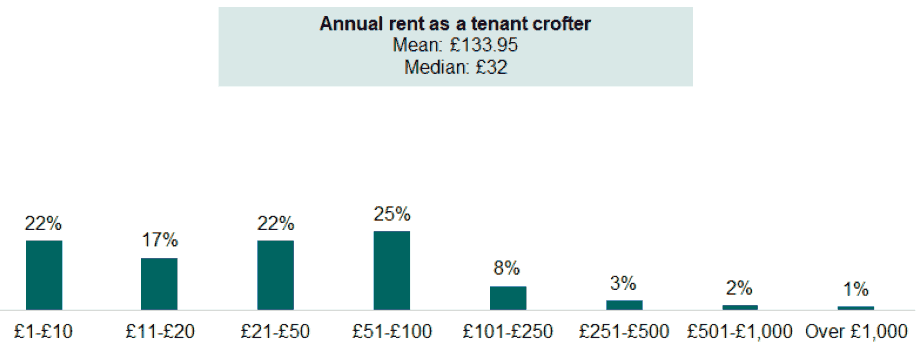
Base: respondents, n=410
61% of crofters who paid annual rent said they paid less than £51 in the last year, 25% paid between £51 and £100, and 14% paid over £100 per year. The mean annual rent was reported as £133.95 and the median value was £32.
4.5. Rent reviews
Base: pay rent, n=442
Of those who pay annual rent, 76% said their rent is reviewed, with over one-in-four respondents (27%) stating this is done annually. This question has not been compared to the 2018 survey due to changes to the wording of the question and the options provided.
Contact
Email: socialresearch@gov.scot