Economic conditions of crofting: survey 2019 to 2022
This report provides a detailed outline of the uses and financial situation of crofts in the years between 2019 and 2022.
3. About your crofting background
3.1. Summary of key points
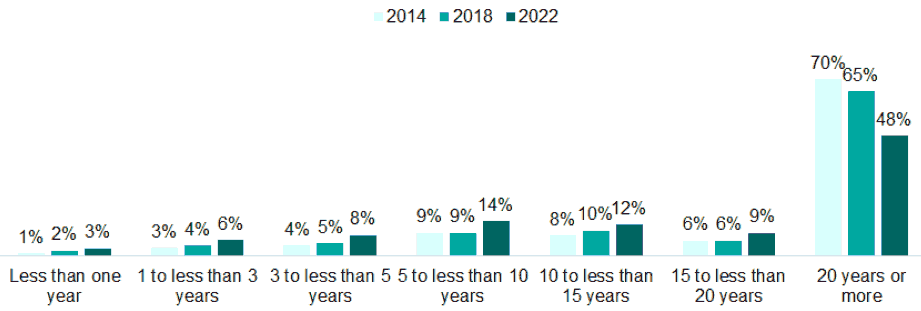
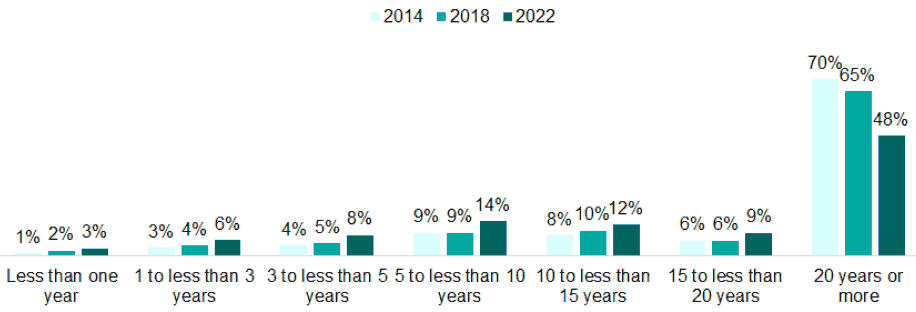
- Just under half of crofters have been a registered crofter for 20 years or more, however, this number continues to decrease from 70% in 2014 to 65% in 2018, and 48% in 2022.
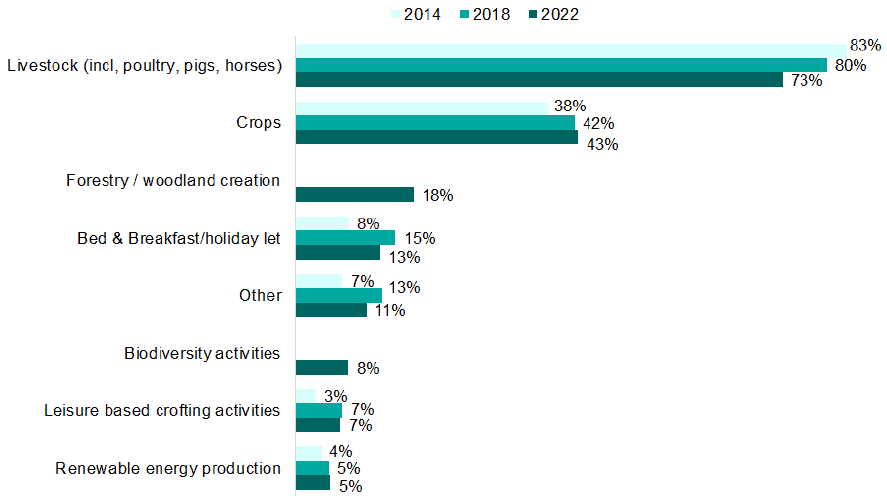
- Like the 2018 and 2014 surveys, raising livestock continues to be the most popular crofting activity (73%). This is followed by growing crops (43%) and forestry or woodland creation (18%), a new question in the 2022 survey.
- A further 13% of crofters said they ran bed and breakfast facilities or holiday lets. This appeared to be most common in Argyll and Bute (21%) and amongst females (16%).
| Base, n=929 | % |
|---|---|
| I was brought up in a crofting family/ a family croft became available | 71.9% |
| To live amongst a small community | 26.4% |
| To live with spouse/ partner | 17.1% |
| To provide a source of income | 14.6% |
| To live with family and/ or friends | 13.1% |
Crofters were most likely to have become a crofter due to being brought up in a crofting family or where a family croft had become available (72%), and this was also the most common reason given by respondents in the 2018 survey (65%). The next most common reasons were where a family croft had become available (33%) or where respondents wanted to live amongst a small community (26%), similar to the 2018 survey.
3.3. Length of time being a registered crofter
Base: respondents, 2018, n=706; 2022, n=926
Although crofters were most likely to have been crofting for 20 years or more, the proportion of respondents who have been crofting for 20 years or more has continued to decrease from 70% in 2014 to 65% in 2018 and 48% in 2022. On the other hand, the proportion of respondents who have been crofting for less than five years has increased from 8% in 2014 to 11% in 2018 and 17% in 2022. Those who have been a crofter for 20 years or more were significantly more likely to be older crofters, with 70% of this group being aged 65 and over.
3.4. Number of crofts operated per tenure
| Base | Min | Max | Mean | Median | |
|---|---|---|---|---|---|
| Number of crofts operated as tenant crofter | 567 | 1 | 10 | 1.41 | 1 |
| Number of crofts operated as owner-occupier | 365 | 1 | 10 | 1.36 | 1 |
| Number of crofts operated as landlord | 32 | 1 | 4 | 1.31 | 1 |
| Number of crofts operated as sublet/ short term lease | 102 | 1 | 6 | 1.85 | 1 |
Respondents were asked about the number of crofts they currently operate as a tenant, owner-occupier crofter, landlord or as a sublet. Where respondents operated crofts as a tenant crofter this ranged between 1 and 10 crofts with a mean of 1.41 crofts. Where crofts were owner-occupied, this ranged between 1 and 10 crofts, with a mean of 1.36. Those crofters that also identified as being a landlord of a croft, were the landlord of between 1 and 4 crofts, with a mean score of 1.31 and for those who operated crofts as a sublet or short lease this ranged from between 1 and 6 crofts with a mean of 1.85 crofts.
Base: respondents, n=71
Of those who sublet a croft or had a short-term lease, 40% said their lease was for one year or less, 17% said it was between 2-5 years, 21% said it was between 6 and 10 years, and 1% said it was for more than 10 years. A further 7% of respondents said they had a seasonal let or a let for summer grazing and 3% said they had an unofficial sublet.
3.5. Crofting activity
Please note that other activities noted but not shown were camping/ glamping (3%), Aquaculture (2%), Wood processing (3%), Peatland restoration (1%)
Base: respondents, 2018, n=562; 2022, n=848
Raising livestock was by far the most common crofting activity undertaken by respondents in 2022 (73%), this was also the case in 2018 (80%) and in 2014 (83%), however it has begun to slowly decrease. A further 43% grew crops on their croft (42% in 2018 and 38% in 2014). Several new activities were added to the 2022 questionnaire. These included peatland restoration (1%), biodiversity activities (8%), forestry and woodland creation (18%) and leisure-based crofting activities such as camping and glamping (3%).
The results to this question generally do not vary significantly when analysed by the length of time being a registered crofter. Raising livestock, growing crops and forestry and woodland creation remained the top three most common activities for respondents regardless of how long they had been a registered crofter.
| Argyll And Bute | Highland | Na h- Eileanan Siar | Orkney Islands | Shetland Islands | |
|---|---|---|---|---|---|
| Base: no of respondents | 38 | 384 | 313 | 18 | 94 |
| Livestock (incl, poultry, pigs, horses) | 82.0% | 70.0% | 72.0% | 72.0% | 86.0% |
| Crops | 45.0% | 42.0% | 45.0% | 33.0% | 35.0% |
| Bed & Breakfast/ holiday let | 21.0% | 17.0% | 10.0% | 11.0% | 2.0% |
| Camping/ glamping | 8.0% | 3.0% | 2.0% | - | 2.0% |
| Aquaculture | - | 3.0% | 1.0% | - | 2.0% |
| Wood processing | 11.0% | 5.0% | 1.0% | - | - |
| Renewable energy production | 3.0% | 6.0% | 4.0% | 22.0% | 3.0% |
| Peatland restoration | - | 1.0% | 2.0% | - | 2.0% |
| Biodiversity activities | 11.0% | 11.0% | 5.0% | 6.0% | 6.0% |
| Forestry/ woodland creation | 13.0% | 23.0% | 14.0% | - | 12.0% |
| Leisure based crofting activities | 5.0% | 5.0% | 9.0% | - | 7.0% |
| Other | 13.0% | 7.0% | 4.0% | 17.0% | 4.0% |
| Croft is sublet for grazing/ cropping etc | - | 2.0% | 3.0% | - | - |
| Horticulture | - | 1.0% | 1.0% | 6.0% | - |
| Land maintenance/ maintenance and repairs of equipment | 3.0% | 2.0% | 1.0% | - | 1.0% |
As shown in Table 3.3, the most notable differences in crofting activity by local authority were for bed and breakfast or holiday lets, where 21% of crofters in Argyll and Bute, 17% in highland, 11% in Orkney and 10% in Na h-Eileanan Siar did this compared to just 2% of crofters in the Shetland Islands, and also for renewable energy activities which were more common in the Orkney Islands (22%) than in all other local authority areas (between 3% and 6% for all other areas).
Analysis by gender showed that females were more likely to run bed and breakfast or holiday let facilities (16%) than males (11%). On the other hand, males were more likely to raise livestock (77%) than females (65%). Renewable energy production, while small proportions, was more likely amongst males (6%) than females (3%).
Analysis by age showed that crofters aged 55-64 (17%) were most likely to be involved in bed and breakfast of holiday let facilities compared to 14% aged 65 and over, 10% aged 45-54 and 5% aged 16-44. Raising livestock was more common amongst crofters aged 16-44 (83%) and aged 45-54 (85%) than those aged 65 and over (65%). Forestry or woodland creation was more likely to be undertaken by crofters aged 55-64 (21%) than aged 45-54 (12%). Leisure based crofting activities were least common amongst crofters aged 45-54 (3%).
| Base | Minimum | Maximum | Mean | Median | |
|---|---|---|---|---|---|
| Livestock (incl, poultry, pigs, horses) | 600 | 0 | 100 | 74.56 | 90 |
| Bed & Breakfast/ holiday let | 104 | 0 | 100 | 52.81 | 50 |
| Leisure based crofting activities | 54 | 0 | 100 | 40.76 | 31.5 |
| Crops | 351 | 0 | 100 | 40.66 | 30 |
| Camping/ glamping | 24 | 0 | 100 | 39.79 | 25 |
| Forestry/ woodland creation | 141 | 0 | 100 | 34.83 | 20 |
| Aquaculture | 14 | 0 | 100 | 31.79 | 15 |
| Biodiversity activities | 64 | 0 | 100 | 25.78 | 20 |
| Peatland restoration | 12 | 0 | 100 | 22.17 | 12.5 |
| Wood processing | 26 | 0 | 70 | 22.15 | 10 |
| Renewable energy production | 41 | 0 | 80 | 12.10 | 5 |
| Other (If other, please specify - includes Horticulture/ maintenance and subletting croft) | 58 | 4 | 100 | 58.59 | 60 |
Crofters were asked what proportion of their time each activity took. Activities which appear to take up the largest proportion of time were raising livestock (with a mean percentage of 75% and a median value of 90%), followed by bed and breakfast and holiday lets (with a mean percentage of 53% and a median value of 50%) as shown in Table 3.4.
3.6. Livestock types
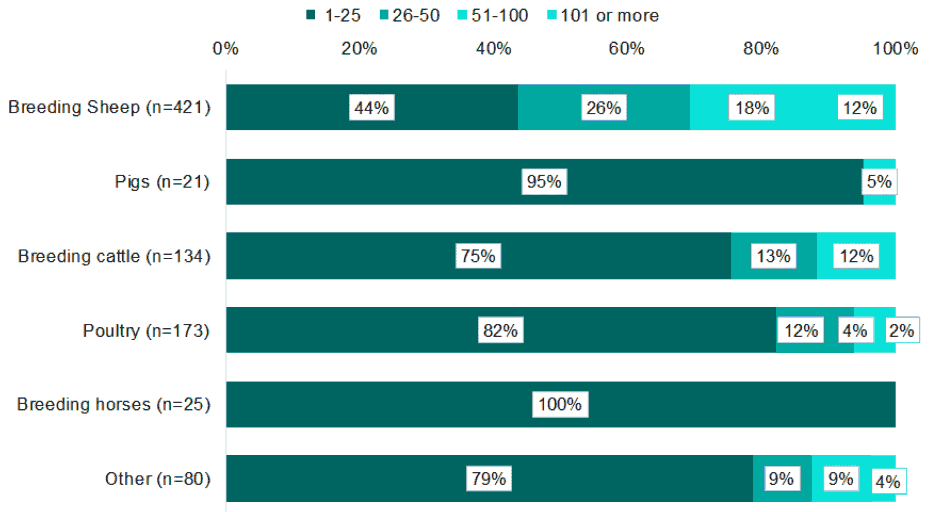
Please note n= refers to the number of respondents who had animals in each category and reflects the number upon which the % is calculated
| Base | Minimum | Maximum | Mean | Median | |
|---|---|---|---|---|---|
| Breeding Sheep | 421 | 1 | 520 | 55.52 | 30 |
| Pigs | 21 | 1 | 60 | 6.71 | 3 |
| Breeding Cattle | 134 | 1 | 100 | 19.37 | 8 |
| Poultry | 173 | 1 | 600 | 22.54 | 12 |
| Breeding Horses | 25 | 1 | 20 | 4.4 | 2 |
| Other (largely nonbreeding sheep) | 80 | 1 | 407 | 24.73 | 8 |
Where crofters said they raised livestock on their croft they were asked to detail how many of each type of livestock they had. As can be seen in Figure 3.4, most respondents who had pigs, breeding cattle, poultry and breeding horses had between 1 and 25 animals. Those who had breeding sheep were the most likely to have over 100 animals (12%). Table 3.5 shows that the mean number of animals ranged from 4.4 for breeding horses to 55.52 for those who had breeding sheep.
| Base | Minimum | Maximum | Mean | Median | |
|---|---|---|---|---|---|
| Actively worked on your croft | 620 | 1 | 5 | 1.68 | 2 |
| Worked in paid employment outside of crofting | 486 | 1 | 7 | 1.79 | 2 |
| Received income from non-crofting self-employment | 254 | 1 | 5 | 1.47 | 1 |
| Attended full-time education | 106 | 1 | 5 | 1.58 | 1 |
| Attended part-time education | 39 | 1 | 2 | 1.05 | 1 |
| Have served on the Grazing Committee | 171 | 1 | 3 | 1.12 | 1 |
Respondents were asked to specify the number of adults who were involved in various crofting activities. The most common responses were actively working on the croft and working in paid employment outside crofting. As can be seen in Table 3.6, the number of adults who actively worked on the croft ranged between one and five adults with the mean number of adults being 1.68. Regarding the number of adults who worked in paid employment outside of crofting, this ranged from one to seven adults with the mean number being 1.79.
Base: respondents, 2022, n=823
Figure 3.5 shows the breakdown of the working status of households in the survey. 68% of households had at least one resident that worked in employment outside of crofting (62% in 2018 and 59% in 2014). 11% said that no-one within their household was working in crofting activities, or elsewhere. 22% of crofters worked on crofting exclusively, consistent with the 2018 survey (23%) and a small reduction from the 28% that said the same in 2014.
3.7. Hours spent on crofting and paid non-crofting work
| Base | Minimum | Maximum | Mean | Median | |
|---|---|---|---|---|---|
| Crofting - All adults | 1049 | 1 | 100 | 14.36 | 10 |
| Paid non-crofting work - All adults | 878 | 1 | 120 | 32.43 | 36 |
Crofting households where at least one person actively worked on a croft, spent a mean of 14 hours per week engaged in crofting activities, a decrease compared with 2018 where households spent a mean of 22 hours per week on crofting. The mean number of hours for 2022 is consistent with the result from the 2014 survey (12 hours).
Where there was at least one household member who worked on non-crofting paid activities a mean of 32 hours was spent on these, a decrease from 40 hours in 2018 and 49 hours in 2014.
Contact
Email: socialresearch@gov.scot