Economic conditions of crofting: survey 2019 to 2022
This report provides a detailed outline of the uses and financial situation of crofts in the years between 2019 and 2022.
2. About crofting households
2.1. Summary of key points
Crofters are most likely to live in two person households (48%). This is more than the Scottish population where 32% live in two adult households[3].
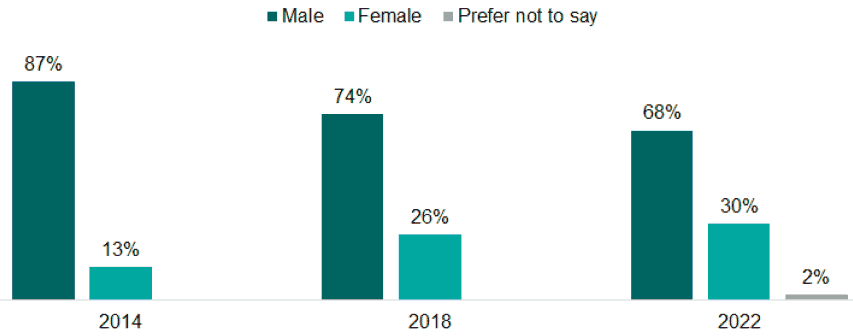
Base: respondents, 2014, n=751; 2018, n=719; 2022, n=920
In line with the results from the 2014 and 2018 surveys, crofters were more likely to be male (68% in 2022) compared to the Scottish population[4] (49%). The 2021 Scottish Agricultural Census[5] shows that most agricultural working occupiers are male (60%) and 40% are female. The proportion of female crofters has continued to increase from 13% in 2014 to 26% in 2018 and 30% in 2022.
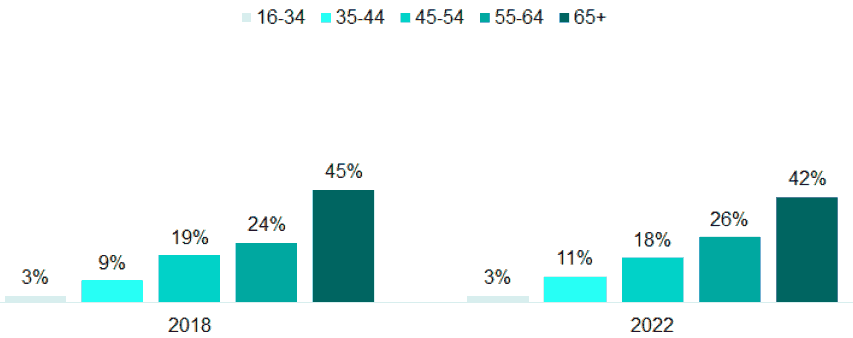
Base: respondents, 2018, n=719; 2022, n=919
In terms of the age profile of respondents, 42% are aged 65 and over, while only 3% are aged under 35. The age profile of crofters does not vary significantly compared to the profiles from the 2014 and 2018 surveys.
The 2021 Scottish Agricultural Census shows that most working occupiers are older than 55 years of age, as we can see with the crofting population. However, the proportion of crofters aged 65 and over is slightly higher than that of agricultural working occupiers. From the 2021 Scottish Agricultural Census[6] 40% of male working occupiers were aged over 64 and compared to 32% of females.
The crofting population is also more likely to be older than the Scottish population in general where 24% are aged 65 and over[7].
2.3. Household description
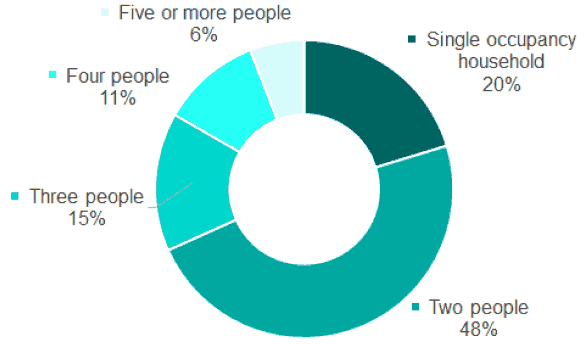
Base: respondents, 2022, n=918
It was most common for crofters to live in a two-person household (48%) which is consistent with the 2018 survey (47%). 20% lived alone, 15% lived in a three-person household, 11% lived in a four-person household and 6% lived in a household with five or more people.
2.4. Equalities information
18% of respondents said they had a physical or mental health condition or illness that was expected to last 12 months or more, and of these individuals 36% said that the condition limits their day-to-day activities a lot and a further 55% said it limits them a little. The proportion of respondents with a long term mental or physical health problem was slightly lower for crofters than the Scottish population (24%)[8].
In terms of religion, most crofters said they belonged to the Church of Scotland (42%). A further 16% said they were ‘other Christian’ and 5% said they were Roman Catholic. 26% of respondents said they did not belong to any religion, which is significantly less than the Scottish population (56%)[9].
With regard to sexuality, 90% of crofters identified as being heterosexual, 8% preferred not to answer and just over 1% identified as being gay or lesbian, bisexual or some other sexuality.
The vast majority of crofters said they were of white ethnic origin (90%) and of these individuals, 84% said they were White Scottish and a further 14% said they were white other British.
Contact
Email: socialresearch@gov.scot