Seabird species off the east coast of Scotland - impact of climate change: study
This study investigated the potential impacts of climate change on seabird distribution, abundance and demography off the east coast of Scotland, and examined integration of these climate models into standard population forecast models used in assessments for offshore wind developments.
Results
Spatial distribution modelling
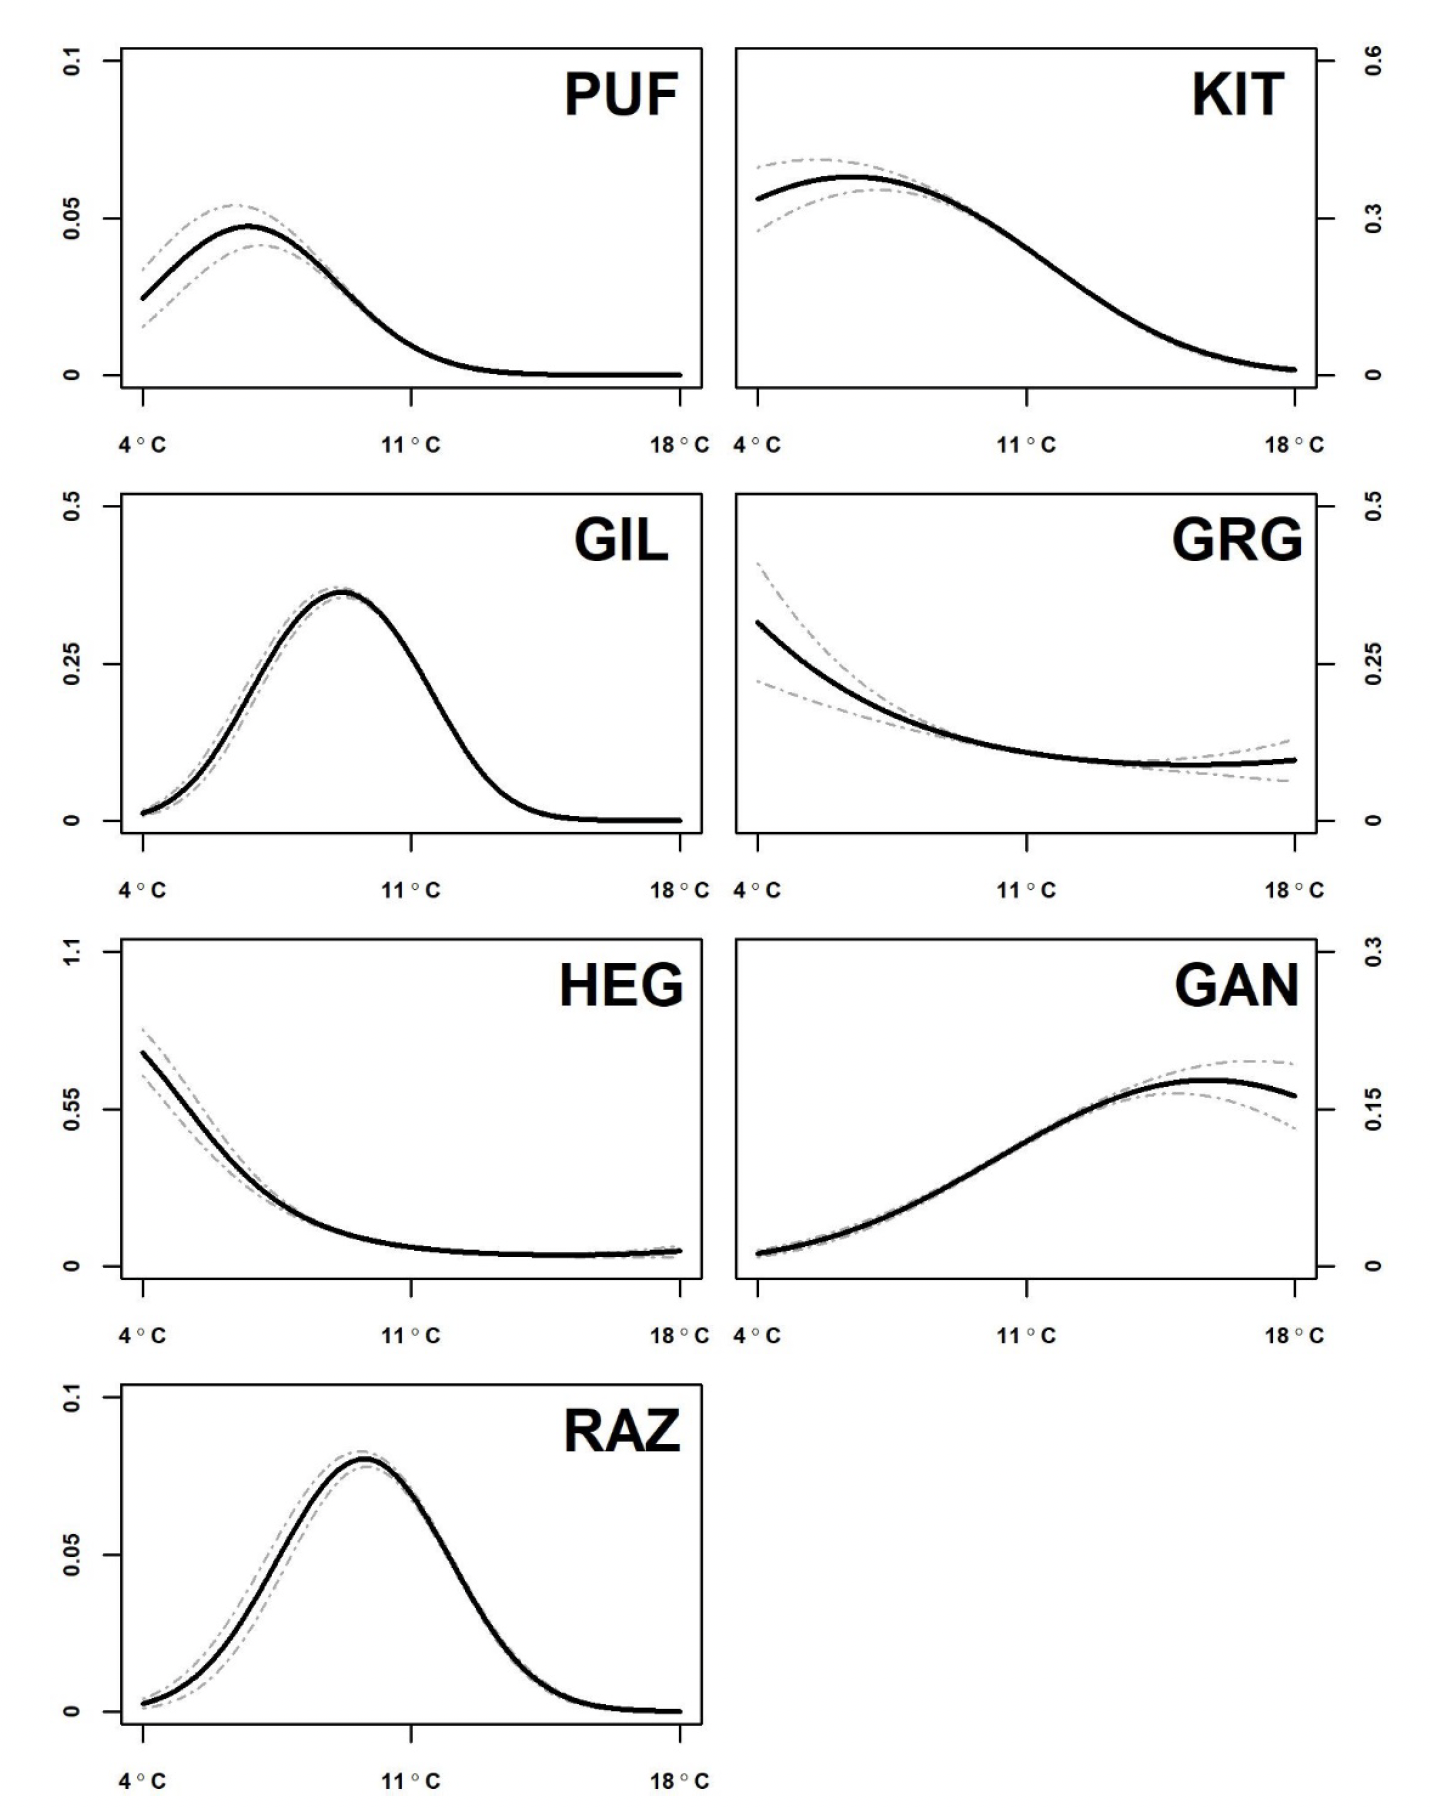
For each of the seven seabird species examined, GEE-GLM predictions of their thermal niches were derived using data on sea surface temperatures across the North-East Atlantic (Figure 2). Several species showed greatest abundance in waters at mean annual temperatures of between 4°C and 10oC. Atlantic puffin and black-legged kittiwake favoured coldest waters and therefore were most likely to respond negatively to climate warming in the region. Great black-backed gull and herring gull also showed a general association with cooler temperatures. There was a general trend towards warmer thermal associations from common guillemot to razorbill, and then to northern gannet, suggesting that these species would be less likely to be negatively affected by climate warming. Trends are assessed qualitatively in terms of large, moderate or small changes in abundance, noting also whether changes are widespread or local.
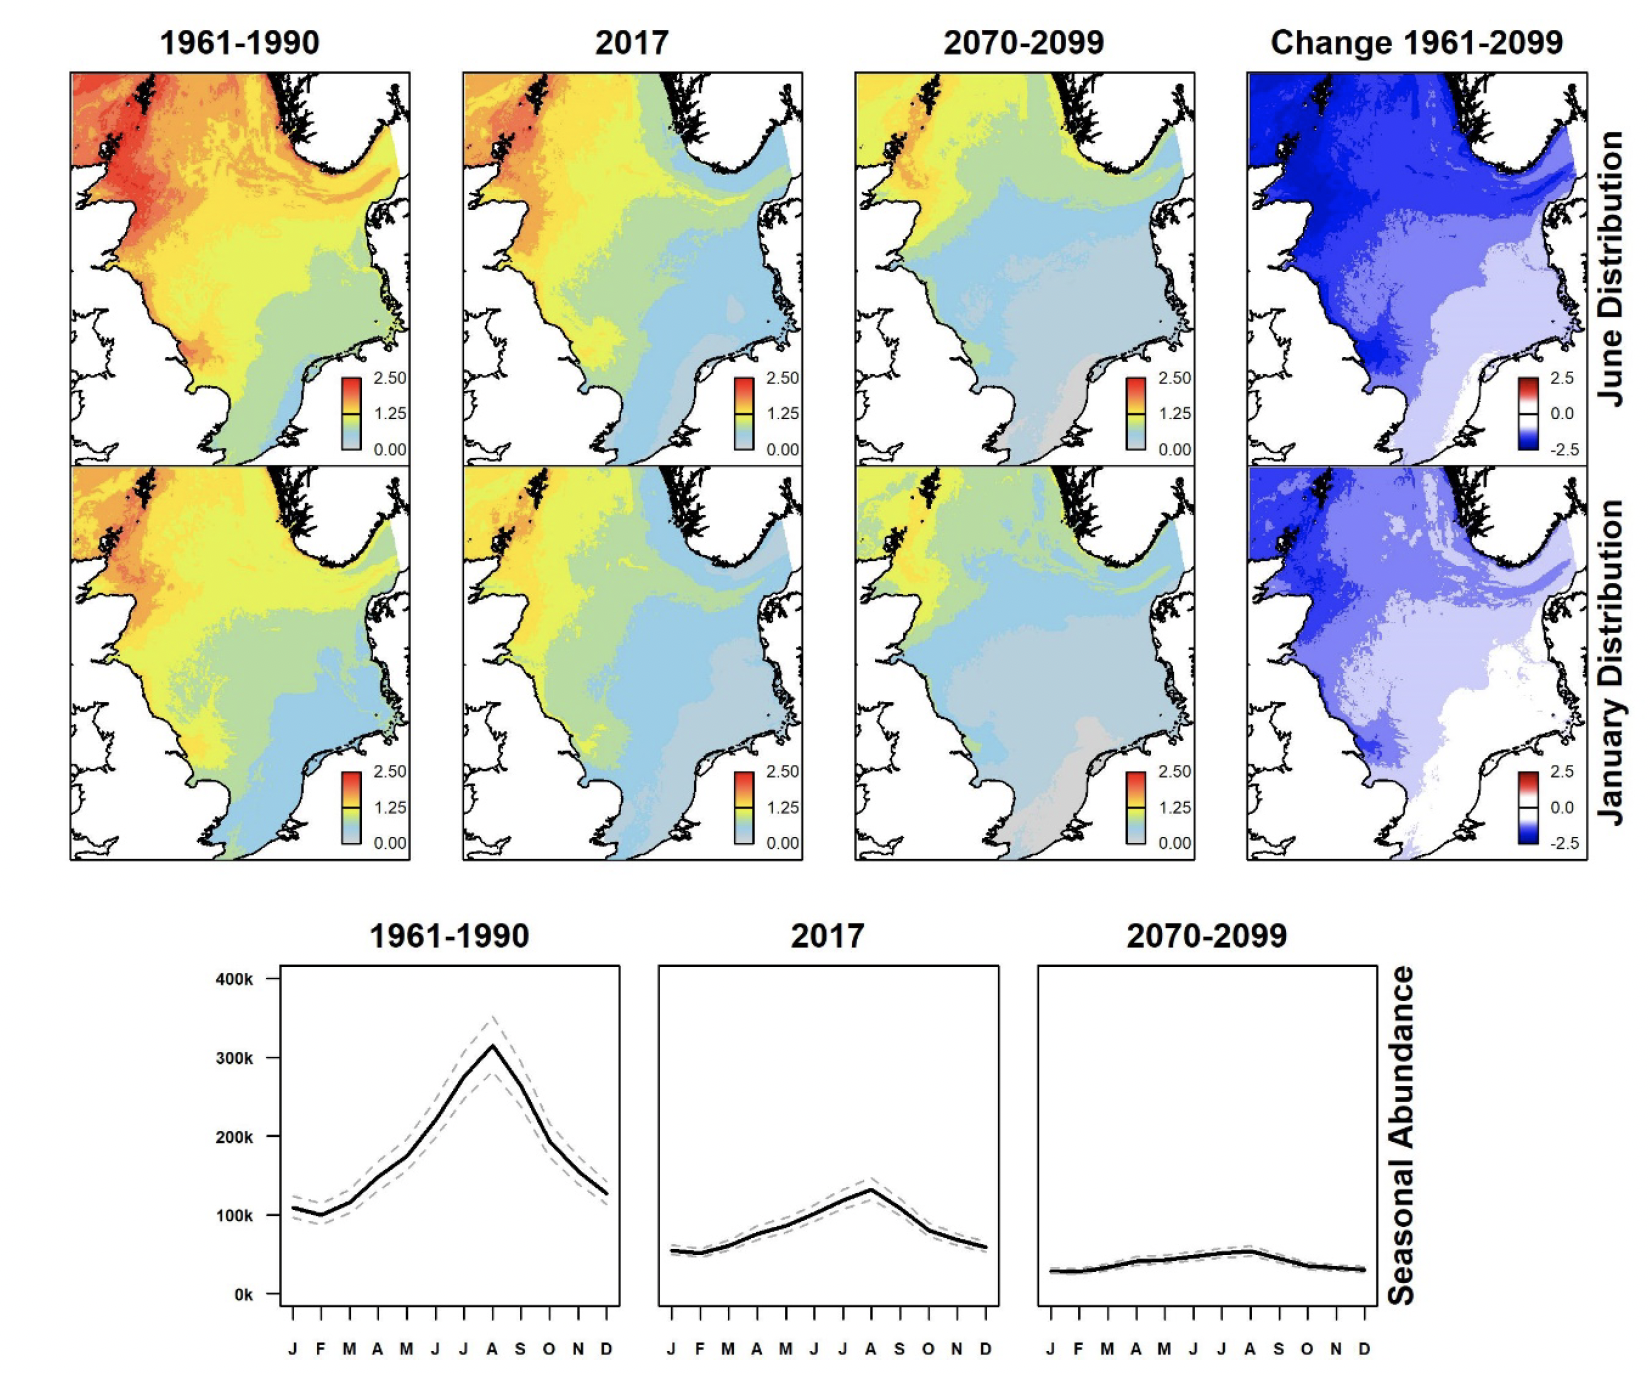
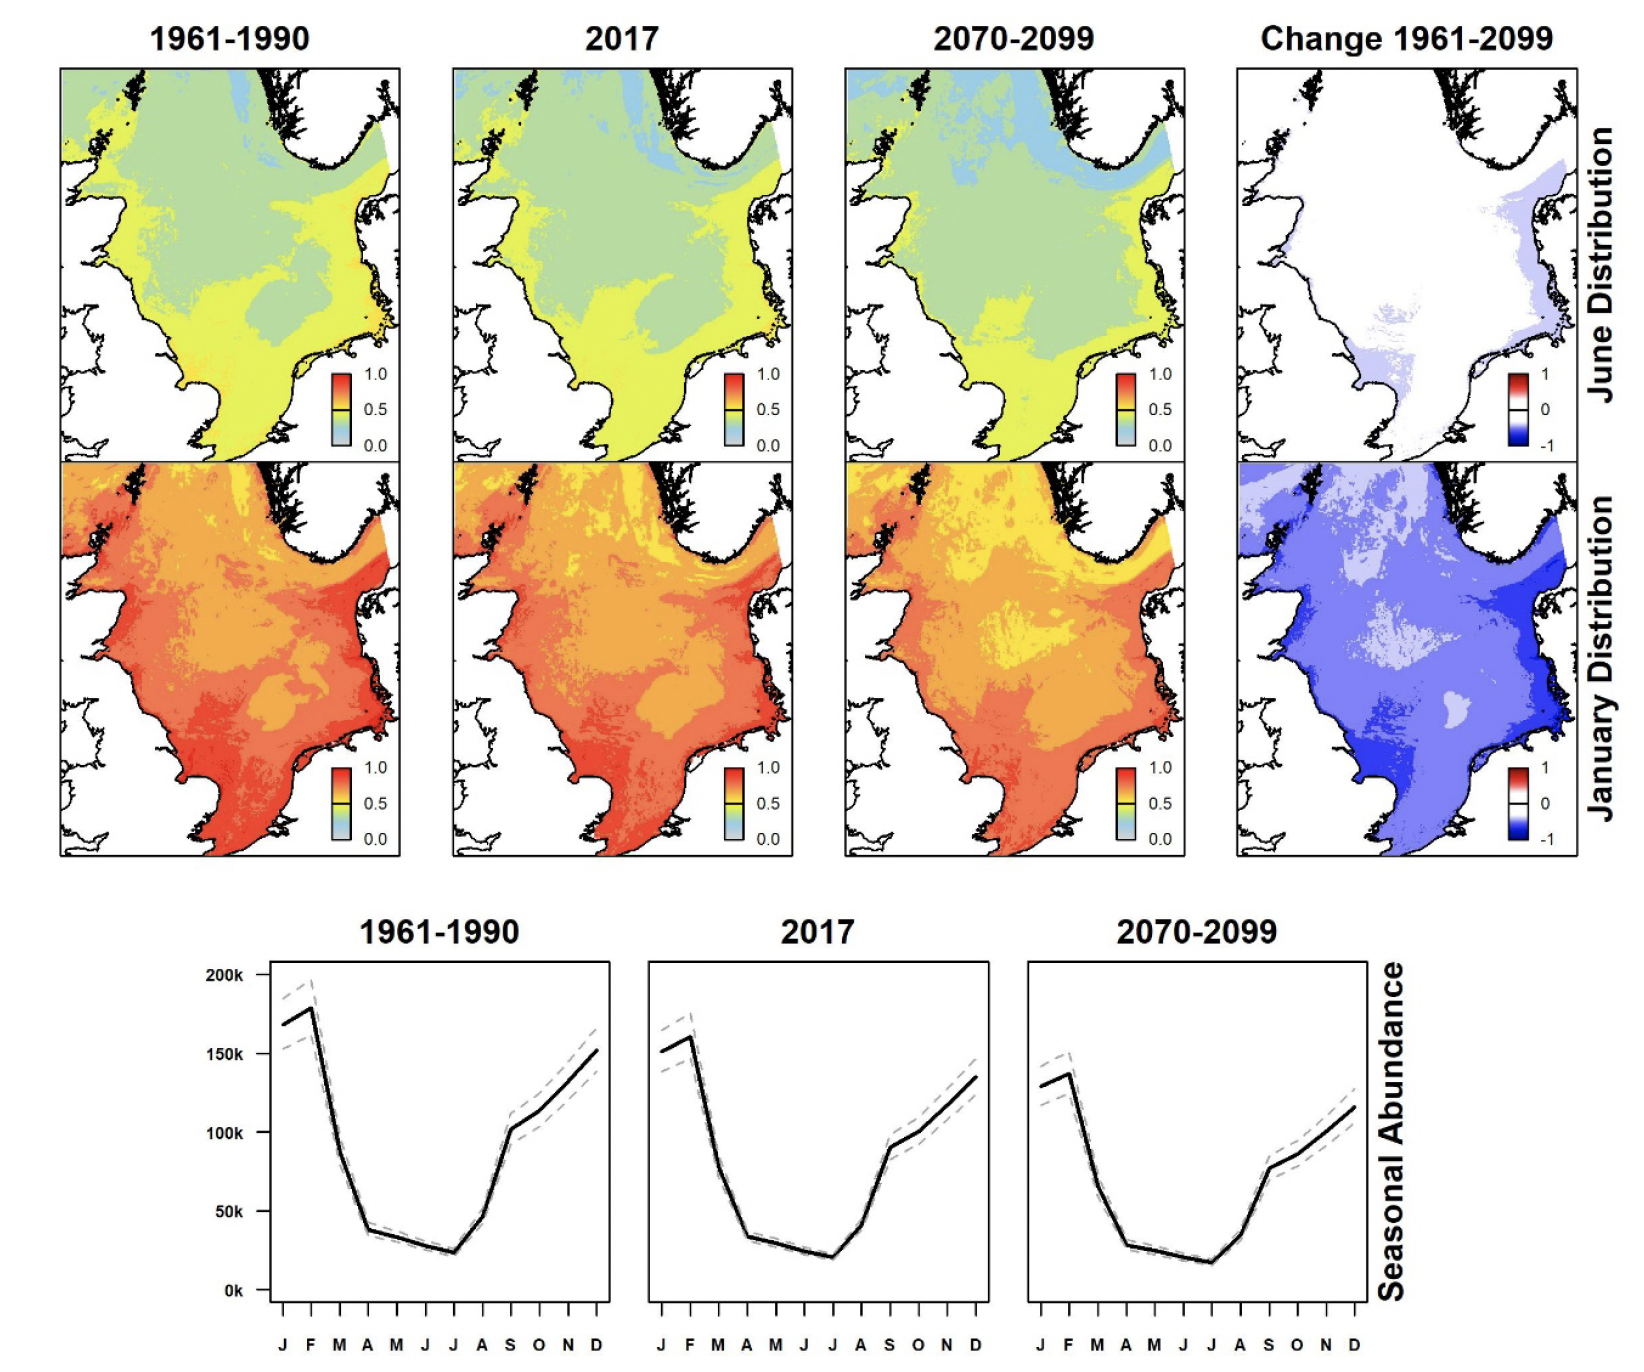
Summer (June) and winter (January) North Sea distributions for past (1961-1990), present (using 2017 data), and future (2070-2099) scenarios were derived showing spatial variation in estimated densities (animals per km2) and differences between past and future scenarios for each species from GEE-GLM predictions. These are shown in Figures 3-9, along with graphs indicating monthly variation in estimated abundances for all scenarios. Whilst the location and sizes of breeding colonies were included in GEE-GLM, they were omitted from predictions as both can change considerably across time. The omission of breeding colonies prevented bias towards present locations of large colonies in predictions.
Atlantic puffin occurs at greatest densities in summer in coastal waters of north-east Scotland and the Northern Isles (Figure 3). Those areas currently show reduced densities, and the prediction for the latter part of this century is for densities to decline further leading to a large decline in abundance. Winter distributions are at lower densities and more dispersed since many puffins winter outside the region, the remainder being concentrated in the north-western sector of the North Sea (Harris et al., 2010); they show a similar long-term trend.
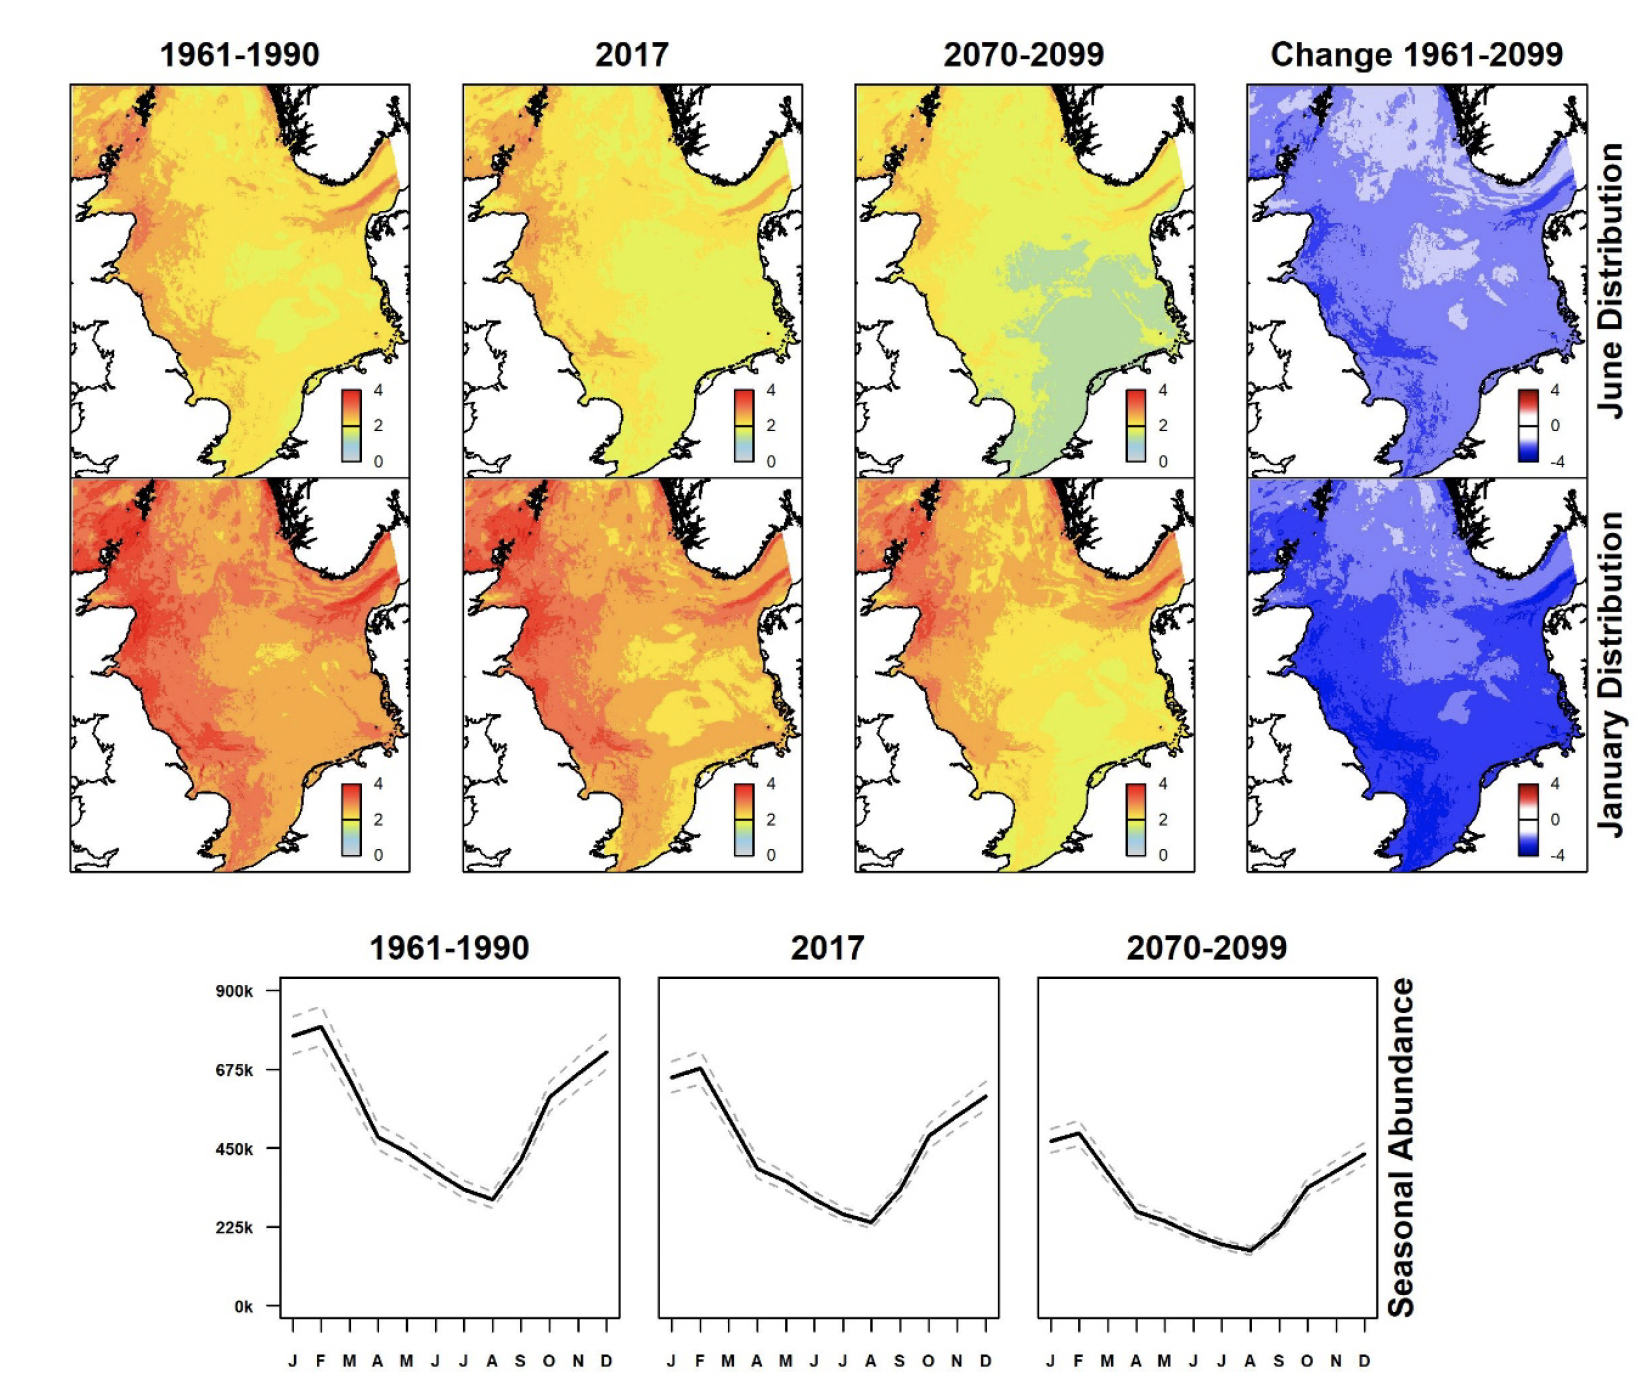
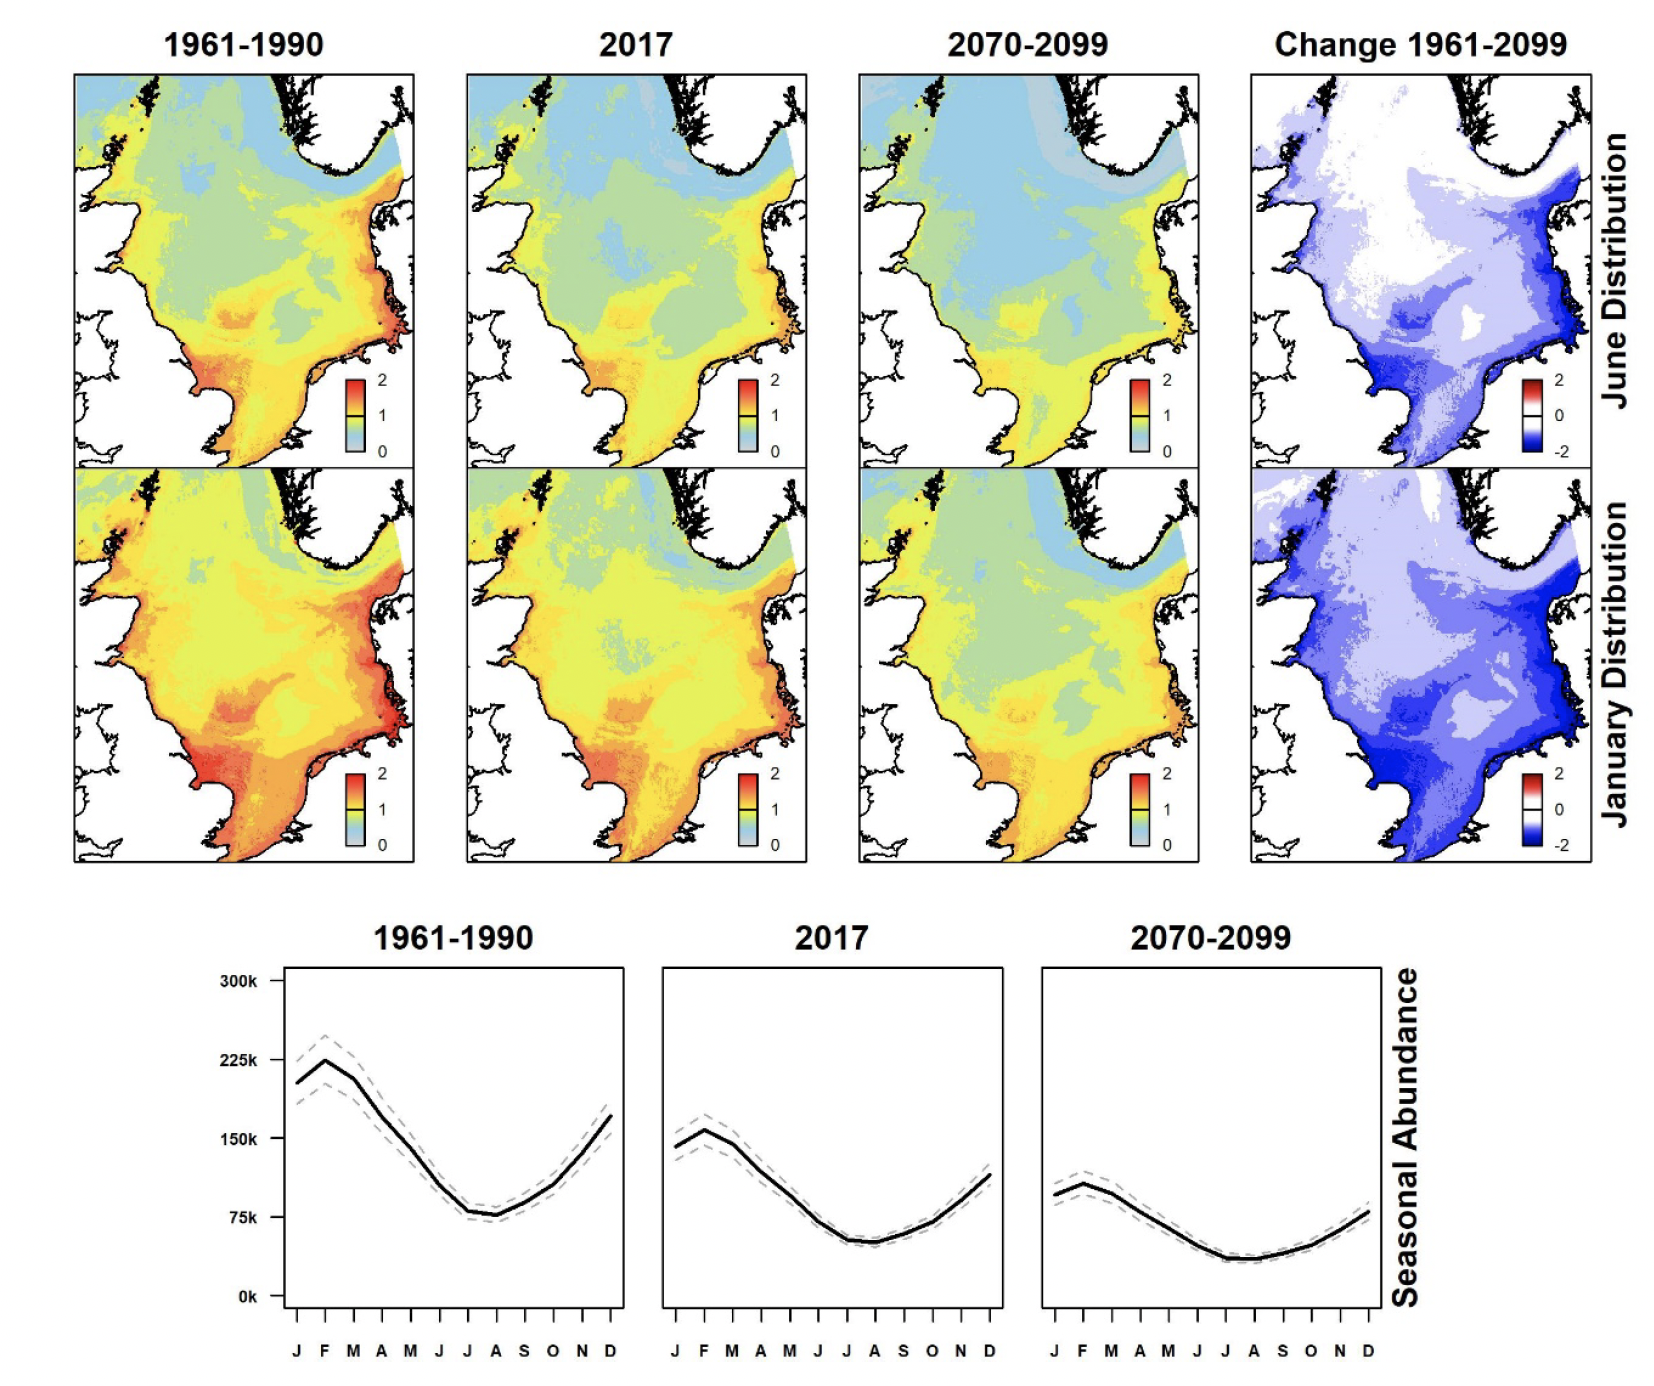
Black-legged kittiwake densities are more evenly distributed in summer and although they are slightly higher in coastal waters of north-east Britain, they are widely distributed across the North Sea (Figure 4). There has been a moderate decline in abundance compared with the period 1961-1990, and that change is predicted to continue under the future climate scenario. The species occurs at higher densities during winter months, potentially due to the presence of migrant birds from breeding areas outside the North Sea. Densities are greatest all along the eastern seaboard of Britain, but have also shown moderate decline compared with 1961-1990 and are predicted to do so further under the future climate scenario, particularly in the southern North Sea.
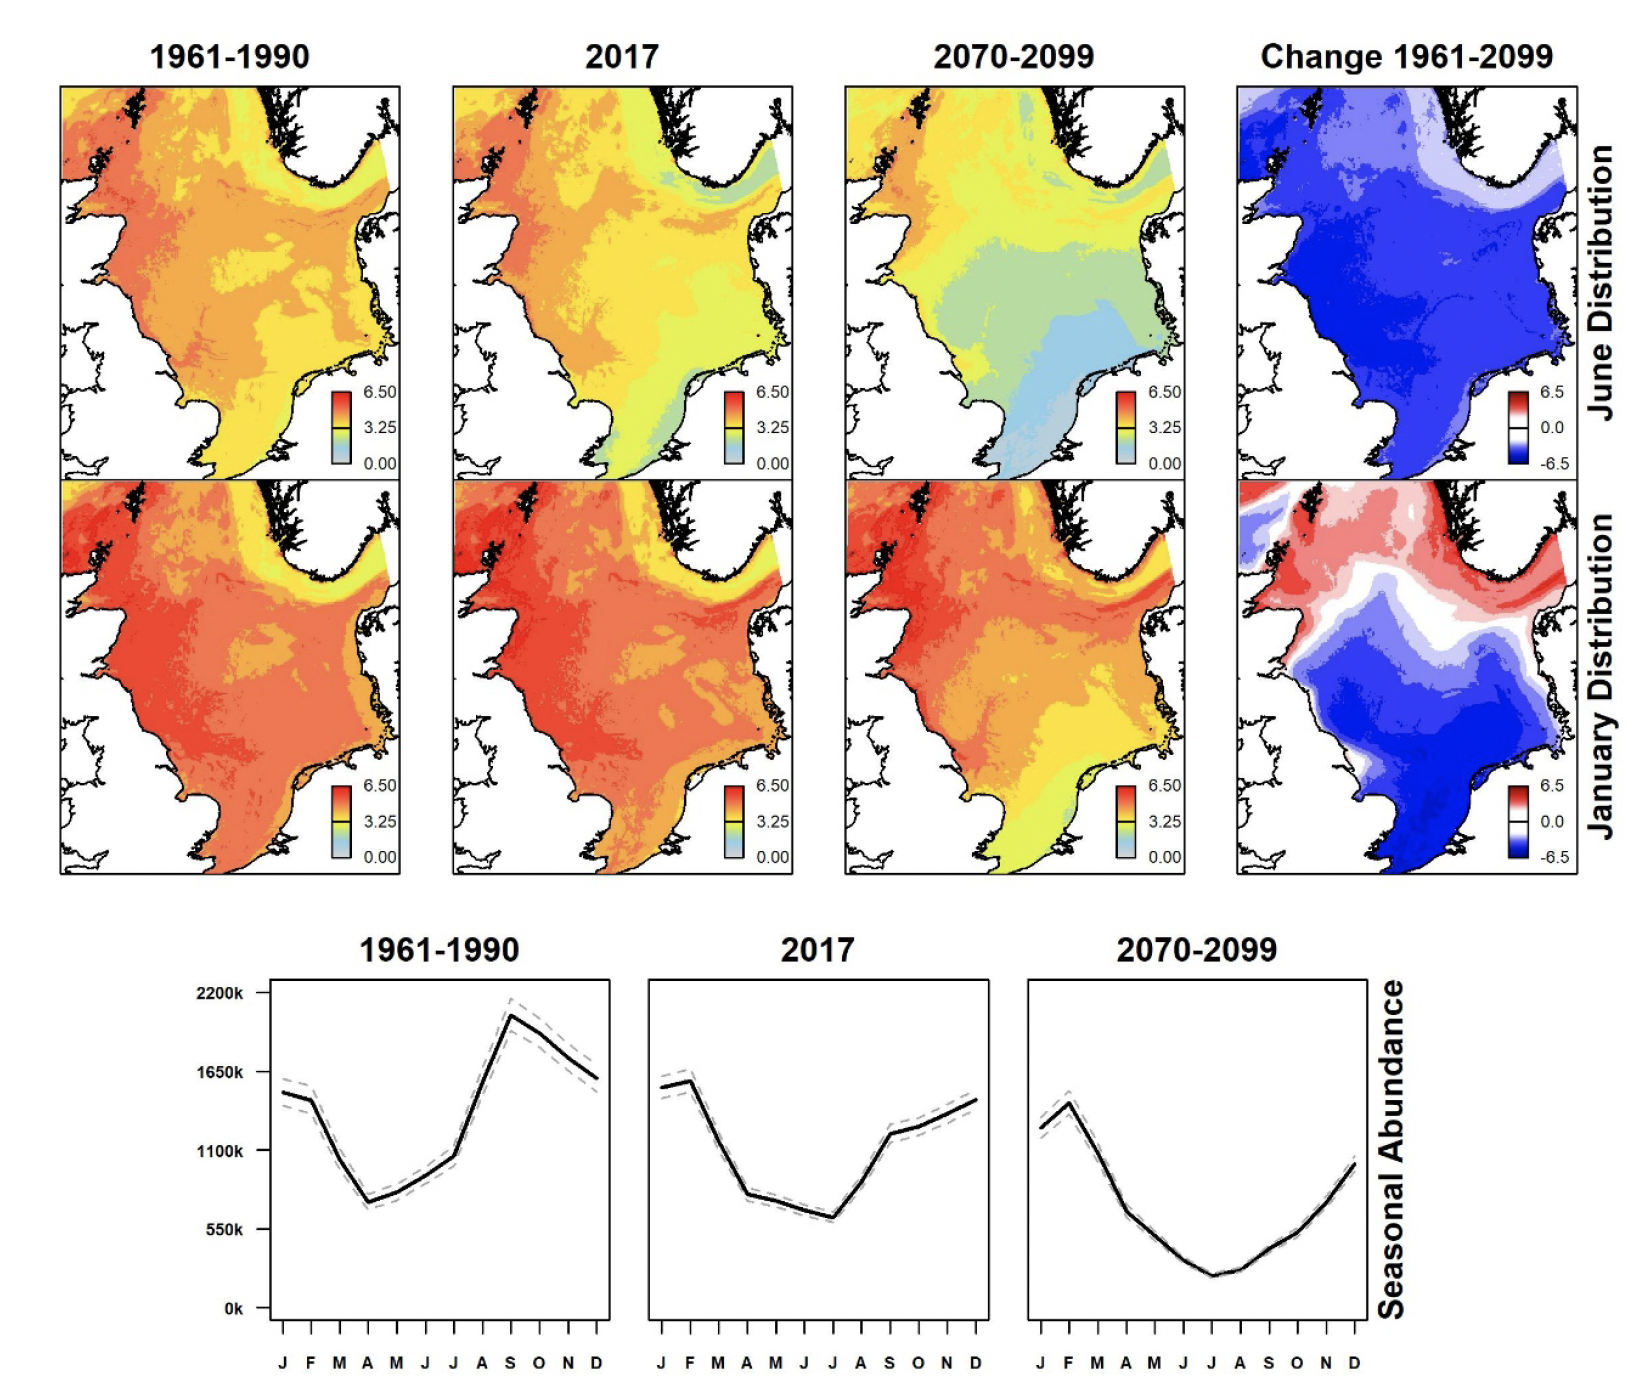
Common guillemot occurs at greatest densities in summer in coastal waters of north-east Britain (Figure 5). Densities have declined since 1961-1990, and are predicted to continue to do so under the future climate scenario, particularly along the eastern seaboard of Britain. The species occurs at higher densities in winter and is more widespread, reflecting seasonal immigration of birds from outside the North Sea (Harris & Swann, 2002). There has been little change since 1961-1990. Predictions under the future climate scenario suggest a decline in occupation of the southern and central North Sea with greater concentrations in a band across the northern North Sea from southern Scandinavia to eastern Scotland.
During summer, great black-backed gull occurs at highest densities in the southern North Sea, with a relatively coastal distribution (Figure 6). There has been little change in distribution patterns since 1961-1990 and the prediction is for little further change under the future climate scenario. However, overall abundance has declined and is predicted to continue to do so. Densities are higher in winter, presumably reflecting birds spending more time offshore. Although more widespread in winter, densities remain greatest in the southern North Sea. Moderate and widespread declines in abundance are predicted, particularly in coastal waters of East Anglia and in the south-eastern North Sea under the future climate scenario.
The predicted distribution of great-black backed gulls in summer contrasts with the distribution of breeding colonies in the North Sea region, which is centred on Orkney and Shetland (Mitchell et al 2004). This discrepancy is primarily linked to the omission of the breeding colony index (see Methods) and an environmental association with shallow and unstable (high temperature variance) water-columns, which are prominent in the southern North Sea. The inability to detect aggregations around Orkney and Shetland without including the colony index may indicate that influential environmental drivers are absent from the GEE-GLM. Alternatively, this inability may suggest that breeding birds remain on landmasses or intertidal habitats. For example, breeders may be reliant on terrestrial and intertidal prey (e.g. nesting seabirds, rabbits, domestic refuse: Westerberg et al 2019), meaning that at-sea surveys do not detect aggregations around breeding colonies. If correct, then the predicted distribution of great black-backed gulls could be representative of the non-breeding population in summer.
Herring gull densities in the North Sea in summer are generally higher than in great black-backed gull. As with that species, densities are greatest in the southern North Sea, with a relatively coastal distribution (Figure 7). Distribution patterns have changed little since 1961-1990 and the prediction is for little further change under the future climate scenario. However, overall abundance has declined and is predicted to continue to do so. As with the other gull species, densities are higher in winter, reflecting a more offshore distribution though greatest in the southern North Sea particularly in coastal waters of East Anglia and the south-eastern sector of the North Sea. Moderate and widespread declines in abundance are predicted, particularly in coastal waters of East Anglia and in the south-eastern North Sea under the future climate scenario.
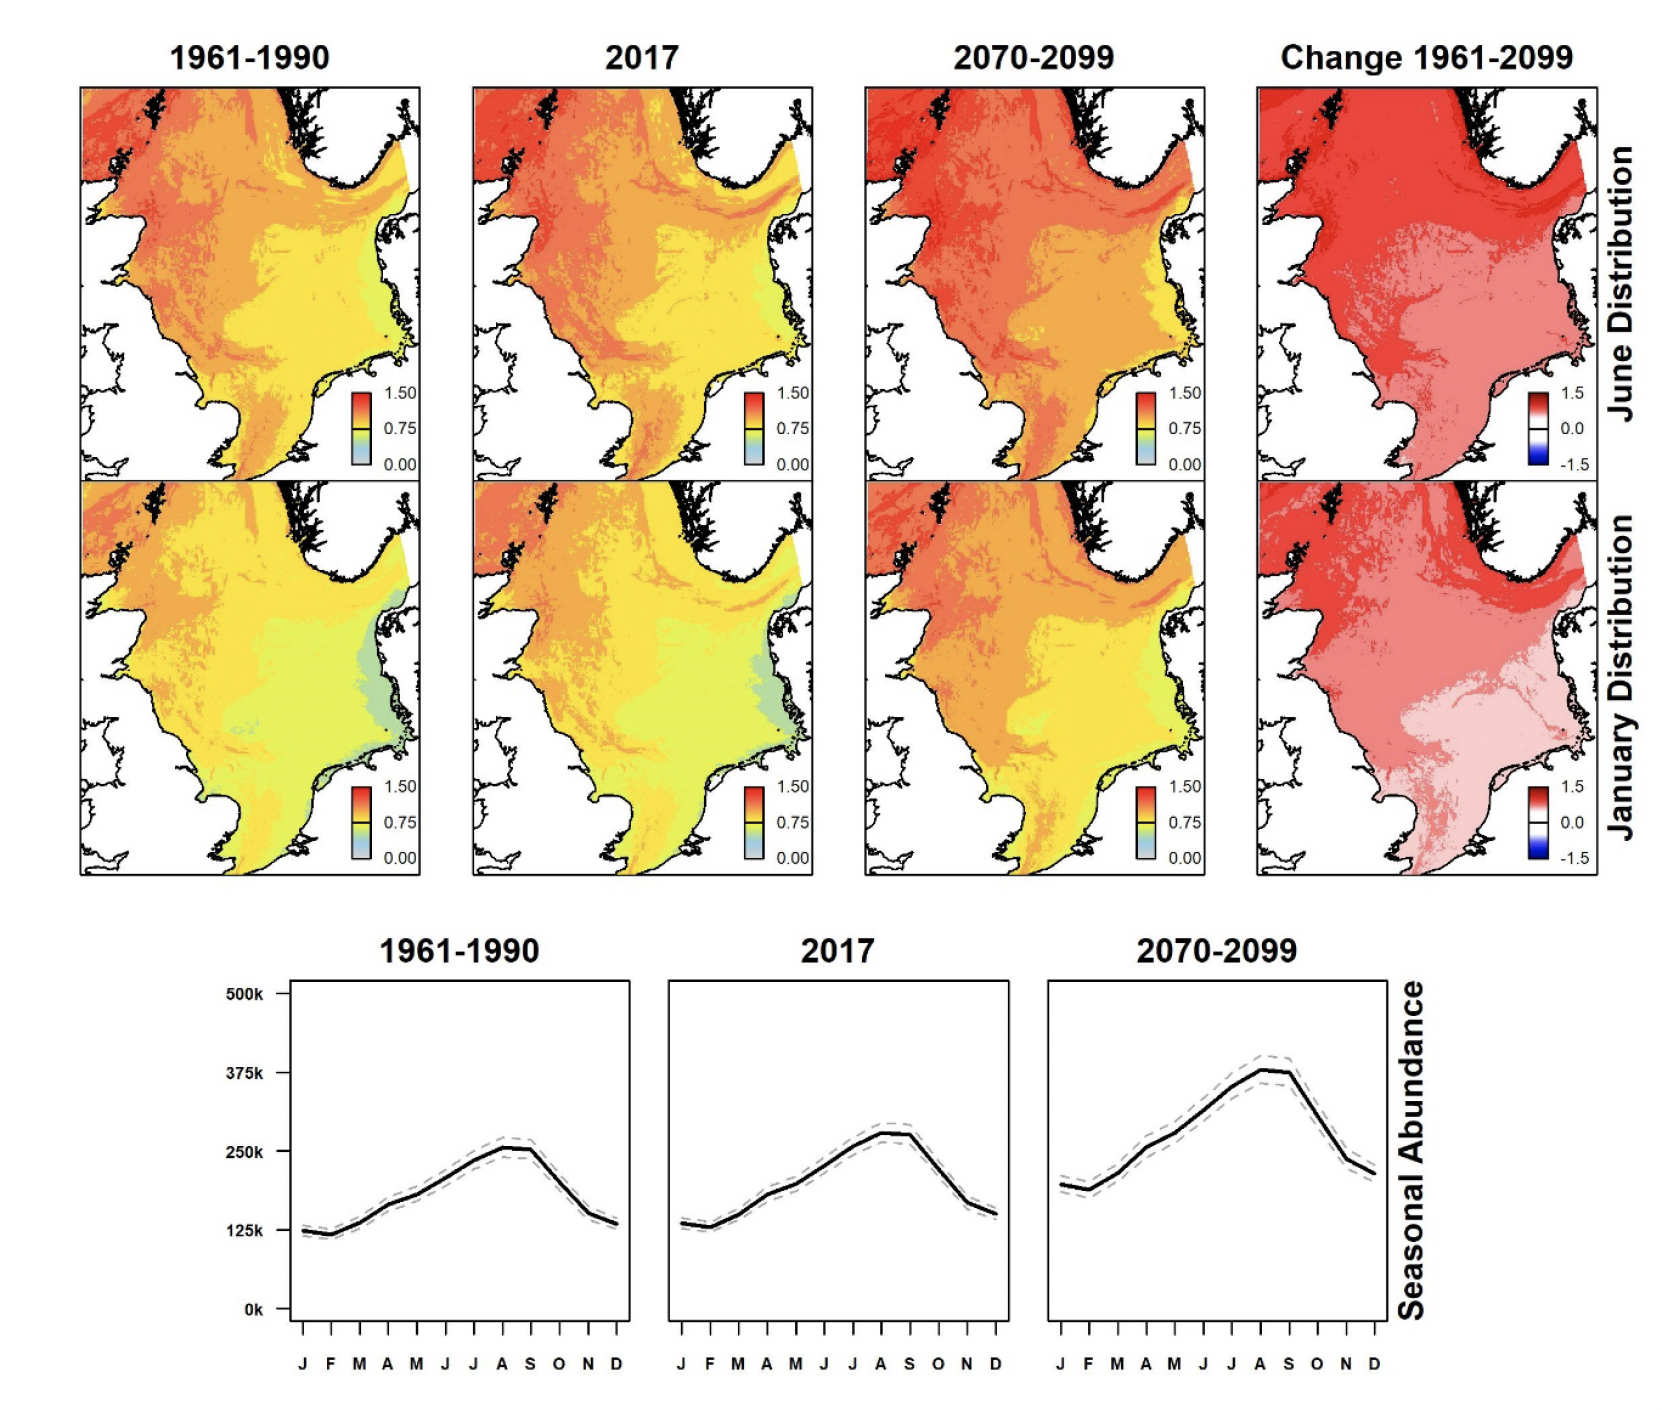
Densities of northern gannet in summer are greatest in the north-western North Sea, around eastern Scotland and the Northern Isles (Figure 8). These show a general increase in densities and overall abundance compared with 1961-1990. Under the future climate scenario, the prediction is for further increases particularly in the northern North Sea. Densities are lower and distribution more dispersed during winter, with increases, albeit less pronounced, since 1961-1990. These increases are also predicted to continue under the future climate scenario, remaining greatest in the northern half of the North Sea, particularly around eastern Scotland and southern Scandinavia.
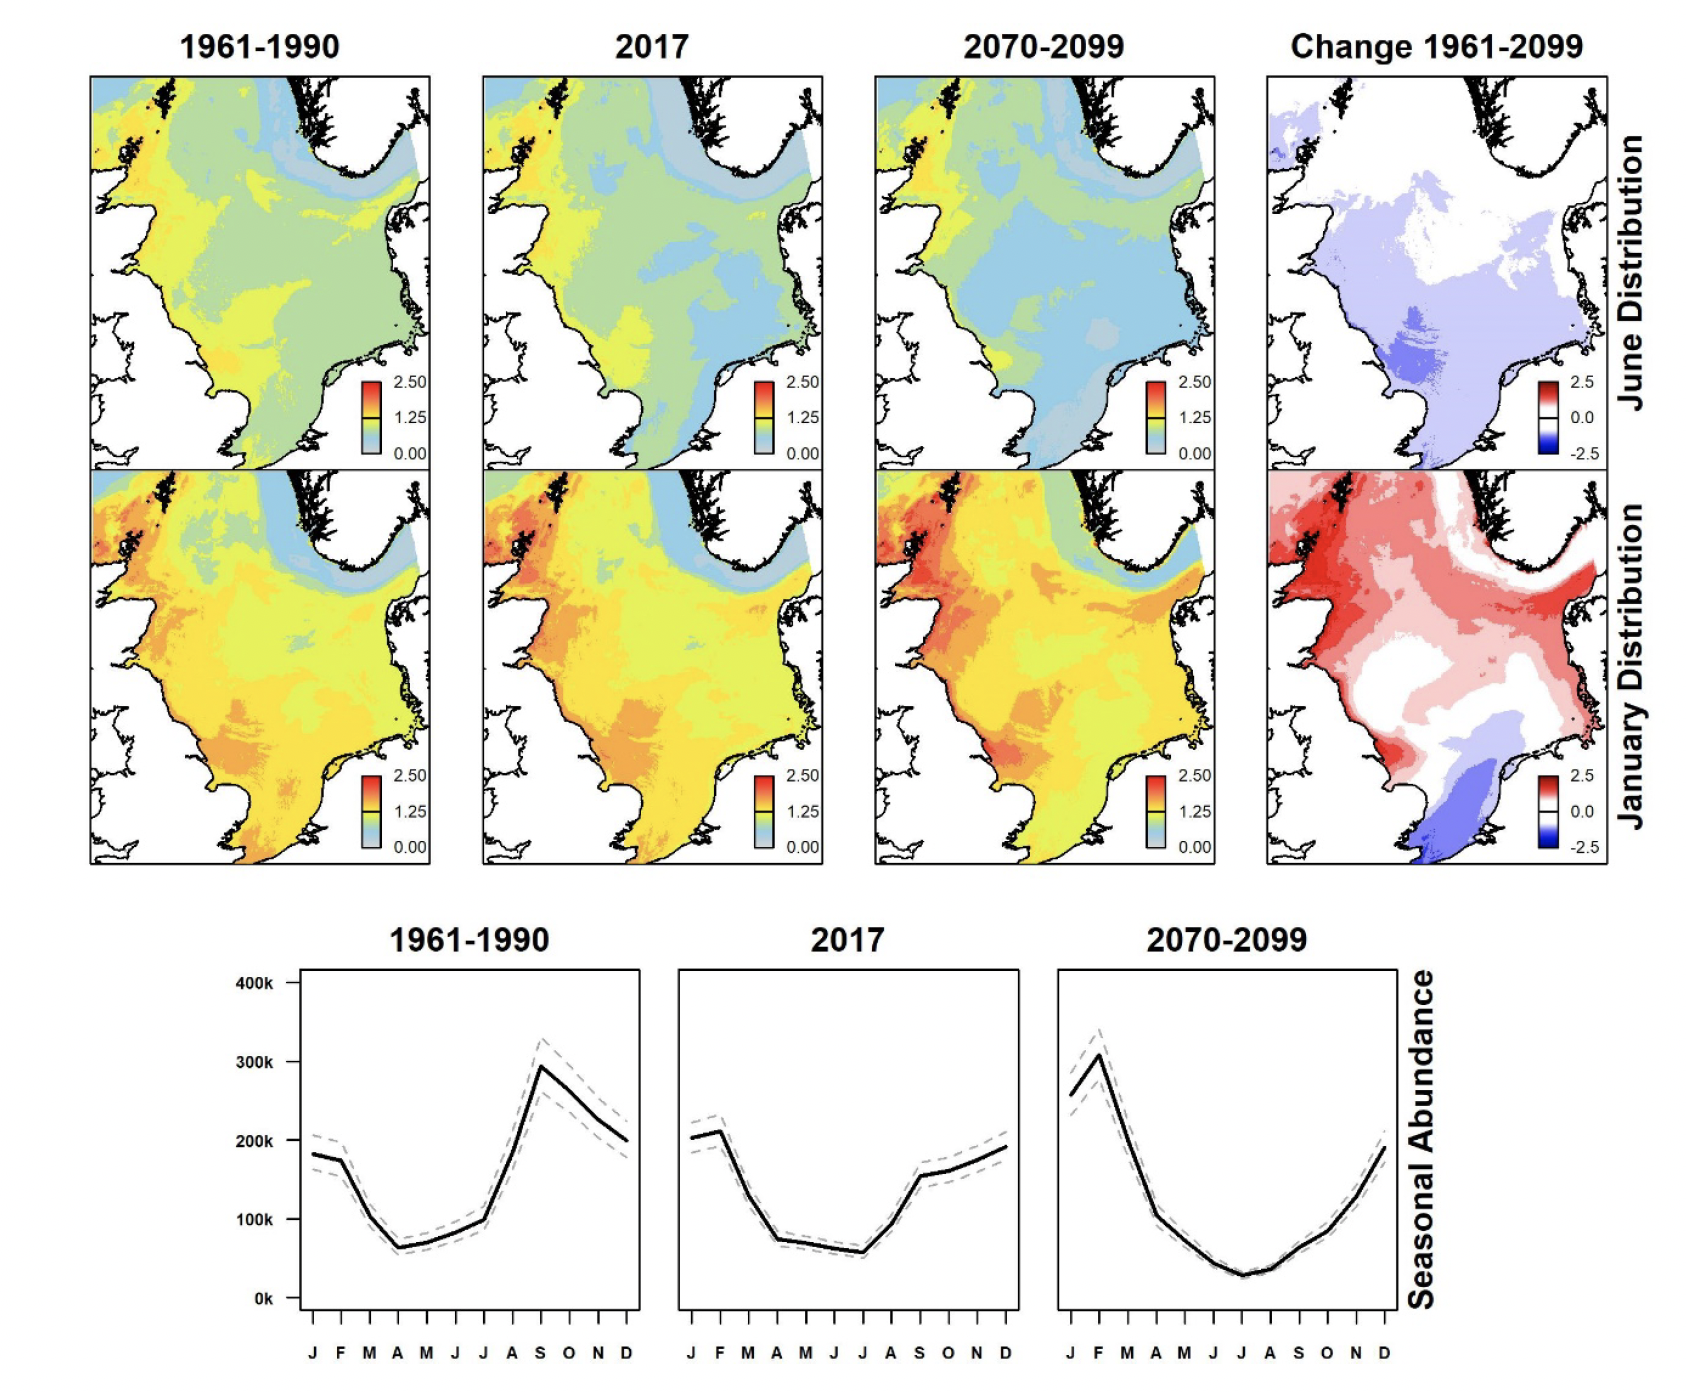
Razorbill densities in summer in the North Sea are greatest along the eastern seaboard of Britain (Figure 9). These have shown moderate declines since 1961-1990. Under the future climate scenario, those are predicted to continue, mainly in the southern sector of the North Sea. During winter, on the other hand, densities have slightly increased since 1961-1990, and are predicted to result in moderate increases in abundance in the northern North Sea under the future climate scenario but a decline in the southernmost North Sea.
In terms of seasonal use of the North Sea (Table 9), Atlantic puffin and northern gannet are primarily summer species and those patterns are predicted to remain under the future climate scenario. Black-legged kittiwake occurs throughout the year and will likely remain so in the future. Common guillemot, razorbill, great black-backed gull and herring gull show higher numbers across the North Sea in winter, and under the future climate scenario, the two auks (common guillemot and razorbill) could become primarily species present in winter.
Predicted changes in summer abundance between the 1960s and the 2090s under the future climate scenario (Table 10) indicate large declines for Atlantic puffin, moderate declines for black-legged kittiwake, razorbill, common guillemot and herring gull, little change for great black-backed gull, and large increases for northern gannet. During winter, similar trends are predicted though less pronounced for northern gannet, little change for common guillemot and herring gull, whereas razorbills are predicted to show moderate increases.
Two species are predicted to show general changes in distribution under the future climate scenario (Figure 5, Figure 9). These are common guillemot and razorbill both of which are expected to show increases in the north and decreases in the south. Only northern gannet is predicted to show a widespread increase, the rest showing moderate or widespread declines.
| Species | 1961-1990 | 2017 | 2070-2099 | Change 1961-2099 |
|---|---|---|---|---|
| Atlantic puffin | Primarily Summer | Primarily Summer | Primarily Summer | No Change |
| Black-legged kittiwake | All Year | All Year | All Year | No Change |
| Common guillemot | All Year | All Year | Primarily Winter | Becoming a Winter species |
| Great black-backed gull | Primarily Winter | Primarily Winter | Primarily Winter | No Change |
| Herring gull | Primarily Winter | Primarily Winter | Primarily Winter | No Change |
| Northern gannet | Primarily Summer | Primarily Summer | Primarily Summer | No Change |
| Razorbill | All Year | All Year | Primarily Winter | Becoming a Winter Species |
| Species | January | June |
|---|---|---|
| Atlantic puffin | Large Declines | Large Declines |
| Black-legged kittiwake. | Moderate Declines | Moderate Declines |
| Common guillemot | Similar | Moderate Declines |
| Great black-backed gull | Moderate Declines | Similar |
| Herring gull | Similar | Moderate Declines |
| Northern gannet | Moderate Increases | Large Increases |
| Razorbill | Moderate Increases | Moderate Declines |
| Species | January | June |
|---|---|---|
| Atlantic puffin | Widespread decline | Widespread decline |
| Black-legged kittiwake | Widespread decline | Widespread decline |
| Common guillemot | Increase in North – Decrease in South | Widespread decline |
| Great black-backed gull | Widespread decline | Widespread decline |
| Herring gull | Widespread decline | Widespread decline |
| Northern gannet | Widespread increase | Widespread increase |
| Razorbill | Increase in North – Decrease in South | Moderate Declines |
Demographic modelling
Productivity
In the main report, we present inference from the non-Bayesian analysis of the effects of climate on seabird productivity. For additional inference from Bayesian analyses of productivity see Appendix B.
Atlantic puffin
The best supported model for Atlantic puffin breeding success included only marine climatic variables from the pre-breeding period. This model included a strong negative relationship between sea surface temperature (SST) and productivity (mean effect: -0.683, P<0.001; Table 12), and a close to significant positive relationship between sea surface salinity and productivity (mean effect: 0.679, P: 0.066; Table 12). A model that also included terrestrial wind received some support in the data (delta AIC hereafter 'ΔAIC' 2.0), as did the model including marine and terrestrial variables (ΔAIC 3.2), with the model containing all climate variables receiving less support (ΔAIC 4.9) (Table 12). The null model with no environmental variables received very little support in the data compared to the best-fitting model (ΔAIC 7.41; Table 12). Finally, there was essentially no support in the data for models containing climate variables defined over the pre-breeding and breeding seasons combined (ΔAIC 9.93) or when defined over only the breeding season (ΔAIC 11.9) (Table 12). Model validation showed that the best-fitting model accounted for very little variation in the data (approx. 6%) when not including the individual level random effect (year by colony), with the climate variables explaining only around 3% of the total variation in the data (Table 12).
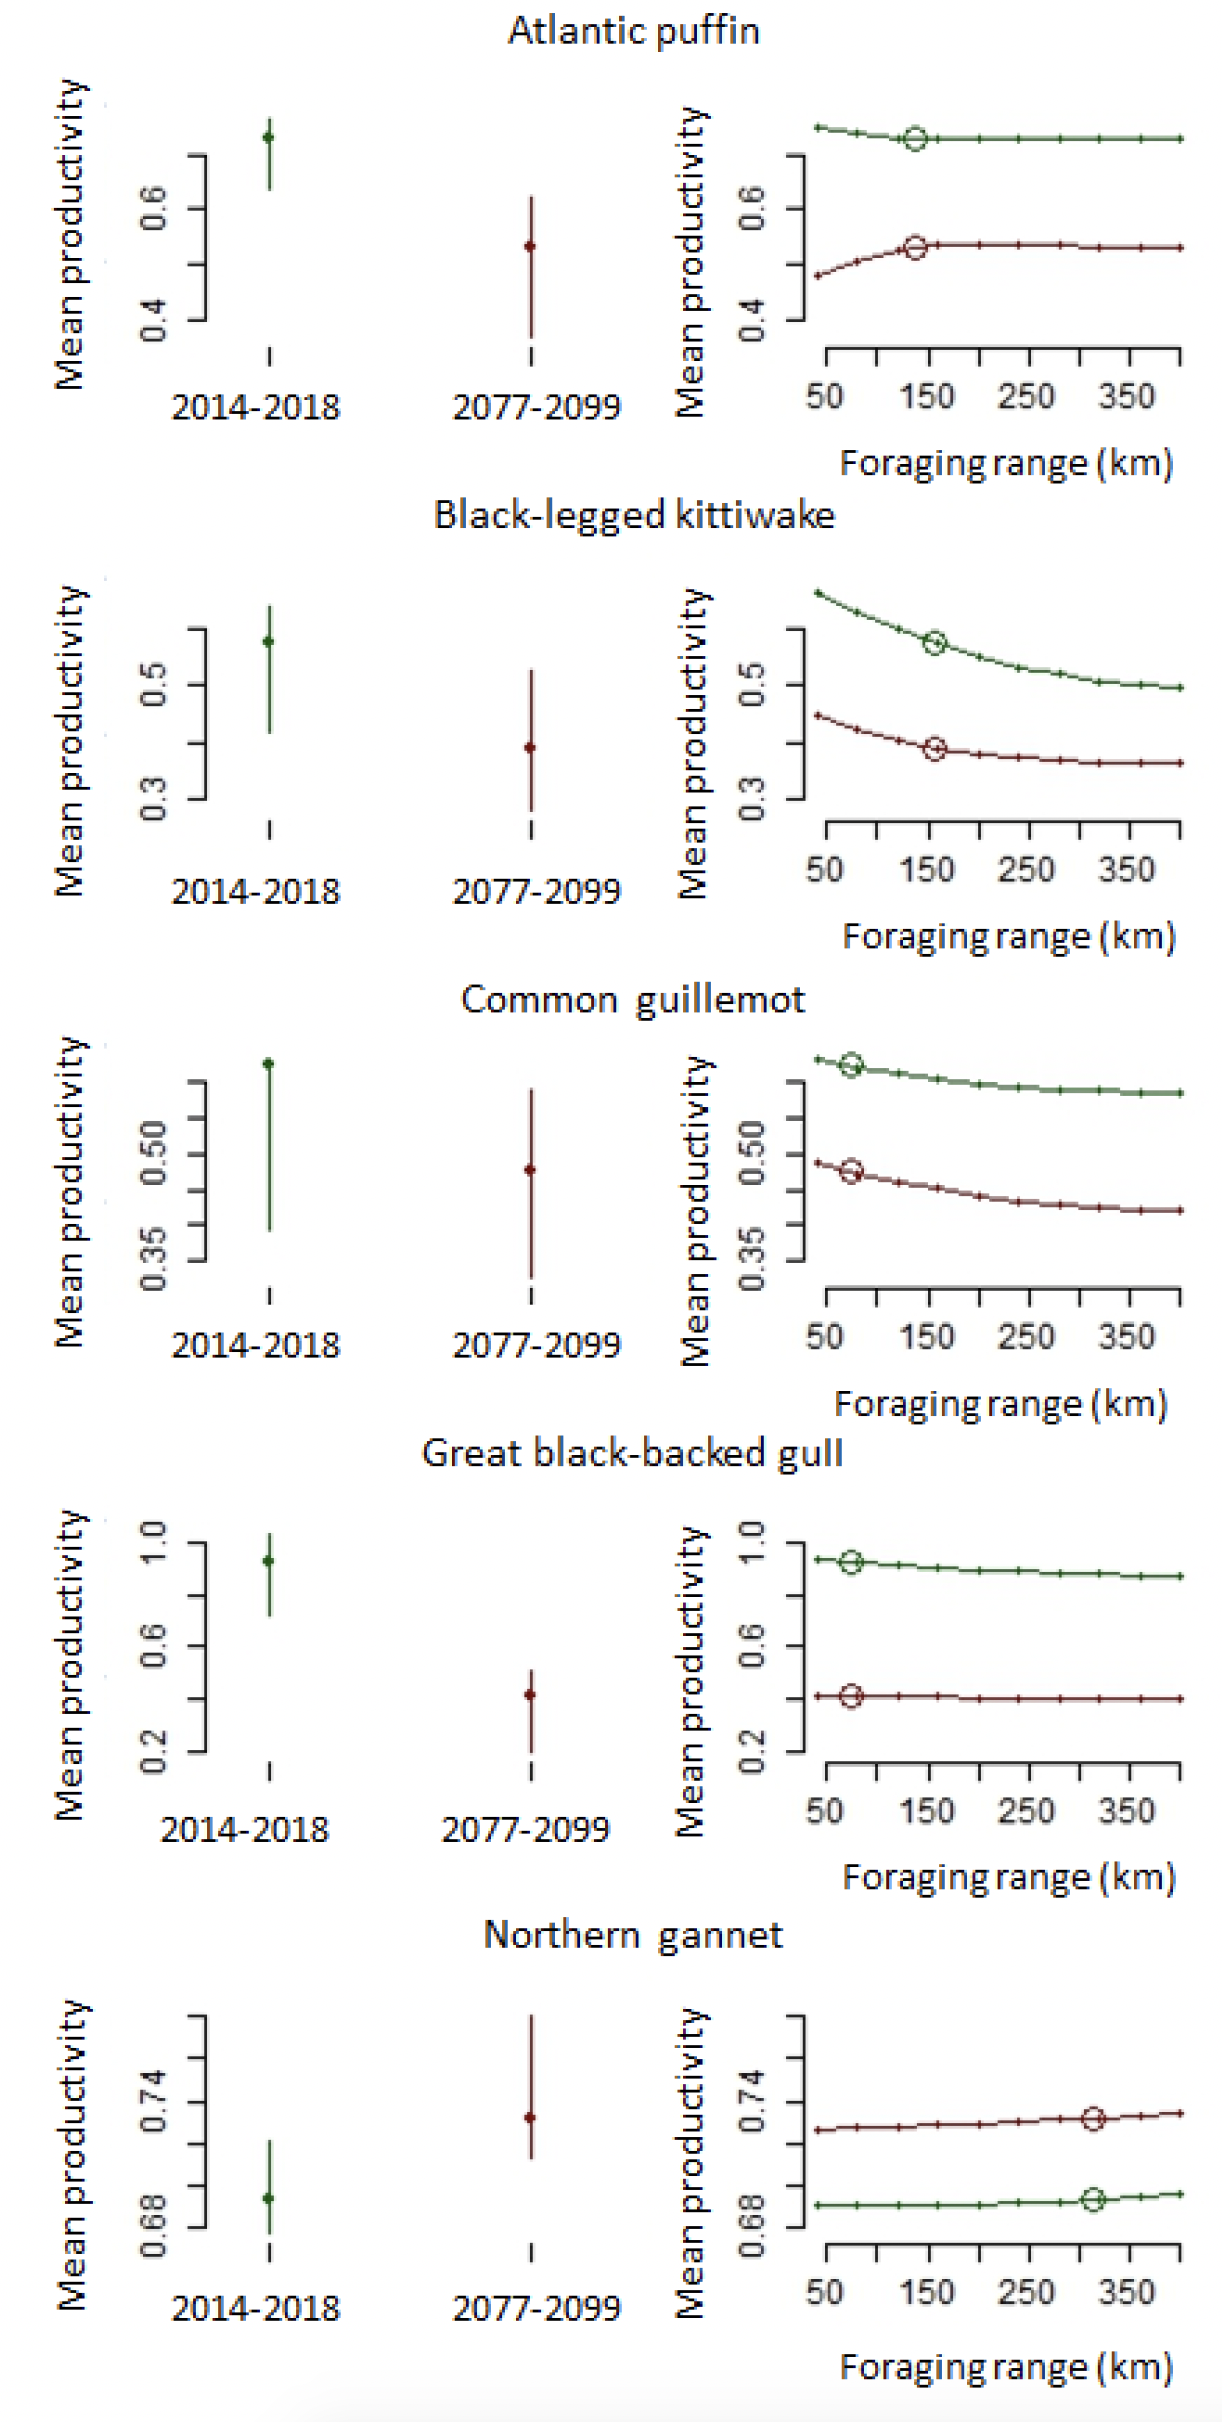
The best supported model estimated a current mean productivity during 2014-2018 climate conditions of 0.728 (95%CI: 0.628, 0.812), and for future conditions during 2085 of 0.531 (95%CI: 0.444, 0.690). Predicted access to suitable marine climatic conditions did not tend to vary much with increasing foraging range for this species, either under current or future projections (Figure 10).
Black-legged kittiwake
For this species, the best supported model for productivity included marine and terrestrial climate variables from the pre-breeding period only. These included strong negative effects for sea surface salinity (SLM; mean: -2.120, P <0.001) and terrestrial temperature (Temp; mean: -0.251, P 0.033), and a strong positive effect of terrestrial rain (Rain; mean: 0.669, P 0.014) (Table 12). A model that also included terrestrial wind received similar support in the data to the best supported model (ΔAIC 2.0; Table 12), with models including only marine (ΔAIC 7.5) or marine and terrestrial wind (ΔAIC 9.4) received very little support in the data compared to the best supported model (Table 12). The null model with no climate variables received essentially no support in the data in comparison to the best supported model (ΔAIC 32.8, Table 12). Models in which climatic variables were derived over the pre-breeding and breeding periods combined (ΔAIC 16.4) or over the breeding season only (ΔAIC 25.8) also received essentially no support in the data when compared to the best supported model using climate metrics in the pre-breeding period only (Table 12). Model validation showed that the best supported model for this species explained approximately 32% of the variation in the data, not including the individual level random effect (year by colony), with the fixed climatic parts of the model explaining around 11% of the variation in the data (Table 12).
The best supported model estimated a current mean productivity during 2014-2018 climate conditions of 0.576 (95%CI: 0.395, 0.753), and for future conditions during 2085 of 0.390 (95%CI: 0.242, 0.640). Predicted access to suitable marine climatic conditions did not improve with increasing foraging range for this species, either under current or future projections (Figure 10).
Common guillemot
The best supported model for productivity in this species included all climate variables (marine, terrestrial and wind) defined over the pre-breeding period only. None of the climate variables were strongly significant (P>0.05), but there was some evidence for negative effects of sea surface temperature (P 0.102) and sea surface salinity (P 0.101), along with a positive effect of terrestrial rainfall (P 0.058) (Table 12). There was very little separation between this best supported model and alternative models with different combinations of climate variables; a model including marine and terrestrial variables (ΔAIC 0.1), or including marine variables and terrestrial wind (ΔAIC 0.2), or including marine variables only (ΔAIC 0.8) all received essentially equal support in the data when compared to the best supported model (Table 12). However, the null model containing no climate effects received essentially no support in the data in comparison to the best supported model (ΔAIC 9.23), nor did models in which climate effects were derived over the breeding period only (ΔAIC 9.21). However, there was some support when climate variables were derived over the pre-breeding and breeding periods combined (ΔAIC 3.19) (Table 12). Model validation showed that the best supported model for this species explained approximately 24% of the variation in the data, not including the individual level random effect (year by colony), with the fixed climatic parts of the model explaining around 9% of the variation in the data (Table 12).
We were unable to generate predictions for the best supported model because it contained terrestrial wind, for which predictions were not available at the time of the project. We therefore used the second best supported model, containing marine and terrestrial variables, to generate current and future predictions for productivity for this species. This model estimated a current mean productivity during 2014-2018 climate conditions of 0.624 (95%CI: 0.495, 0.691), and for future conditions during 2085 of 0.476 (95%CI: 0.359, 0.639). Predicted access to suitable marine climatic conditions did not improve with increasing foraging range for this species, either under current or future projections (Figure 10).
European shag
In this species, the null model containing no climate effects was best supported by the data (Table 12).
Great black-backed gull
Defining climate variables over the breeding period only, including marine and terrestrial variables, resulted in the best supported model for productivity in this species. The model included strong negative relationships with both sea surface salinity (mean: -0.328, P 0.034) and terrestrial temperature (mean: -0.656, P 0.0011) (Table 12). A model that also included terrestrial wind received similar support in the data when compared to the best supported model (ΔAIC 1.9), as did models including marine only (ΔAIC 3.2) or marine and wind (3.2) (Table 12). The null model also received some support in the data for this species (ΔAIC 3.25; Table 12). Finally, defining climate variables over pre-breeding and breeding periods combined (ΔAIC 6.80) or over just the pre-breeding season (ΔAIC 8.91) did not result in strong support in the data in comparison to the best supported model where variables were defined over the breeding period only (Table 12). Model validation showed that the best supported model explained very little of the variation in the data (approx. 5% including colony and year random effects, but without the individual level random effect of colony by year), with the fixed climate effects contributing most of this explanatory power (Table 12).
The best supported model estimated a current mean productivity during 2014-2018 climate conditions of 0.923 (95%CI: 0.829, 1.06), and for future conditions during 2085 of 0.414 (95%CI: 0.338, 0.688). Predicted access to suitable marine climatic conditions did not improve with increasing foraging range for this species, either under current or future projections (Figure 10).
Herring gull
In this species, the null model containing no climate effects was best supported by the data (Table 12).
Northern gannet
In this species, the best supported model for productivity included only marine variables defined over the breeding season. This model included a strong negative correlation between sea surface salinity and productivity (mean: -0.630, P 0.032; Table 12). A range of other models received similar support in the data as the best supported model, including those including marine variables and terrestrial wind (ΔAIC 0.5), marine and terrestrial variables and wind (ΔAIC 0.5), marine and terrestrial variables (not including wind; ΔAIC 1.3). The null model also received similar support in the data (ΔAIC 1.86; Table 12). There was also very similar support for the model including only marine variables that were derived over the pre-breeding and breeding seasons combined (ΔAIC 0.22), and some support for the same model in which climate effects were derived over the pre-breeding period only (ΔAIC 3.50; Table 12). Model validation showed that the best supported model for this species explained very little of the variation in the data (approx. 3%), not including the individual level random effect (year by colony), with the fixed climatic parts of the model explaining just 1% of the variation in the data (Table 12).
The best supported model estimated a current mean productivity of 0.694 (95%CI 0.647, 0.726) for this species, with a future predicted increase to 0.732 (95%CI 0.664, 0.790). Predicted access to suitable marine climatic conditions did not tend to vary with foraging range for this species, either under current or future projections (Figure 10).
Razorbill
In this species, the null model containing no climate effects was best supported by the data (Table 12).
| Species | Best Model | Estimates | ΔAIC | R2 | ||||
|---|---|---|---|---|---|---|---|---|
| Atlantic puffin | Pre-breeding: NAO + SST** + SLM* | Estimate | SE | z | P | Null: 7.41 PBBS: 9.93 BS: 11.90 M+T: 3.2 M+W: 2.0 M+T+W: 4.9 | Fixed only: 0.032 Fixed + random: 0.064 | |
| NAO | 0.090 | 0.155 | 0.585 | 0.559 | ||||
| SST | -0.683 | 0.169 | -4.036 | <0.001 | ||||
| SLM | 0.679 | 0.369 | 1.841 | 0.066 | ||||
| Black-legged kittiwake | Pre-breeding: NAO + SST + SLM** + Temp** + Rain** | Estimate | SE | z | P | PBBS: 16.37 BS: 25.80 Null: 32.79 M+T+W: 2.0 M: 7.5 M+W: 9.4 | Fixed only: 0.111 Fixed + random: 0.318 | |
| NAO | 0.249 | 0.317 | 0.787 | 0.431 | ||||
| SST | -0.046 | 0.230 | -0.199 | 0.843 | ||||
| SLM | -2.120 | 0.441 | -4.802 | <0.001 | ||||
| Temp | -0.251 | 0.118 | -2.128 | 0.033 | ||||
| Rain | 0.66933 | 0.273 | 2.448 | 0.014 | ||||
| Common guillemot | Pre-breeding: NAO + SST* + SLM* + Temp + Rain* + WS | Estimate | SE | Z | P | PBBS: 3.19 Null: 9.23 BS: 9.21 M+T: 0.1 M+W: 0.2 M: 0.8 | Fixed only: 0.087 Fixed + random: 0.244 | |
| NAO | 0.240 | 0.310 | 0.772 | 0.440 | ||||
| SST | -0.536 | 0.328 | -1.637 | 0.102 | ||||
| SLM | -0.762 | 0.464 | -1.641 | 0.101 | ||||
| Temp | -0.136 | 0.156 | -0.874 | 0.382 | ||||
| Rain | 0.470 | 0.248 | 1.898 | 0.058 | ||||
| WS | 0.086 | 0.059 | 1.452 | 0.147 | ||||
| European shag | Null model | ΔAIC PB: 2.72; PBBS: 0.26; BS: 0.50 | ||||||
| Great black-backed gull | Breeding season: NAO + SST + SLM** + Temp** + Rain | Estimate | SE | z | P | PBBS: 6.80 PB: 8.91 Null: 3.25 M+T+W: 1.9 M: 3.2 M+W: 3.2 | Fixed only: 0.054 Fixed + random: 0.054 | |
| NAO | 0.110 | 0.115 | 0.957 | 0.339 | ||||
| SST | 0.058 | 0.197 | 0.292 | 0.770 | ||||
| SLM | -0.328 | 0.155 | -2.116 | 0.034 | ||||
| Temp | -0.656 | 0.202 | -3.251 | 0.0011 | ||||
| Rain | -1.521 | 4.189 | -0.363 | 0.717 | ||||
| Herring gull | Null model | ΔAIC BS: 3.45; PBBS: 3.74; PB: 4.83 | ||||||
| Northern gannet | Breeding season: NAO + SST + SLM** | Estimate | SE | z | P | Null: 1.86 PBBS: 0.22 PB: 3.50 M+T: 1.3 M+W: 0.5 M+T+W: 0.5 | Fixed only: 0.010 Fixed + random: 0.029 | |
| NAO | -0.023 | 0.015 | -1.517 | 0.129 | ||||
| SST | 0.070 | 0.062 | 1.131 | 0.258 | ||||
| SLM | -0.630 | 0.293 | -2.150 | 0.032 | ||||
| Razorbill | Null model | ΔAIC PB: 2.25; PBBS: 1.53; BS: 1.40 | ||||||
Population growth rate
In general, models for population growth rates derived from abundance data performed very poorly in explaining variation in the data, ranging from just 2-7% (Table 13). Therefore, we did not use these models to generate future predictions for population growth rate using climate projections. However, we did detect some significant effects of climate on population growth rates for some species.
Atlantic puffin
In this species, the null model containing no climate effects was best supported by the data (Table 13).
Black-legged kittiwake
The best supported model for population growth rate in this species included marine variables and terrestrial wind, derived over the pre-breeding period (Table 13). This model included a significant positive correlation between terrestrial wind speed and growth rate (effect: 0.042, P 0.004; Table 13), a close to significant negative effect of sea surface salinity (effect: -0.162, P0.055; Table 13), and some support for an additional positive effect of NAO on growth rate (effect: 0.190, P 0.09; Table 13).
Common guillemot
In this species, the null model containing no climate effects was best supported by the data (Table 13).
European shag
The best supported model included only marine variables during the non-breeding period, with a significant positive effect of NAO on population growth rate (effect: 0.423, P 0.003; Table 13).
Great black-backed gull
In this species, the best supported model included effects of marine, terrestrial and wind speed climate variables, derived over the breeding season (Table 13). A significant positive effect was detected for terrestrial wind speed (effect: 0.089, P 0.013), and a marginally significant positive effect of terrestrial rain (effect: 1.664, P 0.066; Table 13).
Herring gull
The best supported model included effects for marine climate variables and terrestrial wind speed throughout the whole year, with a significant positive effect of sea surface salinity (effect: 0.195, P <0.001), and significant negative effects for sea surface temperature (effect: -0.114, P <0.001) and terrestrial wind speed (effect: -0.043, P 0.005; Table 13).
Northern gannet
In this species, the best supported model for population growth rate included effects of marine and terrestrial climate variables, derived over the non-breeding season (Table 13). This model showed a significant positive effect on population growth rate for terrestrial temperature (effect: 0.268, P <0.001) and marginal support for a positive effect of NAO (effect: 0325, P 0.095; Table 13). The model also included a significant negative effect of sea surface temperature on population growth rate (effect: -0.384, P <0.001; Table 13).
Razorbill
The best supported model for population growth rate included marine climate variables and terrestrial wind speed, derived over the non-breeding season (Table 13). There was a significant negative effect of sea surface salinity (effect: -0.207, P 0.01) and a significant positive effect of terrestrial wind (effect: 0.038, P 0.023; Table 13).
Bayesian models for population growth rate using abundance data
Bayesian models for trends in abundance using the SMP data proved intractable. There were major issues of non-convergence when fitting the trends models in a Bayesian framework, which is the most appropriate framework for modelling data such as these with high levels of missing-ness and potential observation error. We therefore do not report the results from these models here, but see Appendix B for a summary of results. These issues are likely to arise because the abundance data contain insufficient information to be able to meaningfully constrain the parameters of model, which may in turn be because of the high proportion of missing counts within the SMP meaning that the proportion of colony-by-year combinations for which count data were available was relatively low.
| Species | Best Model | Estimates | ΔAIC | R2 | ||||
|---|---|---|---|---|---|---|---|---|
| Atlantic Puffin | Null | ΔAIC AY: 7.98; NB: 8.40; PB: 8.66; PBBS: 8.08; BS: 8.35 | ||||||
| Black-legged kittiwake | All year: NAO* + SST + SLM* + WS** | Estimate | SE | z | P | NB: 0.25 AY: 0.36 PBBS: 4.66 BS: 4.96 Null: 8.02 M+T+W: M: M+T: | Fixed only 0.0045 Fixed + random 0.025 | |
| NAO | 0.190 | 0.113 | 1.678 | 0.093 | ||||
| SST | 0.0055 | 0.035 | 0.157 | 0.875 | ||||
| SLM | -0.162 | 0.084 | -1.916 | 0.055 | ||||
| WS | 0.042 | 0.015 | 2.884 | 0.0039 | ||||
| Common guillemot | Null | ΔAIC BS: 4.27; PBBS: 3.67; PB: 2.86; AY: 8.54; NB: 8.08 | ||||||
| European shag | Non-breeding: NAO** + SST + SLM | Estimate | SE | Z | P | AY: 0.27 Null: 2.21 PBBS: 7.63 PB: 7.57 BS: 7.72 M+W: M+T: M+T+W: | Fixed only 0.0078 Fixed + random 0.028 | |
| NAO | 0.423 | 0.141 | 2.992 | 0.0027 | ||||
| SST | 0.027 | 0.044 | 0.624 | 0.533 | ||||
| SLM | -0.0095 | 0.019 | -0.502 | 0.616 | ||||
| Great black-backed gull | Breeding season: NAO + SST + SLM + Temp + Rain** + WS** | Estimate | SE | Z | P | Null: 5.04 AY: 5.30 PBBS: 4.19 NB: 5.62 PB: 9.24 M+W: M: M+T: | Fixed only 0.025 Fixed + random 0.071 | |
| NAO | 0.030 | 0.022 | 1.379 | 0.168 | ||||
| SST | -0.020 | 0.061 | -0.329 | 0.742 | ||||
| SLM | 0.0018 | 0.092 | 0.019 | 0.985 | ||||
| Temp | 0.0574 | 0.045 | 1.267 | 0.205 | ||||
| Rain | 1.664 | 0.903 | 1.842 | 0.066 | ||||
| WS | 0.089 | 0.036 | 2.491 | 0.013 | ||||
| Herring gull | All year: NAO + SST** + SLM** + WS** | Estimate | SE | z | P | NB: 1.84 BS: 0.06 PBBS: 0.97 PB: 7.63 Null: 17.09 M+T+W: M: M+T: | Fixed only 0.020 Fixed + random 0.023 | |
| NAO | -0.011 | 0.133 | -0.083 | 0.934 | ||||
| SST | -0.114 | 0.033 | -3.401 | 0.00067 | ||||
| SLM | 0.195 | 0.040 | 4.895 | <0.001 | ||||
| WS | -0.043 | 0.015 | -2.805 | 0.0050 | ||||
| Northern gannet | Non-breeding: NAO* + SST** + SLM + Temp** + Rain | Estimate | SE | z | P | Null: PB: AY: PBBS: BS: M+T+W: M: M+W: | Fixed only 0.042 Fixed + random 0.046 | |
| NAO | 0.325 | 0.195 | 1.672 | 0.095 | ||||
| SST | -0.384 | 0.103 | -3.746 | 0.00018 | ||||
| SLM | -0.033 | 0.194 | -0.171 | 0.865 | ||||
| Temp | 0.268 | 0.054 | 4.916 | <0.001 | ||||
| Rain | 0.0167 | 0.056 | 0.297 | 0.766 | ||||
| Razorbill | Non-breeding: NAO + SST + SLM** + Wind** | Estimate | SE | z | P | Null: 1.00 PB: 3.63 AY: 2.43 PBBS: 5.35 BS: 6.03 | Fixed only 0.0084 Fixed + random 0.030 | |
| NAO | -0.18922 | 0.17491 | -1.082 | 0.2793 | ||||
| SST | 0.07953 | 0.06860 | 1.159 | 0.2463 | ||||
| SLM | -0.20696 | 0.08101 | -2.555 | 0.0106 | ||||
| Wind | 0.03834 | 0.01691 | 2.267 | 0.0234 | ||||
Survival
Our analyses of the relationships between survival and climate were inconclusive, with the models having very low explanatory power, and frequently yielding implausible predictions of survival (e.g., survival rates higher than one). We have, therefore, not presented the results of these analyses in the main report, although the methodology and results are given in Appendix C.
Contact
Email: ScotMER@gov.scot