Seabird species off the east coast of Scotland - impact of climate change: study
This study investigated the potential impacts of climate change on seabird distribution, abundance and demography off the east coast of Scotland, and examined integration of these climate models into standard population forecast models used in assessments for offshore wind developments.
Methods
We constructed statistical models to link existing data sources (at-sea survey data on the spatial distribution of birds, nest monitoring data on productivity and colony abundance data) to key climate-related variables. The analyses of at-sea survey data built upon previous models developed for the NERC/DEFRA funded MERP (Waggitt et al. 2020)and ORJIP Sensitivity Mapping (Searle et al. 2019) projects. We conducted the statistical analyses of productivity and abundance using colony-specific and year-specific values, for breeding colonies throughout the region of interest. We used these models to generate projections of future spatial distributions and demography under one future scenario of climate change. We also estimated the change in foraging range that would be required in order for each seabird species to maintain their current prey intake at each breeding colony. This was estimated using proxies for prey distribution, abundance and availability, which are determined by bottom-up processes propagating through lower trophic levels (Frederiksen et al. 2006; van Deurs et al. 2009).
Data on demography and abundance
This project considered eight species of seabirds, all breeding on the east coast of Scotland:
- northern gannet Morus bassanus
- black-legged kittiwake Rissa tridactyla
- common guillemot Uria aalge
- razorbill Alca torda
- Atlantic puffin Fratercula arctica
- herring gull Larus argentatus
- great black-backed gull Larus marinus
- European shag (spatial distribution not modelled) Phalacrocorax aristotelis
We obtained annual colony-level seabird abundance and productivity data, derived primarily from the Seabird Monitoring Programme (SMP), but augmented by additional count data for northern gannet from Prof. Sarah Wanless (UKCEH fellow); breeding success for black-legged kittiwakes, common guillemots, razorbills and European shags for the Isle of May NNR (UKCEH); and additional plot count data for these four species, also from the Isle of May NNR (UKCEH). For the additional plot count data, we used a regression model to link the colony level counts to plot counts within each colony (Poisson GLM: colony pairs ~ plot pairs). Finally, adjustment factors ('k' values) were used to convert raw counts of individuals to breeding pairs for common guillemots and razorbills, obtained from the Isle of May long-term study (Harris et al. 2015a; 2015b; updated).
The primary aim of the modelling was to predict the impact of future climate change within the Forth-Tay region. However, generating such predictions require colonies beyond this region to be included in the statistical modelling to ensure that the statistical modelling covers the range of climates that might be expected to occur within the Forth-Tay region under future climate change (a "climate envelope" modelling approach). Basing the model upon a very wide spatial area would, however, risk including populations that are influenced by different biological mechanisms to those operating in the Forth-Tay region. It was decided, in discussion with the project steering group (PSG), that the best compromise was to consider colonies along the east coast of Britain – i.e., within the region that stretches from Kent to Caithness, together with Orkney and Shetland.
Successful modelling of the empirical relationship with climate is only possible for colonies that have sufficient data. Therefore, we imposed a minimum data requirement that colonies must have at least nine years of data since 1986 (e.g. >25% coverage) for either breeding success or abundance. The threshold (25% coverage) is somewhat arbitrary, as there is no obvious rule for determining the appropriate level of coverage to consider, but ensures that the analysis focuses on colonies with a reasonable level of temporal coverage, which is important given that focus here is upon change over time.
The SMP is structured as "Sites" that are contained within "Master Sites". The latter, higher level, of site definitions are generally of most practical interest (as, for example, they often correspond to SPAs), but as data are provided at the lower "Site" level it is not always possible to extract data at the "Master Site" level (e.g., if only some of the "Sites" within a "Master-site" have been counted within a particular year). Where possible, we aggregated 'Sites' up to 'Master Sites' in the SMP to better represent biological populations: aggregation was done for sites where the number of years with complete counts for all 'sites' within the 'master-site' was within four years of the number of years of counts for the best observed site within that master-site (i.e., if the best observed 'site' had ten years with counts, sites were only aggregated up to 'master site' if there were complete counts for all 'sites' within the 'master site' in at least six years). We chose a threshold of four years to ensure that the aggregation approach could be used reasonably often (if we were to apply a threshold of zero years, for example, then aggregation would be possible in far fewer cases), whilst ensuring that the number of years dropped from the analysis as a result of aggregating is not too large (because the aggregation means that only years with data for all sites within the master-site can be included in the analysis).
Applying this methodology resulted in a range of breeding colonies to use in the demographic modelling for each species. For analyses of productivity this ranged from four colonies for northern gannet, up to 40 colonies for black-legged kittiwakes (Table 1), with lower numbers for analyses of survival. Full details of the selected colonies are in the appendix.
| Species | Abundance | Productivity | Survival |
|---|---|---|---|
| Atlantic puffin | 11 | 4 | 2 |
| Common guillemot | 15 | 10 | 5 |
| European shag | 39 | 19 | 12 |
| Northern gannet | 7 | 6 | 4 |
| Razorbill | 17 | 9 | 6 |
| Herring gull | 42 | 19 | 12 |
| Great black-backed gull | 46 | 12 | 8 |
| Black-legged kittiwake | 76 | 40 | 23 |
Survival data
Adult survival rates for the eight species in this study have been published in the peer-review literature and reviewed in contract reports (Horswill & Robinson 2015; Searle et al. 2020). We used the published rates for adult survival from these reports for each species in the demographic modelling (Table 2).
| Species | Adult | Juvenile | |
|---|---|---|---|
| Mean survival | SD | Mean survival | |
| Atlantic Puffin | 0.906 | 0.083 | 0.737 |
| Common Guillemot | 0.939 | 0.015 | 0.786 |
| Herring Gull | 0.834 | 0.034 | 0.794 |
| Great Black-Backed Gull | 0.930 | 0.034 | 0.790 |
| Kittiwake | 0.854 | 0.051 | 0.790 |
| Northern Gannet | 0.919 | 0.042 | 0.728 |
| Razorbill | 0.895 | 0.067 | 0.794 |
| Shag | 0.858 | 0.194 | 0.615 |
Data on climate and other environmental characteristics
Terrestrial climate variables
To identify climate variables of relevance to seabird demographics, we conducted a literature review using Web of Science (WoS) and the terms 'seabirds', 'climate', 'productivity', 'breeding success', 'survival' and 'demography'. This identified 20 published studies (Appendix A), which we summarised into two sets of climate variables relating to either breeding success or adult survival (Table 3). Of these, we selected the following monthly terrestrial variables to use within the demographic modelling, all of which were taken from data for the nearest UK Met Office weather station:
Breeding success:
- Mean of daily minimum air temperature
- Summed daily precipitation
- Mean wind speed
Adult survival:
- Mean of daily minimum air temperature
- Max precipitation
- Mean wind speed
For breeding success, each terrestrial variable was aggregated into a value across the set of months most relevant to each species in terms of pre-breeding attendance at colonies, incubation and chick-rearing. For adult survival, variables were aggregated into the non-breeding season, or over the whole year. The biological periods are based on those used within the NERC MERP at-sea seabird distribution modelling, and were selected to reflect when a substantial portion of the local population of a the particular species remains close to the colony (Waggitt et al. 2020; Table 4, Table 5).
| Demographic rate | Climate parameters | References |
|---|---|---|
| Breeding success | Air temperature/effective temperature/min temp Mean wind speed Wind direction Prevailing wind Precipitation (max or summed) Spring NAO, winter NAO Chlorophyll SST | (Jones et al. 2007, Lewis et al. 2009, Smith and Gaston 2012, Watanuki and Ito 2012, Monticelli et al. 2014, Lewis et al. 2015, Zuberogoitia et al. 2016, Howells et al. 2017, Christensen-Dalsgaard et al. 2018, Pakanen 2018, Gardarsson and Jonsson 2019, Michielsen et al. 2019) |
| Adult survival | Wind magnitude/wind speed/onshore wind Mean winter SST, SST anomalies Winter NAO AO (non-breeding season) Min temp (winter) Winter precipitation | (Jones et al. 2007, Frederiksen et al. 2008, Hario et al. 2009, Tomita et al. 2009, Tranquilla et al. 2010, Smith and Gaston 2012, Genovart et al. 2013, Zuberogoitia et al. 2016, Guery et al. 2017, McKnight et al. 2019) |
| Species | Jan | Feb | Mar | Apr | May | Jun | Jul | Aug | Sep | Oct | Nov | Dec |
|---|---|---|---|---|---|---|---|---|---|---|---|---|
| Atlantic puffin | x | x | x | x | x | |||||||
| Black Legged-kittiwake | x | x | x | x | x | |||||||
| Common guillemot | x | x | x | x | ||||||||
| European shag | x | x | x | x | x | x | ||||||
| Herring gull | x | x | x | x | ||||||||
| Great Black-backed Gull | x | x | x | x | ||||||||
| Northern gannet | x | x | x | x | x | x | x | |||||
| Razorbill | x | x | x | x |
This results in a set of 'pre-breeding' months, 'breeding season' months, 'preceding year' definitions, and 'non-breeding' months for each of the eight species (Table 5), which were used within the demographic models.
| Species | Pre-breeding months | Breeding season months | Preceding year based on post breeding season census | Winter months |
|---|---|---|---|---|
| Atlantic puffin | February - March | April – August | May - April | September – March |
| Black-legged kittiwake | February – March | April – August | May – April | September – March |
| Common guillemot | February – March | April – July | May – April | August – March |
| European Shag | February – March | March – August | April – March | September – February |
| Herring gull | February – March | April – July | May – April | August – March |
| Great black-backed gull | February – March | April – July | May – April | August – March |
| Northern gannet | February – March | April – October | May – April | November - March |
| Razorbill | February - March | April – July | May – April | August – March |
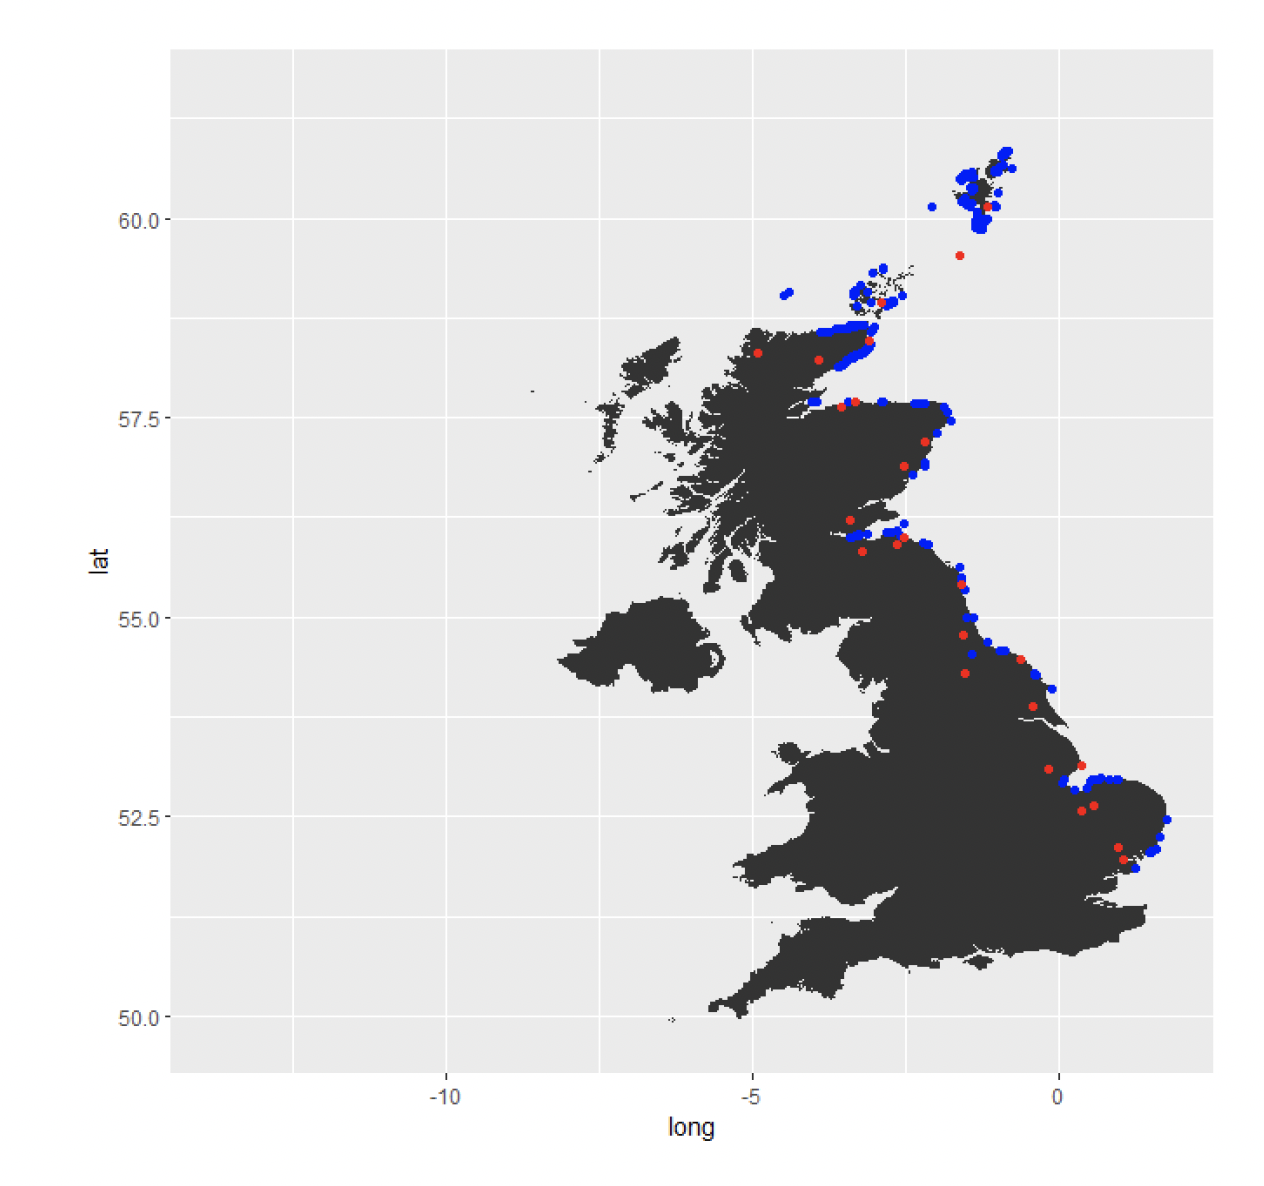
All UK Met Office data were downloaded from CEDA (Met Office, 2019). The nearest UK weather stations for each selected breeding colony are shown below:
Figure 1. Locations of nearest UK weather stations (red) for the selected seabird breeding colonies (blue) on the East coast of the UK.
Marine climate variables
We selected marine climate variables previously demonstrated to correlate with seabird distribution and demography, all of which were used in the spatial distribution modelling, with only three marine variables (NAO, sea surface temperature and sea surface salinity) used in the demographic modelling (Table 6). Models were parameterised using hindcast variables from 1985 to 2018, with oceanography (temperature, salinity) sourced from FOAM AMM7 models (O'Dea et al 2014, available from the Marine Environmental Monitoring Service: MEMS (2022)) and climatic indices (AMO, NAO) sourced from the MET Office (Tinker et al 2016). Distribution models were also parameterised using static/non-dynamic variables including topographic values (depth) from EMODNet (2022) and oceanography (mean current speed) from FOAM AMM15 models (Tonani et al 2019, available from MEMS). All predictions for future climate were made using forecasted variables from UKCP09 projections for the SRES Scenario A1B (medium). Spatiotemporal forecast variables represent an average over a 30 year future (2070-2099). Note that at the time of project commencement all required marine variables were not available from the updated UKCP18 climate projections, hence we were forced to use the older UKCP09 projections in the modelling.
| Column | Details | Spatial Scale | Temporal Scale | Notes |
|---|---|---|---|---|
| Date | MMM - YY | - | 1975 = average conditions in 1961-1990 from Hindcast. 2085 = average conditions in 2070-2099 from Forecast. | |
| Year | Year | - | 1975 = average conditions in 1961-1990 from Hindcast. 2085 = average conditions in 2070-2099 from Forecast. | |
| Month | Month | - | ||
| Lon | Eastings in UTM30N | - | ||
| Lat | Northings in UTM30N | - | ||
| SST | Sea Surface Temperature in Celsius | 2.5km | Monthly | Resampled to 2.5km from ~7km resolution using bilinear interpolation. |
| SLM | Sea Surface Salinity in ppt | 2.5km | Monthly | Resampled to 2.5km from ~7km resolution using bilinear interpolation. |
| BAT | Depth in m | 2.5km | Monthly | Resampled to 2.5km from <1km resolution using block-averaging. |
| FEA | Seabed Roughness in m | 2.5km | -Static | Derived from BAT using a terrain ruggedness index (TRI) to identify topographic features including banks, trenches and ridges. |
| SPM | Mean Depth-Averaged Current Speed in ms-1 | 2.5km | -Static | Resampled to 2.5km resolution from ~2km resolution using bilinear interpolation. |
| HU3 | Simpson-Hunter Stratification Index | 2.5km | -Static | Derived from BAT and SPM to identify mixed, frontal and stratified water columns. |
| NAO | North Atlantic Oscillation | - | Annual | Normalised Winter Average (Dec, Jan, Feb). In 1975 represents average in 1961-1990. In 2085 represents average in 2070-2099. |
| AMO | Atlantic Multidecadal Oscillation | - | Annual | Normalised Annual Average. In 1975 represents average in 1961-1990. In 2085 represents average in 2070-2099. |
The annual marine environmental data relate to a spatial grid. The gridded data were used directly within the models of distribution, but for the models of demography they were translated into a single annual summary metric of each environmental variable for each breeding colony. The approach used was similar to that used by Carroll et al. (2015): we calculated a weighted mean of the environmental variable. Because we needed to calculate values for non-breeding and pre-breeding seasons as well as the breeding season, rather than basing the weights upon estimated utilisation distributions derived from GPS tracking data (which only relate to the chick rearing period) we based the weights upon a simpler distance-decay rule that allocates more weight to locations close to the breeding colony than to locations that are far away. Specifically, we assumed that the weight of each grid cell is the form
where represents the distance by sea from the grid cell midpoint to the breeding colony, and where represents the decay rate for the species. The weights are rescaled so that they sum to one across all grid cells. We estimated the decay rate for each species to be the value such that 95% of all weights would, in an area of sea without land, be allocated to locations within the published mean-max foraging range (Thaxter et al., 2012) of the colony. Note that foraging ranges were derived from Thaxter et al. (2012) rather than the more recent Woodward et al. (2019) data because during the initial stages of the project inception Woodward et al. (2019) had not yet been published.
Statistical models for spatial distribution of birds
Climate change may be expected to alter the spatial distribution of prey, and hence to alter the areas that are most suitable for foraging. We are using a statistical model to quantify the likely impact of climate change in altering the spatial distribution of foraging locations.
As part of the NERC/DEFRA funded Marine Ecosystems Research Programme (MERP), a species distribution model (SDM) was developed to predict the at-sea distribution and densities (animals per km2) of 12 prevalent species; Atlantic puffin, black-legged kittiwake, common guillemot, razorbill, European shag, European storm-petrel Hydrobates pelagicus, herring gull, lesser black-backed gull, Manx shearwater Puffinus puffinus, northern fulmar Fulmarus glacialis, and northern gannet (Waggitt et al, 2020). SDMs quantify relationships between densities and ecologically-relevant environmental descriptors, and then use the relationships to predict distributions in particular regions and/or times. Using a series of environmental variables (temperature, temperature variance, fronts, depth and bathymetric roughness) averaged across the study period (1985-2018), this SDM predicted monthly distributions for a typical year in the North-East Atlantic (Waggitt et al, 2020) and Scottish waters (Searle et al. 2019), respectively.
In this project, we have extended this SDM framework to predict seabird distributions for a specific month and year, in both current and future scenarios (e.g. Evans and Waggitt 2019). To do so, we replaced the averaged environmental variables with corresponding concurrent environmental variables. Influential climatic indices including the North Atlantic Oscillation (NAO) and Atlantic Multi-decadal Oscillation (AMO) were also included. These climatic indices describe regional-scale meteorological and oceanographic conditions (e.g. wind events, storm events, precipitation). Because species responses to physical changes can be complex, the SDMs we have developed include interactive terms between environmental variables. For example, previous work on marine mammals has demonstrated that harbour porpoise Phocoena phocoena concentrations have moved from the northern North Sea (NNS) to the southern North Sea (SNS) in recent decades (Hammond et al. 2013). However, using concurrent temperature alone will not detect these profound changes, because animals have moved from the cool-water NNS to the warm-water SNS. Importantly, using an interaction between annual temperature and AMO will detect these changes; increasing AMO has likely caused declines in cool-water prey in the NNS, encouraging animals to exploit warm-water prey in the SNS.
Overview
Predictions of distributions under previous (1969-1990), current (2017) and future scenarios (2070-2099) were based on GEE-GLM approaches developed in Waggitt et al. (2020). GEE-GLMs use a hurdle-model approach divided into a presence-absence and density component. The presence-absence component uses relationships between a species presence and environmental conditions to predict spatio-temporal variations in the probability of encountering a species. The density component then uses relationships between numbers of individuals and environmental conditions to predict the density of a species if encountered. The final predicted density of a species is the product of these two components. These components are parameterised using sightings of seabirds from at-sea aerial and vessel surveys. Further details on GEE-GLM setup and associated data are provided in Waggitt et al. (2020). However, several changes were implemented to adapt the GEE-GLM for predictions across scenarios. These changes are discussed in detail in the following sections.
At-Sea Aerial and Vessel Surveys
Because of data-sharing constraints associated with some of the survey data used in Waggitt et al (2020), GEE-GLM parameterisation only used freely-available subsets of this collation. This subset included the data used in Bradbury et al. (2014) (ESAS and WWT), and additional data provided by Marine Scotland Science (MSS) and Natural England (NE).
Environmental Variables
Original GEE-GLM were developed to predict monthly (January – December) variations in densities in a typical year across several decades (1980-2018). Because of these aims, original GEE-GLM were parameterised using average environmental variables across this time period. Environmental variables were divided into spatial and temporal components. The spatial components were quantified per grid cell and consisted of colony indices, breeding season, depth, average temperature and temperature variance across the study period (1980-2018), seabed roughness and front intensity; the temporal components were quantified per month (January – December) and consisted of mean temperature across the study region (NE Atlantic). Variables anticipated to influence the overall range of a species were included in the presence-absence model, namely, colony indices, breeding season, depth, average temperature and regional temperature. An interactive term between regional temperature and depth/average temperature/temperature variance was included, capturing seasonal movements across environmental gradients i.e. between deep and shallow water, higher and lower latitudes. Variables anticipated to cause aggregation within the overall range of a species were included in the density model, specifically, seabed roughness and front intensity.
To predict spatial variations in densities across scenarios (past, present, future), average temperatures and temperature variance across the overall survey period (1980-2015) were replaced with average temperatures in the five years preceding the survey in question. Regional temperatures were retained as previously, because their role was to represent seasonal cycles (relative increases and decreases across months) rather than absolute temperatures per-se. In addition, the collinearity between average and regional temperatures could exaggerate trends in species presence linked to increasing or decreasing temperatures. The replacement of annual temperatures across the overall survey period with those of the five years preceding the survey period should better identify thermal associations of species, improving the ability of GEE-GLM to predict across scenarios. In all instances, sea surface temperatures rather than average temperatures in the upper 150m of the water column were used because HadRM3 scenarios only provided the former (Hadley Centre for Climate Prediction and Research, 2008).
Because of their known influence on seabird ecology, climatic indices (North Atlantic Oscillation and Atlantic Multidecadal Oscillation) were tested (Mitchell et al., 2020). Specifically, interactive terms between climatic indices and annual temperature/depth were included to capture any movement of populations between the northern and southern North Sea in response to associated conditions. In a previous analysis using GEE-GLM approaches (Waggitt et al, unpublished), these interactions successfully detected well-documented shifts in harbour porpoise from the northern to the southern North Sea in the late 1990s (see, for example, Hammond et al., 2013). Whilst initially successful in the current analyses, additional scrutiny of analysis and outputs revealed that model parameters were particularly sensitive to model-setup and data input. Moreover, predicted densities were unrealistically high for some species, suggesting that model parameters exaggerated interactions between climatic indices and annual temperature/depth. Therefore, climatic indices were omitted from GEE-GLM. Consequently, predictions only consider the thermal associations of each species and do not consider potential movements between the northern and southern North Sea in response to conditions associated with these climatic indices.
Platform-type (vessel versus plane) was included alongside environmental variables. The GEE component of GEE-GLM accounts for correlations in encounter rate and densities amongst surveys from the same supplier in the same month, whereas detection functions account for differences in the area covered (km2) from different platforms and sea states. However, some important differences in animal behaviour and associated consequences on survey data were not accounted for in the original GEE-GLM. Specifically, detections of scavenging species (northern gannet and Laridae) will be intrinsically higher from vessels due to animal attraction; detections of pursuit-diving species (Alcidae) could also be higher because slower moving vessels have a lower minute per km2 coverage. As vessel surveys have largely been replaced by aerial surveys in recent times, not accounting for these differences may produce misleading model parameters. Including platform-type as a categorical variable helped account for differences between vessels and planes.
In addition to the changes required for GEE-GLM to predict across scenarios, front intensity was replaced with the Simpson-Hunter stratification index (HU3: Simpson and Sharples, 2012). This index combines measurements of mean current speeds (ms-1) and depth (m) into a single measurement which identifies mixed (<1.9), frontal (~1.9), and stratified (>1.9) water columns. This index not only has a strong influence on seabird distributions at regional scales (<100km2) in shelf-seas (Scott et al., 2010, Cox et al., 2013, Waggitt et al., 2018) but identifies a greater range of associations than front intensity when modelled as a quadratic term, i.e. associated with mixed, frontal or stratified water. The Simpson-Hunter stratification index was modelled as a quadratic and continuous variable. All processing was performed in the 'raster' package in R.
| Name | Type | Scale | Description |
|---|---|---|---|
| Platform | Temporal | Survey | Whether a survey was performed from a vessel or plane. |
| Colony Index | Spatiotemporal | Grid Cell | Location of colonies, weighted by their population and breeding season+. |
| Breeding Season | Temporal | Regional | Non-breeding (0), pre/post (0.5) or breeding season (1) +. |
| Depth | Spatial | Grid Cell | Seabed Depth (m) |
| Annual Temperature Variance | Spatiotemporal | Grid Cell | Variation on sea surface temperature over the preceding five years. |
| Annual Temperature | Spatiotemporal | Grid Cell | Mean sea surface temperature over the preceding 5 years. |
| Regional Temperature | Temporal | Regional | Mean sea surface temperature for that month (1961-2099). |
| Seabed Roughness | Spatial | Grid Cell | Terrain Ruggedness Index (TRI) identifying topographic features. |
| Simpson-Hunter Stratification Index | Spatial | Grid Cell | Discriminates between water columns likely to mix or stratify. |
*For species specific breeding seasons see Table 5
Model Selection
As in Waggitt et al. (2020), forwards-model selection based on the Quasilikelihood Information Criteria (QIC) was performed for the presence model. Following the inclusion of platform as an environmental variable, forwards-model selection was also performed for the density model. Environmental variables were introduced in a scale-dependent manner, starting with those deemed to have the greatest and ending on those deemed to have the lowest influence at the North-East Atlantic scale. Table 8 summarises the forwards-model selection.
Table 8. Summary of the forwards-model selection used for the presence and density model. 2 = Quadratic Term; * = Interactive Term.
Presence Model
Stage 1
Platform
Stage 2
Colony Index
Breeding Season
Colony Index + Breeding Season
Stage 3
Depth2
Depth2 + Annual Temperature Variance
Stage 4
Annual Temperature2
Annual Temperature2 + Regional Temperature * Annual Temperature
Annual Temperature2 + Regional Temperature * Depth
Annual Temperature2 + Regional Temperature * Annual Temperature Variance
Density Model
Stage 1
Platform
Stage 2
Seabed Roughness
Simpson-Hunter Stratification Index2
Seabed Roughness + Simpson Hunter Stratification Index2
Nested Models
Whilst this study focused on the North Sea region, the presence-absence component used data from across the North-East Atlantic (see Waggitt et al., 2020). The inclusion of data outside the North Sea improved the likelihood of GEE-GLM parameters identifying a species' overall thermal association. For instance, if a species was prevalent throughout the North Sea then GEE-GLM focused on this area would identify weak or absent thermal associations, underestimating responses to changing temperatures. Conversely, if a widespread species was concentrated in certain parts of the North Sea then such GEE-GLM would identify strong thermal associations, overestimating responses to changing temperatures. However, the density model only used data from inside the North Sea. The focus on data in the North Sea should increase the accuracy of GEE-GLM parameters identifying important habitats within this region, which could contrast those in neighbouring regions (Celtic Sea, English Channel, Hebrides) due to differences in prey communities and associated foraging strategies.
The presence-absence component was performed at 10 km resolution whilst the density component was performed at 2.5 km resolution. These differences in resolution were due to computing power, as processing and analysing data at 2.5 km resolution across the NE Atlantic was not possible. However, the broad-scale environmental variables included in the presence-absence model do not differ greatly in a 10 x 10 km cell. Therefore, thermal associations identified at 10 km resolution are suitable for prediction at 2.5 km resolution.
Predictions
GEE-GLM predictions of species densities (animals per km2, modelled separately for each species) were made at 2.5 km and monthly resolution for each scenario (1961-1990, 2017, 2070-2099). A population estimate was then produced by estimating numbers of animals in each cell and summing estimations across all cells. The influence of breeding colonies was omitted from predictions because the relative size and absolute locations of nesting aggregations could change substantially across a 140 year period (1961-2099). Retaining their influence could cause misleading and irregular patterns in predictions; for instance, high densities around breeding colonies in habitats suitable now but perhaps not suitable in the future. Despite their omission, GEE-GLM predictions from present scenarios (2017) appeared accurate, with the highest densities centred on regions currently supporting large breeding colonies. These predictions suggest that accurate and appropriate environmental associations had been identified. Finally, predictions were based on measured densities from vessels rather than planes because population estimates from the latter were unrealistically low in comparison to published estimates from breeding colonies obtained from national seabird censuses (Mitchell et al., 2004). If we assume that estimates from breeding colonies are broadly correct, this adjustment suggests that measurements from vessel-based surveys provide more representative measurements of densities. However, measurements from aerial-based surveys were not adjusted for availability bias in diving seabirds (Alcidae, northern gannets), which could be underwater in the short-period that a plane is overhead. Accounting for these biases would provide more accurate densities, although this requires further information on dive-times of birds and time-in-area of surveys.
Statistical models for effects of climate on demographics
The basic structure of our statistical modelling was to assume that productivity, annual growth rate and adult survival are each related to a range of annual, colony-specific climate variables. We constructed separate models for each species.
Models for productivity and population growth rate
We assumed that productivity and population growth rate were each related to climate via generalized linear mixed models (GLMMs). GLMMs are very widely used in statistical ecology (Bolker et al., 2009), and provide a natural framework for modelling the relationship between multi-site and multi-year count data and explanatory variables (such as climate variables).
Productivity relates to the number of chicks fledged, relative to the number of nests. Random variation in the number of chicks fledged (demographic stochasticity) can either be modelled using a Poisson distribution, with log(number of nests * maximum brood size) as an offset term, or modelled as a binomial distribution with the number of nests multiplied by maximum brood size as the binomial denominator. These two modelling approaches are conceptually similar: both model the ratio (expected productivity = expected number of chicks / (number of nests * maximum brood size)), but they differ in whether they constrain this ratio to be less than or equal to one (the binomial) or impose no upper limit (the Poisson). Equivalently, the difference between the two approaches is that they either impose an absolute upper limit upon brood size (the binomial) or they do not (the Poisson). Because maximum brood size for the species used in this analysis is biologically unambiguous, we only considered the binomial model.
The binomial GLMM implemented assumed that the logit of expected productivity was a linear function of a range of climate variables, but also depended upon "random effects" – sources of unexplained, but structured, variation not accounted for in fixed effects ("environmental stochasticity"). We considered random effects for "site", "year" and the interaction of "site" and "year" within all of our models, to account for the spatial and temporal variation in productivity unrelated to the climate variables used within our models.
We estimated the impacts of climate variables upon population annual growth rate (which incorporates productivity, adult survival and juvenile survival) using abundance data. Specifically, we used a Poisson GLMM to model abundance (count), with the log of (count) in the previous year being an offset, and included the same explanatory variables and random effects as in the models for productivity. The inclusion of the offset means that this model is equivalent to modelling the log of the growth rate between this year and the previous year.
Inference: parameter estimation and uncertainty
We fitted the models as generalised linear mixed models (GLMMs) via maximum likelihood, using the glmer function within lme4 package for R (Bates et al, 2015). The model for productivity can be fitted directly to the nest monitoring data, and this model allowed us to estimate the productivity rate for each colony in each year. The model for growth rate can, similarly, be fitted directly to data on abundance (colony counts), and this model allowed us to estimate the growth rate for each colony in each year.
Alternative approach via Bayesian inference
We also considered the use of Bayesian inference for fitting each of the models, as an alternative to the more standard non-Bayesian approach. There is a long-standing and complex philosophical argument about the validity and interpretation of Bayesian and non-Bayesian approaches to statistical inference. The key advantage in this context, however, is that the Bayesian approach is able to more comprehensively account for uncertainty – in particular, it enables the uncertainty involved in estimating random effect variances in the GLMMs to be accounted for, whilst the non-Bayesian approach does not.
Given the computational demands of the Bayesian approach we used the non-Bayesian approach for exploratory analyses (which involve fitting a large number of models, and so were infeasible in this project using the Bayesian approach), and only refit the "final" sets of models for each species using the Bayesian approach. We fitted the models using JAGS (Plummer 2003), a widely-used and flexible environment for statistical modelling via Bayesian inference. We called JAGS from within R using the jagsUI package (Kellner 2017). The full JAGS code for our models can be found in Appendix E.
Model selection
For each species, we decided upon the set of climate variables to consider, in relation to productivity, adult survival and trend, based upon biological judgement and the existing literature. This approach reduced the dangers of "data dredging", avoiding the practical and conceptual difficulties associated with automated model selection, and was the only feasible approach for a project of this timescale. Model selection was performed in the non-Bayesian context (using GLMMs), and was run in a forward selection manner, using categories of climate variables. All models considered four marine climate variables identified as being of relevance to seabird productivity and survival (NAO, AMO, sea surface temperature and sea surface salinity); note that we were able to include the additional marine climate variable, AMO, because non-identifiability is less problematic within the Bayesian framework. We then tested whether support in the data for each model was improved by adding terrestrial climate variables for summed precipitation and mean minimum temperature. If the addition of terrestrial climate variables improved support in the data (assessed using AIC), then both variables were retained in the model, otherwise both were dropped. Finally, we tested whether adding terrestrial mean wind speed improved model fit, and if so, this variable was retained within the final model for each demographic rate and species. The order of this categorical selection was in response to the strength and importance of previously demonstrated links between seabird demography and marine, terrestrial and terrestrial wind variables. This selection process resulted in final models either including:
- Marine climate variables only
- Marine and terrestrial climate variables
- Marine climate variables plus terrestrial wind
- Marine and terrestrial climate variables plus terrestrial wind
At all stages of model selection we also assessed support in the data for alternative seasonal periods over which climate variables were derived. These were:
- Productivity:
- Pre-breeding period only
- Breeding season only
- Pre-breeding plus breeding season periods
- Adult survival
- Non-breeding period
- Whole year
- Population growth rate models
- All seasonal periods defined above
This resulted in a final best supported model for population growth rate and productivity in each species, defined by a set of climate variables, over a selected seasonal period. We also always assessed support in the data for a null model containing no climate variables.
Goodness of fit assessment
We assess goodness of fit using the marginal R-squared value for GLMMs proposed by Nakagawa & Schielzeth (2012). This value can be calculated from the fitted models using a simple formula (Equation 29 in the reference), which defines the marginal R-squared for a GLMM to be:
Marginal GLMM R-square =
(Variance of predictions from fixed effect part of the model) /
(Variance of predictions from fixed effect part of the model + Sum of random effect variances + Variance from overdispersion + Distribution-specific variance)
We calculate this using the r.squaredGLMM function in the MuMin package (Barton 2017). Nakagawa & Schielzeth (2012) also define another quantity, the conditional R-squared, which also includes the sum of random effect variances in the numerator. The conditional R-squared will always be higher than, or equal to, the marginal R-squared, but in situations where, as here, the random effects are essentially nuisance variables and it is the fixed effects (the climate variables in this context) that are of primary interest, the marginal R-square value will be of much more practical relevance than the conditional R-square value. In this context, the marginal R-square value effectively provides information on the proportion of variation in the raw data that can be explained by the climate variables.
Predicting demography and abundance under climate change
The models that we have developed allowed productivity and annual population growth rate to be readily predicted under a future scenario of climate change, so long as annual projections of all environmental variables (whether terrestrial or marine) used in fitting the models are available for the scenario(s) and future year(s) of interest.
Within the Bayesian context the uncertainty within these predictions can also be fully quantified in a straightforward way, simply by generating predictions separately for each MCMC sample, and then using the results sample of predicted values to represent uncertainty in the predictions.
Some elements of uncertainty quantification are also straightforward in the non-Bayesian context: the uncertainties resulting from inter-annual variability and uncertainty in estimating the direction/magnitude of the environmental effects can both be readily accounted for via a simple simulation-based approach, but other elements of uncertainty quantification (e.g. uncertainty in the level of inter-annual or inter-colony variation) are more problematic, and were not considered here.
Accounting for adaptation
Our methodology assumed that birds do not adapt to change in their environment; in reality, adaptation is likely to occur, in situations where successful adaptation mitigates against the demographic consequences of environmental change. One obvious adaptation strategy for breeding seabirds is to increase their foraging range, providing a potential mechanism for birds to track climate-driven shifts in foraging areas.
Using the outputs of our models we estimated the direct demographic consequences of birds increasing their foraging range, to assess whether increasing their foraging ranges could lead them to avoid any negative consequences of climate change on demographic rates. We did this by generating predictions under a range of possible future foraging ranges, and estimating how predicted productivity and population growth rate varied as the foraging range increased, changing the foraging range changes the distance decay parameter used in estimating the weighted mean of the marine climate variables.
Ultimately, decisions regarding adaptation depend upon whether the benefits outweigh the cost; this is a difficult question to answer, as the costs and benefits refer to different quantities, which cannot be readily translated into each other, and a quantification of the optimal decisions that birds make in trading off between costs and benefits is beyond the scope of this project.
Note that the foraging ranges used here from Thaxter et al. (2012) are generally lower than the updated values in Woodward et al. (2019), which were not available for this analysis. As such, our analysis may overestimate the capacity to expand foraging range.
Models for survival
The population growth rate depends upon productivity and survival, both of adults and of juveniles. If it is possible to examine the effects of climate variables upon productivity and growth rate it should, therefore, also be possible to quantify their effects upon survival. We attempted this, using the two sources of data used in the main analyses (colony counts and nest monitoring data), because insufficient direct data on survival (e.g., mark-recapture) are available to be able to run a multi-colony analysis of climate effects. Data issues mean that the results should be interpreted with caution, however, so we relegate the methodology and results to Appendix C.
Contact
Email: ScotMER@gov.scot