
Shaping the Future: Strengthening Scotland's education system through empowered schools
Final report of the Independent Professional Advisor on future school reform in Scotland, with a focus on improvement, funding and governance.
Appendix A - Metrics of Success for Scottish Education
An evaluation of the Scottish education system is conducted through a multi-layered approach that includes national frameworks, international benchmarking, and school-based self-evaluation and inspection evidence.
There is no universally agreed and shared understanding or language of what success in education looks like. There are a number of metrics of success used across Scotland to evaluate the Scottish education system that include How Good Is Our School (HGIOS), How Good Is Our Local Authority (HGIOLA), Local Government Benchmarking Framework (LGBF), National Performance Framework (NPF), and National Improvement Framework (NIF).
Attainment data in terms of Achievement of Curriculum for Excellence Levels (ACEL) for literacy and numeracy, qualifications at identified Scottish Certification and Qualifications Framework (SCQF) levels, and positive destinations data are the only metrics that appear on all measurement frameworks. There is a recognition and move towards greater alignment between National Improvement Framework measures and the Local Government Benchmarking Framework.
National Performance Framework
The National Performance Framework (NPF) is Scotland’s wellbeing framework and measures Scotland's progress against 11 National Outcomes (including education) that articulate the kind of country the Scottish Government would like Scotland to be.
To help understand Scotland’s progress in relation to the NPF Outcomes, performance is measured using 81 indicators. The indicators help to simplify a complex array of statistical measures and get a sense of the overall direction of the NPF and whether each indicator’s performance is improving, maintaining, or worsening. However, it should be noted that, as of 5 March 2025, of the 81 National indicators there is no data for 17 (with notable gaps in education).
Of the 70 indicators where performance can be measured:
- 35 show performance maintaining
- 21 show performance improving
- 14 show performance worsening
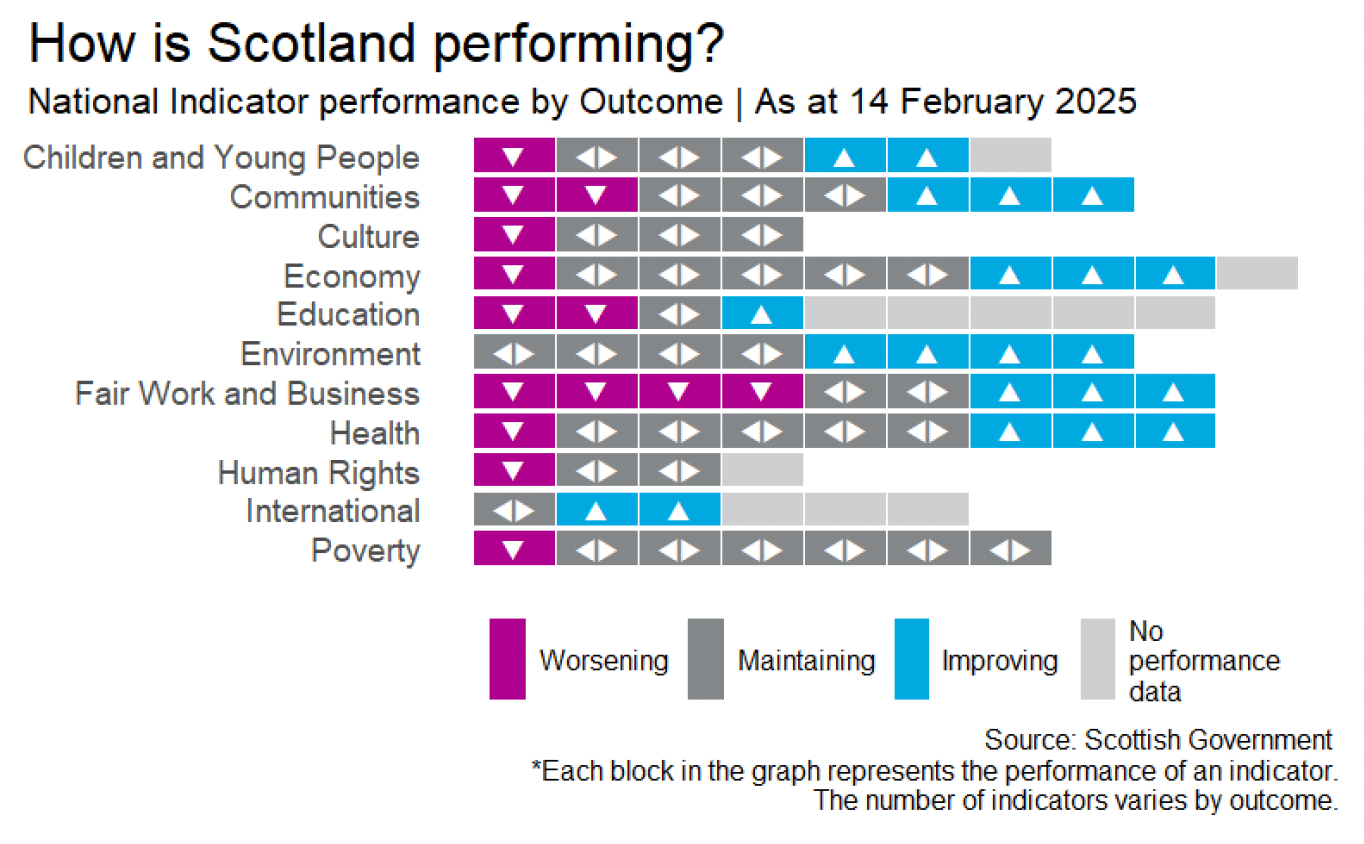
For the National Outcome on Education, the National Indicators and its sub measures include:
| National Indicator | Sub measures | Progress over time(5 years) |
|---|---|---|
| 1. Educational attainment |
|
Performance improving |
|
Performance improving | |
|
Performance improving | |
|
Performance improving | |
|
Performance Worsening | |
|
Performance Worsening | |
|
Performance Worsening | |
| 2. Confidence of children and young people | This indicator is in development which means we do not yet have data to report for this indicator | No performance data |
| 3. Resilience of children and young people | This indicator is in development which means we do not yet have data to report for this indicator | No performance data |
| 4. Workplace learning | The percentage of employees who received on the job training in the last 3 months. Source: Annual Population Survey (APS) [ARCHIVED CONTENT] Work place Learning | National Performance Framework | Performance improving |
| 5. Engagement in extra-curricular activities | This indicator is in development which means we do not yet have data to report for this indicator | No performance data |
| 6. Young people’s participation | Percentage of young adults (16–19-year-olds) participating in education, training or employment | No performance data |
| 7. Skills profile of the population | Proportion of adults aged 16-64 with low or no qualifications at SCQF level 4 or below | Performance Maintaining |
| 8. Skills shortage vacancies | Proportion of establishments reporting at least one Skills Shortage Vacancies (SSV) i.e. vacancies which are reported to be hard to-fill because applicants lack relevant skills, qualifications or experience. Source: Employer Skills Survey (ESS) [ARCHIVED CONTENT] Skill Shortage Vacancies | National Performance Framework | Performance Worsening |
| 9. Skills underutilisation | Proportion of establishments with at least one employee with skills and qualifications more advanced than required for their current job role. Source: Employer Skills Survey (ESS) [ARCHIVED CONTENT] Skill Underutilisation | National Performance Framework | Performance Worsening |
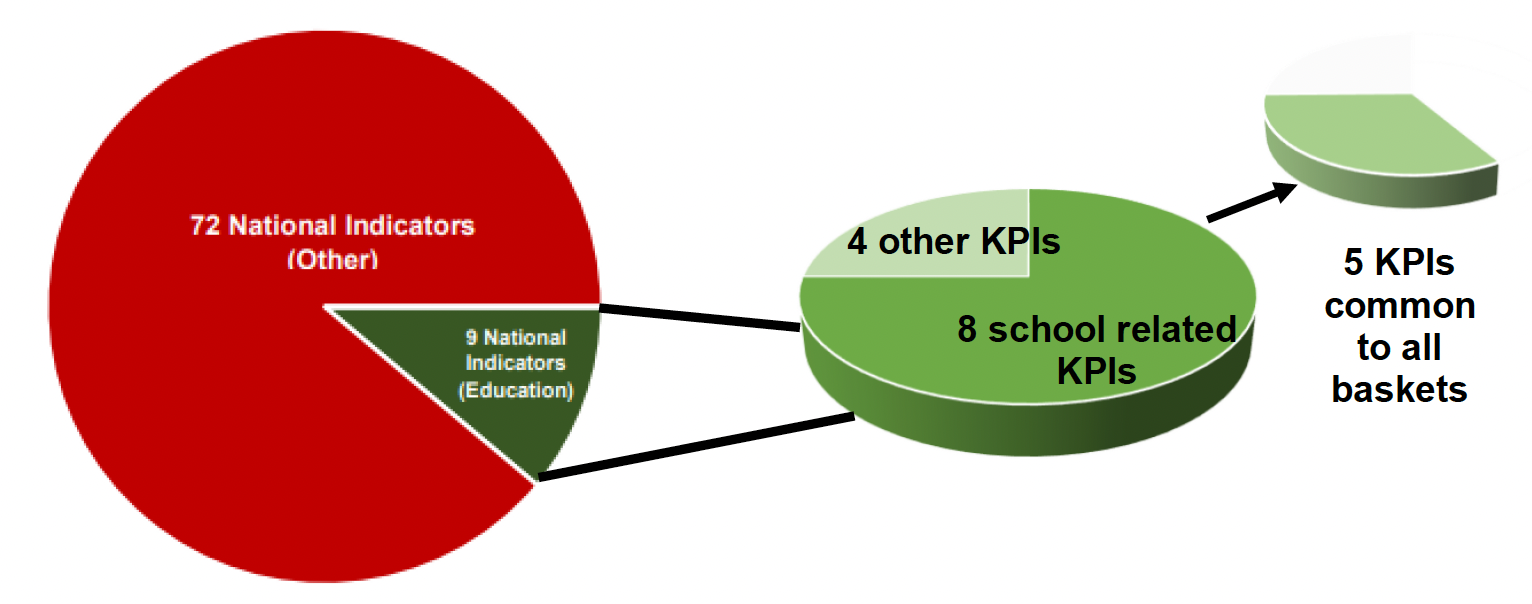
A few indicators from the National Performance Framework are aligned to education. From these national indicators, there are 12 performance indicators with 8 specifically related to school performance. All these indicators are outcome indicators i.e. they do not make reference to inputs such as leadership or learning, teaching and assessment.
Following the latest statutory review of the National Outcomes, and the subsequent Scottish Parliament inquiry, the Scottish Government has committed to a period of reform of National Performance Framework to support the development and implementation of a more strategic and impactful framework for Scotland.
It will be imperative for the Government to choose relevant and quantifiable Indicators which allow the proposed Outcomes to be effectively measured and scrutinised. This allows for the Government, Parliament, and the public to understand whether the initiatives put forward by the Government are effective.
National Improvement Framework
The National Improvement Framework (NIF) is the primary tool for evaluating
the performance of the school system. It focuses on five key priorities: placing human rights at the centre of education; improvement in attainment (specifically literacy and numeracy); closing the poverty-related attainment gap; improvement in children’s health and wellbeing; and improvement in employability skills and positive destinations for school leavers.
There are 16 key measures for the NIF with 190 specific measures[85] across the seven outcomes. These are all outcome measures:
Of the 16 measures there are 14 where multiple years of data are available, 5 measures that show an improvement over time since 2019/20 and 9 that show a decline or no consistent pattern of improvement. Of the 14 measures where multiple years of data are available, there has broadly been a narrowing of the gap in 6 of the measures, and a widening of the gap in 8 of the measures over time in the latest year of data.
| Metric | Progress over time (5 years) | Progress in latest year |
|---|---|---|
| 1. Percentage of children reviewed who had no concerns about any aspects of their development at their 27–30-month review | No consistent Improvement (fluctuating trend) | Improvement in latest year
|
| 2. Percentage of children (aged 4-12 years) with a Total Strength and Difficulties Score of 14 or more (slightly raised, high or very high) | Deterioration | Deterioration in latest year
|
| 3. Mean Warwick-Edinburgh Mental Wellbeing Scale (WEMWBS) scores for 13–15-year-olds | - | Changed measure: new measure based on the Scottish Health Survey: (WEMWBS). Only one data point is available for Mean WEMWBS scores for 13–15-year-olds so analysis of progress over time is not available for this measure |
| 4. Percentage of P1, P4 and P7 pupils (combined) achieving expected CfE Levels for Literacy | Improvement | Improvement
|
| 5. Percentage of S3 pupils achieving CfE Third Level or better for Literacy | Improvement | Improvement
|
| 6. Percentage of P1, P4 and P7 pupils (combined) achieving expected CfE Levels for Numeracy | Improvement | Improvement
|
| 7. Percentage of S3 pupils achieving CfE Third Level or better for Numeracy | Improvement | Improvement
|
| 8. Percentage of secondary school leavers achieving one or more passes in National Qualifications at SCQF L4 or better | No consistent Improvement (fluctuating trend) | Deterioration
|
| 9. Percentage of secondary school leavers achieving one or more passes in National Qualifications at SCQF L5 or better | Deterioration | Deterioration
|
| 10. Percentage of secondary school leavers achieving one or more passes in National Qualifications at SCQF L6 or better | Deterioration | Deterioration
|
| 11. New Percentage of senior phase secondary school leavers achieving five or more passes at SCQF L4 or better under all SCQF measure | Deterioration | New measure to better align those reported in the NIF and the LGBF Deterioration
|
| 12. New Percentage of senior phase secondary school leavers achieving five or more passes at SCQF L5 or better under all SCQF measure | Deterioration | New measure to better align those reported in the NIF and the LGBF Deterioration
|
| 13. New Percentage of senior phase secondary school leavers achieving five or more passes at SCQF L6 or better under all SCQF measure | No consistent Improvement (fluctuating trend) | New measure to better align those reported in the NIF and the LGBF Mixed
|
| 14. Percentage of 16–19-year-olds participating in Education, Training or Employment | - | HM Revenue and Customs (HMRC) data was included within the 2025 Annual Participation Measure (APM) dataset for the first time. This created a change in the participation measure data which means comparisons to previous years cannot be made on a like for like basis. Therefore, for NIF reporting purposes, 2025 is the new baseline for this measure and analysis of progress over time is not available. The full time series is available in the Annual Participation Measure statistics however comparisons to previous years should be interpreted with care due to the absence of HMRC data in previous years.
|
| 15. Percentage of secondary school leavers in a positive initial destination | Improvement overall | Deterioration
|
| 16. Percentage attendance across all schools | No consistent Improvement (fluctuating trend) | Improvement
|
The 27–30-month review measure has been updated to better align with the Local Government Benchmarking Framework (LGBF). It now includes children with no concerns plus those with no concerns but some incomplete domains. The calculation also changes from “all children” to “children reviewed.” Three new attainment measures under the All SCQF measure have been added to better align those reported in the NIF and the LGBF. These look at the percentage of senior phase school leavers achieving five or more passes at SCQF Levels 4 or better, 5 or better, and 6 or better. These measures provide a broader picture of attainment, including a wider range of awards.
Local Government Benchmarking Framework
The Local Government Benchmarking Framework (LGBF) is a high-level
benchmarking tool designed to help senior management teams and elected members ask questions about key council services. It reflects a commitment by SOLACE (Scotland) and COSLA to develop better measurement and comparable data in order to help councils improve services, target resources to areas of greatest impact and enhance public accountability.
There are 108 indicators organised across nine key themes of: adult social
care, children’s services, corporate services, culture and leisure services, economic development and planning, environmental services, financial sustainability, housing, and tackling climate change.
The education measures in the Scottish Local Government Benchmarking Framework (LGBF) are primarily found within the Children's Services category, focusing on school attainment, costs, and pupil wellbeing. These measures are designed to help Scottish local authorities compare performance and drive improvement.
The key education performance indicators (PIs) generally cover the following areas:
Attainment and Achievement
- Broad General Education (BGE):
- Percentage of P1, P4, and P7 pupils combined achieving the expected Curriculum for Excellence (CfE) level in literacy and numeracy
- The attainment gap in literacy and numeracy for P1, P4, P7 combined between the least deprived and most deprived pupils.
- Senior Phase Education:
- Percentage of pupils gaining 5 or more awards at SCQF Level 5
- Percentage of pupils gaining 5 or more awards at SCQF Level 6
- Attainment in the context of deprivation: Percentage of pupils from the most deprived areas (SIMD) gaining 5 or more awards at SCQF level 5 and 6
- Overall average total tariff scores for each quintile
- Leaver Destinations: Percentage of pupils entering positive destinations and participation rate for 16–19-year-olds
Cost and Efficiency
- Cost per primary school pupil: total expenditure divided by the number of pupils
- Cost per secondary school pupil: Total expenditure divided by the number of pupils
- Cost per pre-school education place
School Environment and Well-being
- Attendance Rates: Overall school attendance rates
- Looked After Children (LAC) Attendance: Attendance rates for children looked after in the community
- Exclusion Rates: Number of exclusions per 1,000 pupils
- Looked After Children (LAC) Placements: Percentage of Looked After Children with more than one placement in the last year
- Percentage of adults satisfied with local schools.
Early Learning and Childcare (ELC)
- Percentage of funded early years provision which is graded "good" or better
- Percentage of children meeting developmental milestones
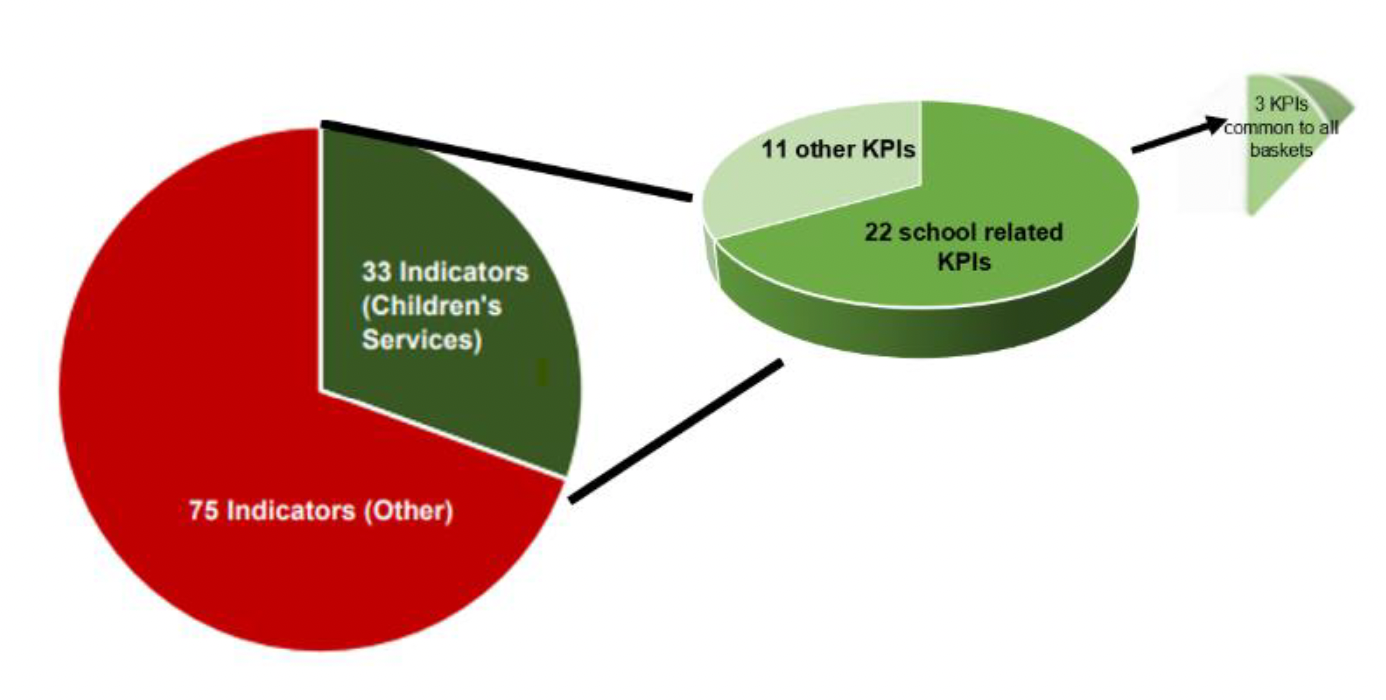
Around a third of the indicators from the LGBF are dedicated to Children’s Services. From these 33 performance indicators are set with 22 specifically related to school performance. Almost all of these indicators are outcome indicators i.e. there is no reference to inputs such as leadership or learning, teaching and assessment bar costs associated with education.
Standardised and Professional Assessment
Across the national performance frameworks, LGBF and inspection evidence,
there is a reliance on Insight measures primarily drawn from SQA National Qualifications at National 5, Highers, and Advanced Highers. Annual pass rates and attainment statistics serve as a critical measure for secondary education performance. In addition, across the Broad General Education Achievement of Curriculum for Excellence (ACEL) data, based on teacher professional judgment, tracks the proportion of primary and secondary pupils achieving expected levels in literacy and numeracy.
HMI Inspections
| Gradings | 1.3 | 2.3 | 3.1 | 3.2 |
|---|---|---|---|---|
| Unsatisfactory | 0 | 0 | 0 | 0 |
| Weak | 11 | 18 | 8 | 15 |
| Satisfactory | 18 | 39 | 14 | 46 |
| Good | 31 | 100 | 34 | 94 |
| Very Good | 34 | 38 | 38 | 41 |
| Excellent | 2 | 1 | 2 | 0 |
| Totals | 96 | 196 | 96 | 196 |
| Gradings | 1.3 | 2.3 | 3.1 | 3.2 |
|---|---|---|---|---|
| Unsatisfactory | 0 | 0 | 1 | 0 |
| Weak | 16 | 15 | 3 | 18 |
| Satisfactory | 14 | 43 | 21 | 46 |
| Good | 32 | 102 | 35 | 92 |
| Very Good | 33 | 37 | 36 | 40 |
| Excellent | 1 | 1 | 0 | 2 |
| Totals | 96 | 198 | 96 | 198 |
| Gradings | 1.3 | 2.3 | 3.1 | 3.2 |
|---|---|---|---|---|
| Unsatisfactory | 2 | 1 | 2 | 2 |
| Weak | 6 | 12 | 4 | 11 |
| Satisfactory | 24 | 42 | 15 | 45 |
| Good | 30 | 102 | 34 | 96 |
| Very Good | 31 | 38 | 38 | 42 |
| Excellent | 3 | 1 | 3 | 0 |
| Totals | 96 | 196 | 96 | 196 |
For the primary sector over the last three years, for QI 1.3 Leadership of change: the majority of schools were evaluated as good, very good or excellent (most as satisfactory or better). QI 2.3 Learning, teaching and assessment: the majority were evaluated as good, very good or excellent (almost all as satisfactory or better). QI 3.1 Ensuring wellbeing, equality and inclusion: most schools were evaluated as good, very good or excellent (almost all as satisfactory or better). QI 3.2 Raising attainment and achievement: the majority were evaluated as good, very good or excellent (most as satisfactory or better).
HM Inspectors undertook 113 individual school inspections across secondary schools (including all throughs) between 2022-23 to 2024-2025. This includes public funded schools.
| Gradings | 1.3 | 2.3 | 3.1 | 3.2 |
|---|---|---|---|---|
| Unsatisfactory | 1 | 1 | 1 | 2 |
| Weak | 1 | 2 | 2 | 3 |
| Satisfactory | 5 | 12 | 4 | 8 |
| Good | 5 | 16 | 7 | 19 |
| Very Good | 4 | 6 | 2 | 4 |
| Excellent | 2 | 0 | 2 | 1 |
| Totals | 18 | 37 | 18 | 37 |
| Gradings | 1.3 | 2.3 | 3.1 | 3.2 |
|---|---|---|---|---|
| Unsatisfactory | 0 | 0 | 0 | 0 |
| Weak | 3 | 6 | 3 | 6 |
| Satisfactory | 4 | 13 | 5 | 10 |
| Good | 5 | 10 | 4 | 14 |
| Very Good | 6 | 9 | 6 | 8 |
| Excellent | 1 | 0 | 1 | 0 |
| Totals | 19 | 38 | 19 | 38 |
| Gradings | 1.3 | 2.3 | 3.1 | 3.2 |
|---|---|---|---|---|
| Unsatisfactory | 0 | 0 | 1 | 1 |
| Weak | 7 | 4 | 2 | 10 |
| Satisfactory | 3 | 14 | 6 | 8 |
| Good | 7 | 14 | 8 | 13 |
| Very Good | 2 | 5 | 2 | 4 |
| Excellent | 0 | 1 | 0 | 2 |
| Totals | 19 | 38 | 19 | 38 |
For the secondary sector over the last three years, for QI 1.3 Leadership of change: the majority of schools were evaluated as good, very good or excellent (most as satisfactory or better) with the exception of the latest year. QI 2.3 Learning, teaching and assessment: the majority were evaluated as good, very good or excellent (most are as satisfactory or better). QI 3.1 Ensuring wellbeing, equality and inclusion: majority of schools were evaluated as good, very good or excellent (most are as satisfactory or better). QI 3.2 Raising attainment and achievement: the majority were evaluated as good, very good or excellent (majority as satisfactory or better).
| Year | Total number of inspections | Schools requiring further inspection | Proportion of further inspections from sample |
|---|---|---|---|
| 2016-17 | 18 full models | 7 full models (41% of sample) | 41% |
| 2017-18 | 19 full models | 4 full models (21% of sample) | 21% |
| 2018-19 | 27 (19 FM / 8 SM) | 2 full models (10% of sample) and 1 short (12.5% of sample) | 11% |
| 2019-20 | 32 (17 FM / 15 SM) | 4 full models (24% of sample) and 2 short model (13% of sample) | 18% |
| 2020-21 | No routine inspections | No routine inspections | No routine inspections |
| 2021-22 | No routine inspections | No routine inspections | No routine inspections |
| 2022-23 | 37 (18 FM / 19 SM) | 3 full models (17% of sample) and 4 short models (21%) | 19% |
| 2023-24 | 38 (19 FM / 19 SM) | 5 full models (26% of sample) and 5 short models (26%) | 26% |
| 2024-25 | 38 (19 FM / 19 SM) | 10 full models (52% of sample) and 5 short models (26%) | 39% |
In 2022-23, there were 7 schools subject to a further inspection i.e. 1 in 5 schools inspected during that period. In 2023-24, there were 10 schools subject to a further inspection i.e. 1 in 4 and last session during 2024-2025, there were 15 schools subject to a further inspection i.e. just over 1 in 3.
There is ongoing work by the Inspectorate to develop a quality improvement
framework for the inspection of local authorities.
External Evaluations
The Organisation for Economic Co-operation and Development Organisation
(OECD) review of the Curriculum for Excellence (CfE) in 2021 was complimentary of the Scottish education system. It highlighted the continued relevance and ambition of CfE as the right approach for Scotland and that it continues to be viewed internationally as an inspiring example of curriculum practice. However, it also highlighted opportunities for its evolution and ongoing improvement to ensure a structured and long-term approach is taken.
The latest data from the OECD's Programme for International Student
Assessment (PISA) 2022 show that Scotland’s performance has declined from "high" to around average in PISA rankings compared to other nations. Scotland is now behind England in all three subjects, close to Northern Ireland, and just above Wales in mathematics. Key data includes:
- Mathematics: 471 (below the OECD average of 472). This was an 18-point drop from 2018, marking a continued downward trend since 2006
- Reading: 493 (above the OECD average of 476). This was an 11-point drop from 2018
- Science: 483 (above the OECD average of 485, similar to 2018/2022 context).
- Social Gap: The attainment gap in mathematics between the richest and poorest students was wider in Scotland (98 points) than the OECD average (93 points)
The Scottish Government are committed to continuing to use OECD's PISA assessment as a measure of the success of our education system. This will be complemented going forward with specific data to compare in reading literacy, maths and science compared to other nations, via the Trends in International Mathematics and Science Study (TIMSS) and the Progress in International Reading Literacy Study (PIRLS). Participation is scheduled for the 2026 PIRLS cycle and the 2027 TIMSS cycle.
For PIRLS 2026, Scotland will participate in the next cycle of the reading literacy study, with results expected to be published in December 2027 and for TIMSS 2027, Scotland has confirmed its participation in the maths and science study. A field trial will take place in March 2026, followed by the main study in 2027. Results for this are expected in December 2028. These studies were previously dropped by the Scottish Government, and their reintroduction is part of a move to increase internationally comparable data on Scottish education performance.