Sewage sludge: odour emissions assessment
This report is part of the research project undertaken by the James Hutton Institute on the impacts on human health and environment arising from the spreading of sewage sludge to land (CR/2016/23).
5. Results
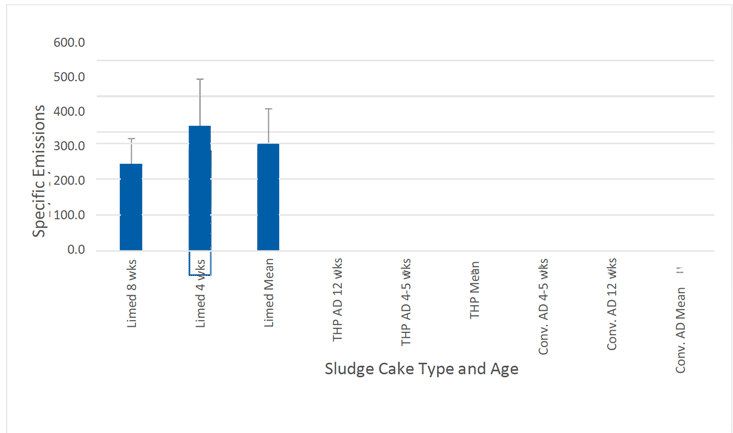
Area specific odour, H2S and NH3 emission rate data is summarised in Table 1. Figure 7 presents the comparative area specific odour emission rate data along with the 95 percent confidence intervals for the odour emission rates based on data provided in the BSEN 13725 standard in relation to olfactometric analysis as explained in section 6.1 below. Further details of sampling conditions and measurements are provided in Appendix 1.
Table 1 Comparative area specific emission rates. LOD = Limit of Detection
| Sludge cake type |
Approx. cake age |
Odour emissions (ouE/s/m2) from geometric mean odour concentrations (with 95 percent confidence levels) |
NH3 emissions for second sample of each treatment (mg/s/m2) |
Mean H2S emissions for each set of three samples (mg/s/m2) |
|---|---|---|---|---|
| LIMED |
8 weeks |
242 (153 to 382) |
0.171 |
0.00180 |
| LIMED |
4 weeks |
347 (219 to 548) |
0.118 |
0.00372 |
| Mean |
294 (186 to 465) |
0.145 |
0.00276 |
|
| THP |
12 weeks |
6.9 (4.4 to 10.9) |
0.216 |
<LOD |
| THP |
4-5 weeks |
5.0 (3.2 to 7.9) |
0.128 |
<LOD |
| Mean |
6.0 (3.8 to 9.4) |
0.172 |
- |
|
| AD |
12 weeks |
9.0 (5.7 to 14.3) |
0.028 |
0.00003 |
| AD |
4-5 weeks |
15.4 (9.7 to 24.3) |
0.023 |
0.00025 |
| Mean |
12.2 (7.7 to 19.3) |
0.025 |
0.00014 |
Contact
Email: gary.gray@gov.scot