Scottish Prison Population Statistics, 2020-21
The latest longitudinal statistics on prison populations and flows into and out of prison. Includes information about the demographics of people in prison, the time they spend there, their sentences and offences.
4 Individuals Experiencing Imprisonment
[Supplementary tables B2 and M1]
The number of individuals[22] who spent any time in prison over the course of 2020-21 was considerably lower than in 2019-20, as discussed in section 1.1. 14,239 people spent a day or more in prison over the period, compared with 17,310 in 2019-20 – a reduction of around 18%. While the number of individuals spending time in prison has fallen year on year since 2009-10, this is a larger single year reduction than previously observed (see Figure 15).
Note that this measure differs from average daily population[23] in that each individual is given equal weight regardless of how long they spent in prison.
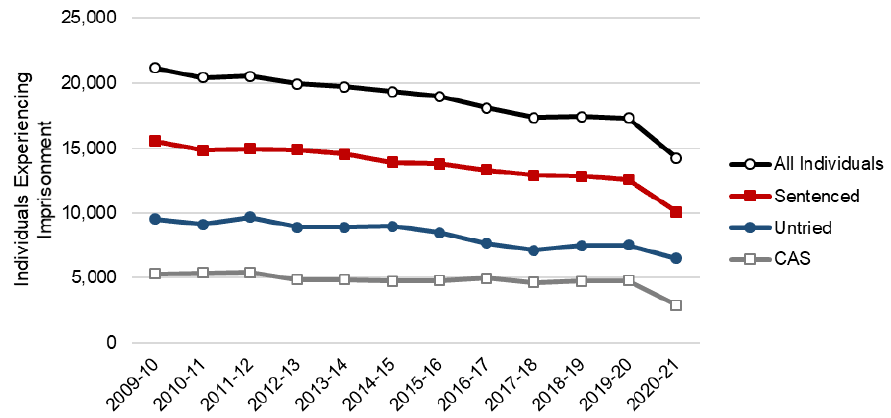
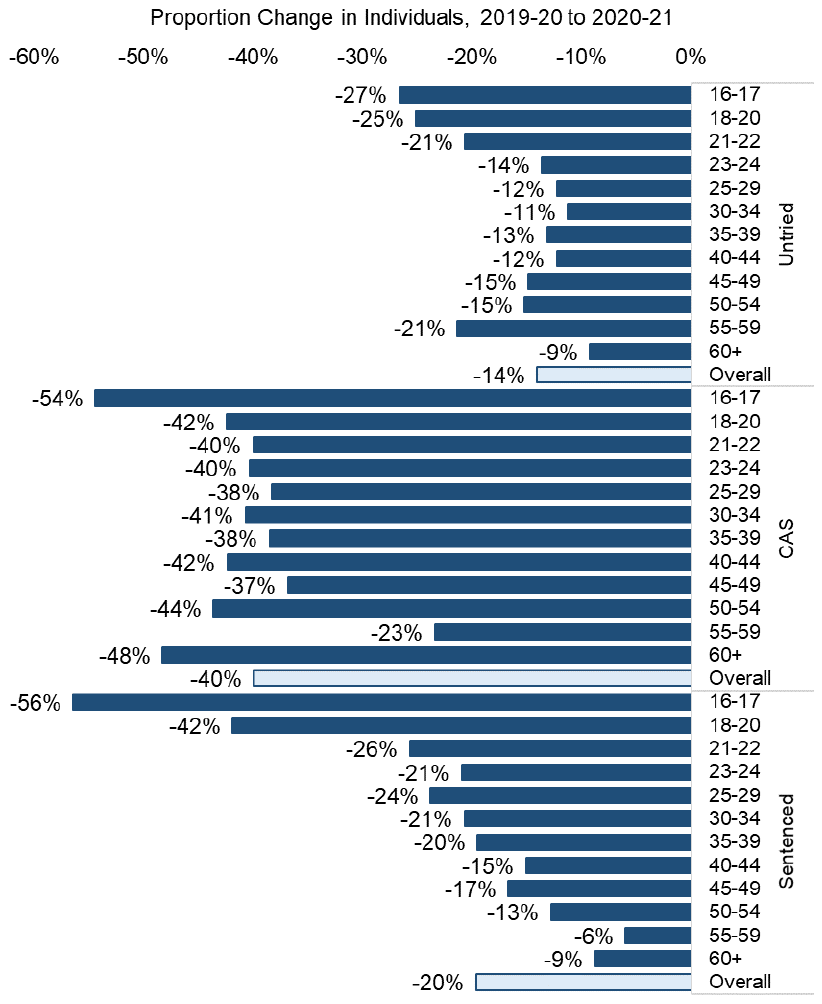
Between 2019-20 and 2020-21 there was a 14% decrease in the number of individuals spending any time untried (7,516 to 6,457), a 20% decrease in sentenced (12,595 to 10,122) and a 40% decrease in those convicted awaiting sentence (4,786 to 2,874)[24].
Contrasting the smaller number of untried individuals here with the 18% increase in the average daily population of untried people (see section 1.2) indicates that the time spent with this status increased between 2019-20 and 2020-21. This is explored in more detail in section 6.3.1.
Note that an individual can have more than one legal status type in a given year. This means that the total number of individuals across the legal status types will sum to more than the total number of individuals held in custody.
In the rest of this section we examine the changes in the characteristics of individuals experiencing imprisonment.
4.1 Gender
[Supplementary tables B2 and M1]
Women comprised just 6% of individuals experiencing imprisonment in 2020-21, down from 7% in 2019-20.
The number of men spending any time in prison over this period fell 17% from 16,043 in 2019-20 to 13,371 in 2020-21. For women the fall was greater – a 31% reduction from 1,264 in 2019-20 to 867 in 2020-21.
The greater proportionate decrease in women experiencing imprisonment holds across legal status categories. While there was a 13% decrease in men experiencing a period in prison untried, it was a 22% decrease among women. The 39% decrease in men convicted awaiting sentencing was a 53% in the number of women, and the 19% reduction in sentenced men was a 33% decrease in sentenced women.
4.2 Age
[Supplementary tables B2 and M1]
The overall reduction in the number of individuals experiencing imprisonment in 2020-21 held across all age groups, with the exception of 75+ years group, which increased from 67 in 2019-20 to 71 (see Figure 16). This is in contrast to the trend from 2009-10 to 2019-20, where reductions in the number of individuals were only observed in the younger age groups (under 30 years)[25].
The previously identified trend[26] of an aging group of people experiencing imprisonment continued through 2020-21. The average age of individuals spending any time in prison in 2010-11 was 31.8 years; by 2020-21 this had risen to 36.6. The proportion aged 55 years or older has more than doubled in ten years, from 3.3% to 7.8%.
In terms of a proportion of individuals (i.e. independent of the reduced volume overall), the proportion aged 35 or older increased marginally, while people in younger age groups decreased as a share of imprisoned individuals.
4.3 Ethnicity
[Supplementary tables B3]
Individuals identifying as White continued to comprise the largest ethnic group within those experiencing imprisonment in 2020-21 (95%)[27].
There was a reduction in the number of individuals experiencing imprisonment across all ethnic groups, but little change to the proportion of individuals each ethnic group represented between 2019-20 and 2020-21.
In line with the reduced number of individuals experiencing imprisonment, the rate of imprisonment for each ethnic group reduced by a small amount from 2019-20 to 2020-21. Compared with the White group (3.14 per 1,000), this rate remains somewhat higher among African, Caribbean or Black group (6.27 per 1,000) and the Other ethnic group (5.8 per 1,000), and somewhat lower for the Asian group (2.34 per 1,000)[28].
Ethnic groupings have been aggregated in this report, which is likely to mask variations within each group. Disaggregation of prisoner ethnicity data is currently being pursued for future analyses.
4.4 Other individual level characteristics
Statistics on other available protected characteristics (disability, sexual orientation, and marital status) and armed forces history are provided in the Supplementary Tables B4-7 accompanying this publication.
Contact
Email: jamie.robertson@gov.scot