Scottish Prison Population Statistics, 2020-21
The latest longitudinal statistics on prison populations and flows into and out of prison. Includes information about the demographics of people in prison, the time they spend there, their sentences and offences.
5 Population In-Flows
5.1 Arrivals to prison
[Supplementary Table C1]
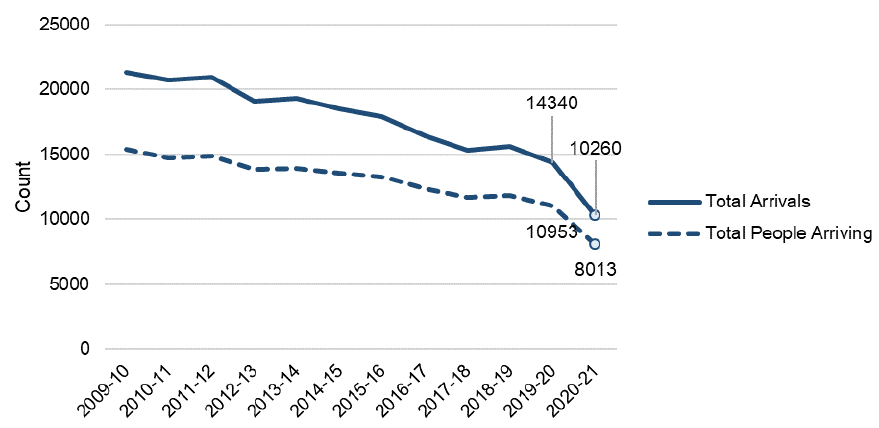
An arrival[29] is where a period of imprisonment begins for an individual, and is only counted as such if the arrival occurred on a separate day from any previous departure for that individual. Individuals can arrive to custody more than once in a given year and so a single individual may be counted more than once when analysing arrivals.
As per the patterns observed for the average daily population and the number of individuals spending time in custody, the number of arrivals to custody was considerably lower in 2020-21 compared to 2019-20. There were 10,260 arrivals to custody in 2020-21, compared to 14,340 in 2019-20 - a reduction of around 28%.
Again, while the number of arrivals to custody has fallen year-on-year since 2009-10, this is a larger single year reduction than previously observed (see Figure 17).
5.2 Arrivals by legal status
[Supplementary Table O1]
Arrivals fell 28% overall in 2020-21, but the extent of the reduction varied across all legal status categories[30] (see Figure 18).
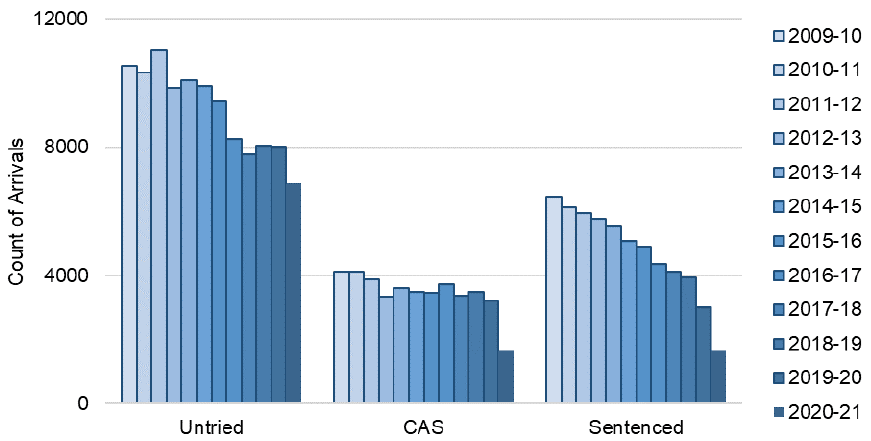
Reflecting the Covid impacts on the operation of the justice system (see Section 1.1), convicted awaiting sentence and sentenced arrivals fell considerably between 2019-20 and 2020-21 – by 49% (3,229 to 1,657) and 45% (3,011 to 1,660) respectively. Untried arrivals fell over the same time period, but to a lesser extent – 14% from 8,003 to 6,873.
Untried arrivals accounted for 67% of all arrivals to prison in 2020-21, compared to 56% in 2019-20.
5.3 Arrivals by local authority
[Supplementary tables C2]
Arrivals to prison reduced across all local authority areas between 2019-20 and 2020-21. In line with this change, the rate of arrival also decreased across all local authorities in 2020-21, from 2.5 to 1.8 per 1,000 head of population[31].
Dundee City retained the highest rate of arrival at 3.3 per 1000 population, down from 4.5 per 1,000 in 2019-20.
5.4 Arrivals by deprivation
[Supplementary tables C3]
There was no change to the previously reported pattern of arrivals to prison being most likely from the 10% most deprived areas of Scotland[32]. The 10% most deprived areas of Scotland accounted for 34% of all arrivals to prison in 2020-21.
5.5 Arrivals by no fixed abode
[Supplementary tables C4]
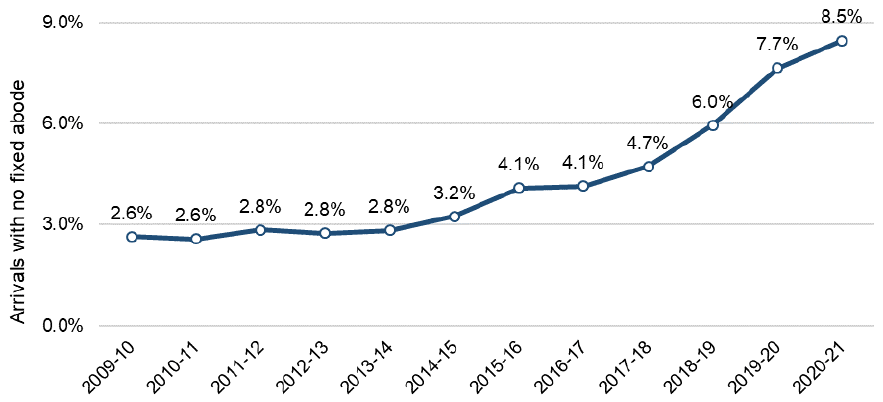
In 2020-21, 8.5% of arrivals to prison were individuals registered as of no fixed abode[33]. While the absolute number fell between 2019-20 and 2020-21 (from 1,098 to 869), this is the highest proportion recorded (see Figure 19).
5.6 Arrivals by offence group
[Supplementary tables O6]
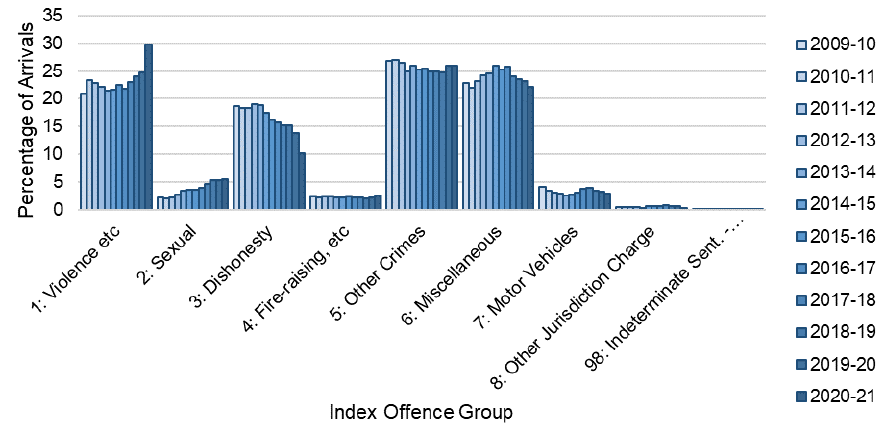
In 2020-21, arrivals to prison fell by 28% overall. This reduced arrivals across all offence groups[34] in 2020-21, albeit the extent of the reduction varied.
Arrivals for group 3 dishonesty offences fell by 47% between 2019-20 and 2020-21, from 1,998 to 1,050. Arrivals for group 5 Other crimes and group 6 miscellaneous offences fell by 28% (3,712 to 2,660) and 32% (3,320 to 2,265) respectively. Arrivals for group 2 sexual offences fell by 26% from 756 to 561 over the same time period – slightly less than the change to arrivals overall. The proportionate reduction in arrivals for group 1 non-sexual crimes of violence was much smaller at 14% (3,557 to 3,050).
Reflecting these variations in reduction, the ‘share’ of arrivals increased to 30% for group 1 non-sexual crimes of violence in 2020-21, compared to 25% in 2019-20. Group 1 non-sexual crimes of violence accounted for the single highest proportion of arrivals in 2020-21. These proportionate changes are shown in Figure 20.
Contact
Email: jamie.robertson@gov.scot