Scottish Prison Population Statistics, 2020-21
The latest longitudinal statistics on prison populations and flows into and out of prison. Includes information about the demographics of people in prison, the time they spend there, their sentences and offences.
1 Average Daily Population
[Supplementary tables A1]
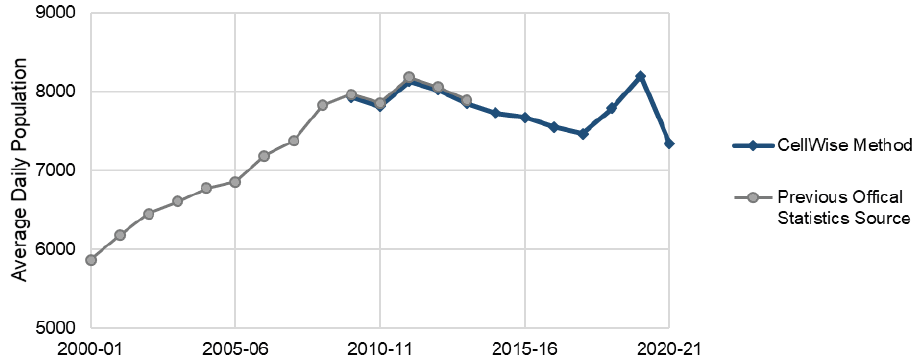
Responses to Covid related public health measures across the Justice System had a substantial impact on Scotland’s prison population in 2020-21. The average daily prison population[5] in 2020-21 was 7,337 – a reduction of around 10% from the previous year (8,200), which directly contrasts the annual population increases occurring between 2017-18 and 2019-20.
1.1 Change in context - COVID impacts on the prison population
[Supplementary tables X1]
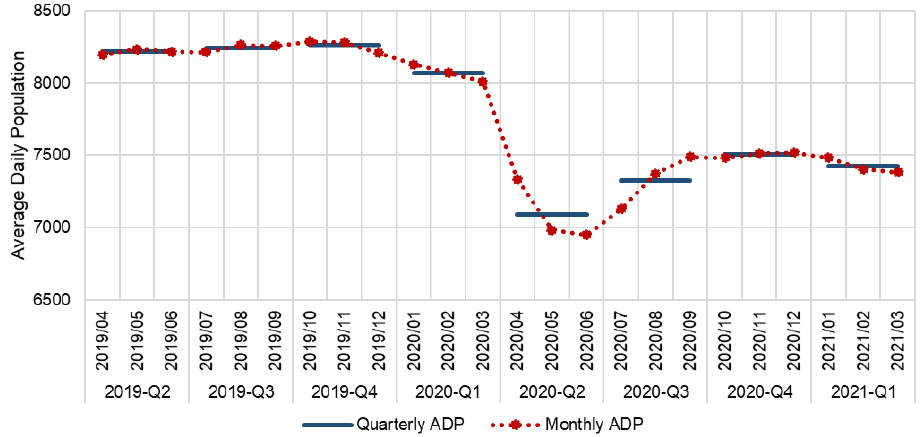
Using average daily population figures masks in-year changes in population levels. Under normal conditions, the changes occuring in the prison population on a day-to-day or week-to-week basis are small relative to the size of that population overall. However, coronavirus public health measures and the adaptations to these across the justice system, led to rapid and significant changes in the prison population from Spring 2020.
As Figure 2 shows, the average prison population fell rapidly in the first three months of the pandemic, from around 8,000 in March 2020 to just under 7,000 by June 2020. The population rose thereafter, and broadly stabilised from September 2020 at around 7,500.
Compliance with public health measures during the pandemic influenced operations across the criminal justice system. The Lord Advocate issued revised guidelines on the use of police custody, and the courts had to close for extended periods or operate at reduced capacity. Prison establishments had to ensure sufficient space to allow prisoners to observe public health measures.
The impact of justice system responses to public health measures in 2020-21 included: a decreased volume of custody cases reported to the Crown Office and Procurator Fiscal Service, and an increased volume of undertakings reports[6]; a reduced likelihood of an accused being remanded[7]; a reduced volume of concluded cases in courts, with subsequent reduction in custodial sentences issued and growth in the trial backlog[8]; and an agreement in the initial stages of the pandemic response to early release of eligible short term sentenced prisoners[9]. Combined, these shifts impacted both the in-flows to custody and the out-flows from custody.
Whilst it is not yet possible to isolate the impact of the pandemic on the data, it is reasonable to conclude that the latest data is predominantly a reflection of the impact of the pandemic across the justice system, and should not be interpreted as indicative of longer-term trends.
1.2 Legal status
[Supplementary tables M1 and X1]
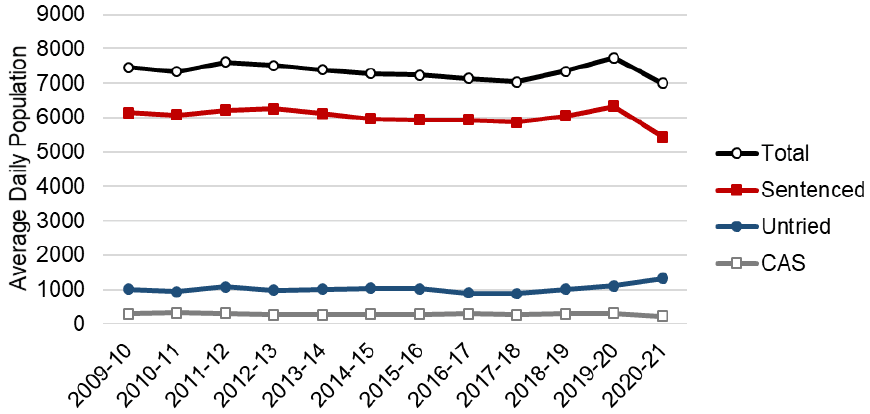
The overall (average daily) prison population fell 10% in 2020-21, but Figure 3 shows the distibution of that change varied by legal status[10] category – likely a reflection of the operational changes across the justice system detailed in section 1.1.
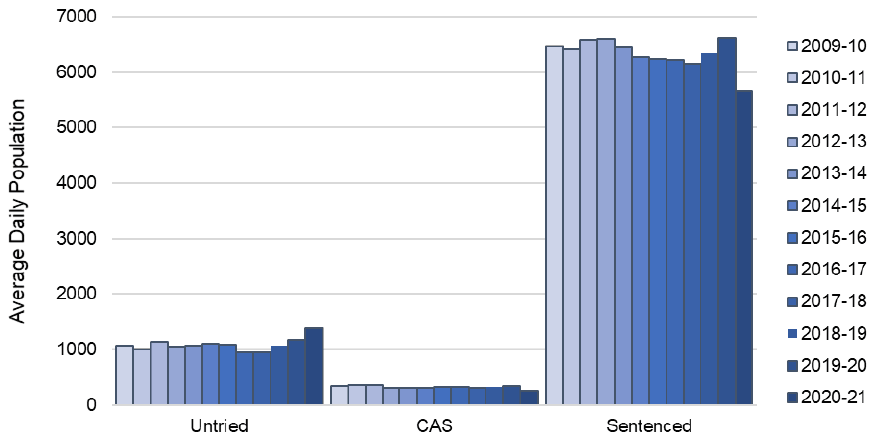
The sentenced population fell by almost 15%, from around 6,621 in 2019-20 to around 5,657 in 2020-21. The convicted awaiting sentence (CAS) population fell further, by around 28% from around 347 in 2019-20 to around 250 in 2020-21. Over the same period, the untried population increased by almost 18%, rising from around 1,178 in 2019-20 to around 1,384 in 2020-21.
Combining the untried and CAS population changes, the overall remand population increased by 7% between 2019-20 and 2020-21.
On the average day in 2020-21, 1,633 prisoners were on remand. This is the highest level since at least 2008-09[11] and, at 22% of the population, the largest proportion on remand on record. This estimate in relation to other sources is discussed in section 7.1.
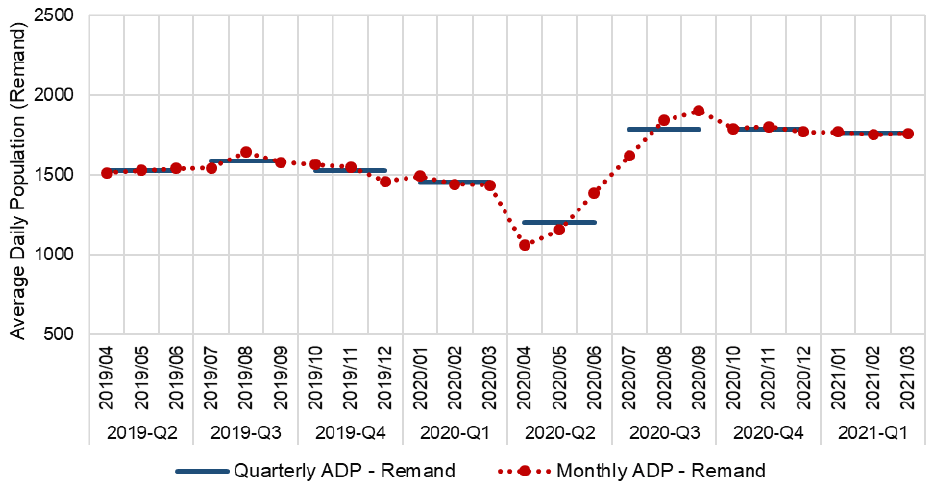
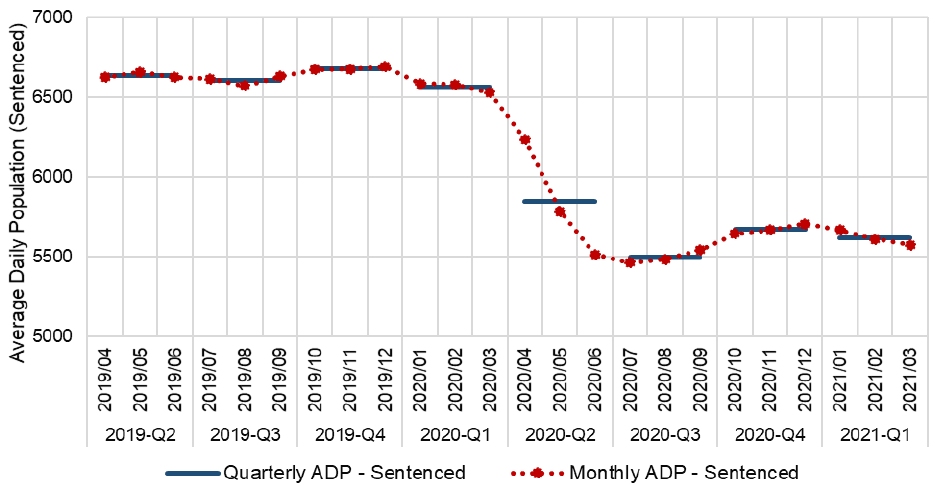
Figure 4 and Figure 5 provide the monthly and quarterly average daily populations on remand or serving a sentenced over the past two years. After an initial sharp decrease the remand population grew rapidly – levelling off at a higher level than pre-pandemic. Meanwhile the sentenced population fell more slowly but then plateaued at a lower overall level.
1.3 Gender
[Supplementary tables A2, B2 and M1]
The (average daily) populations of both men and women fell in 2020-21. Men comprised over 95% of the average daily population in 2020-21.
The population of men fell from 7,793 in 2019-20 to 7,037 in 2020-21, a fall of almost 10%.
As with the population overall, this pattern varied by legal status category. Figure 6 shows that between 2019-20 and 2020-21 the men’s sentenced population fell around 14% from 6,320 to 5,444 and the convicted awaiting sentence (CAS) population fell 26% from 314 to 232. At the same time, the men’s untried population increased by almost 19% from 1,110 in 2019-20 to 1,317 in 2020-21.
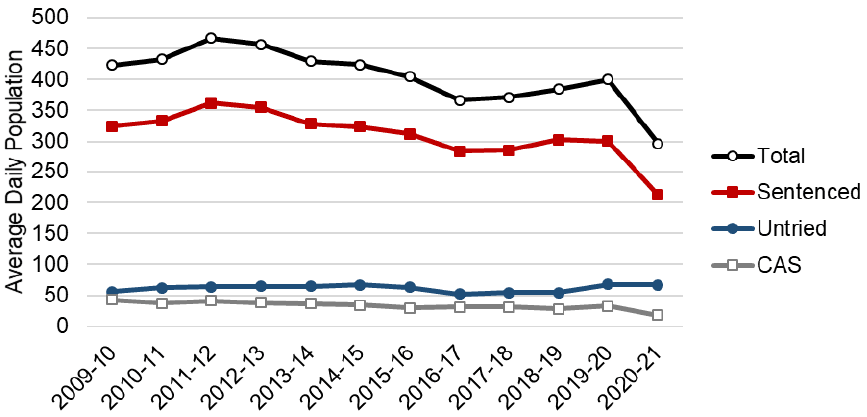
The population of women fell almost 26% from 402 in 2019-20 to around 300 in 2020-21. The proportion of the population overall who were women fell from 4.8% in 2019-20 to 4% in 2020-21.
As shown in Figure 7, the sentenced population of women fell by 29% from 300 to 212, and the CAS population almost halved, falling from around 33 in 2019-20 to around 18 in 2020-21. In contrast to the men’s population, the size of the average daily population of untried women did not change between 2019-20 and 2020-21 (remaining around 67 in both reporting years).
As a share of their respective populations, the proportion of women on remand has consistently exceeded that of men. In both cases, that proportion rose between 2019-20 and 2020-21: for men that proportion increased from 18% to 22%, while for women it increased from 25% to 28%.
1.4 Age
[Supplementary tables A2, B2, and M1]
In the context of a 10% reduction in the (average daily) population overall, there was a greater reduction in the population of young people in custody. The population of 16 and 17 year olds accelerated in its general downward trend, falling from 31 in 2019-20 to 22 in 2020-21. Similarly, the population of 18 to 20 year olds continued a downward trend, falling by around 34% from 294 in 2019-20 to 194 in 2020-21.
Once again, this pattern has varied by legal status category. For 16 and 17 year olds, the sentenced population more than halved from 16 in 2019-20 to 7 in 2020-21, and the convicted awaiting sentence (CAS) population fell from around 5 to 2. The untried population increased by a small amount from around 10 in 2019-20 to around 12 in 2020-21.
For 18 to 20 year olds, the sentenced population almost halved, falling from around 208 in 2019-20 to 110 in 2020-21, and the CAS population reduced by around a third from 27 to 19 over the same period. The untried population increased by a small amount from around 58 to 62.
Across all other age categories (with the exception of 65-69 years), the number of untried people in prison increased in 2020-21. The largest increases were in the age groups 25-29 (+51, +24%), 30-34 (+57, +23%) and 35-39 (+30, +15%). The 65-69 age group fell from 5.4 to 2.7 people on average.
The CAS population fell across all age groups between 2019-20 and 2020-21, as did the sentenced population (with the exception of the 70+ years category, which increased from 106 in 2019-20 to 114 in 2020-21).
1.5 Other (average daily) population characteristics
Information on other available protected characteristics (ethnicity, disability, sexual orientation, and marital status), as well as breakdowns by prison establishment and armed forces history are available in the Supplementary Tables B1-7 accompanying this release.
Contact
Email: jamie.robertson@gov.scot