Scottish prison population: statistics 2019 to 2020
This publication explores the characteristics of imprisoned people in Scotland. Following several years of sustained decrease, the prison population has risen sharply since 2017-2018 to an annual average of around 8,200 in 2019-2020.
2 Imprisoned People: Individual level analysis
In terms of the total number of individuals experiencing imprisonment each year
- In 2019-20, 17,294 individuals spent some time resident in Scottish prisons
- This has fallen by around 15% since 2010-11, when 20,407 people were identified
The current dataset allows examination of the attributes of individuals who are imprisoned for any length of time in each year. It therefore more fully captures the impact on individuals, their families and communities than a measure of average populations.
In this section, we highlight cases where the representation in the prison population differs from the population of Scotland as a whole. Where changes to subgroup representation have clearly occurred over the past ten years, we present these changes in terms of the proportion of individuals in each subgroup.
Daily average populations are provided in the associated tables accompanying this publication. In general the relationships and changes identified below are broadly similar. Where this is not the case, we highlight it in the commentary.
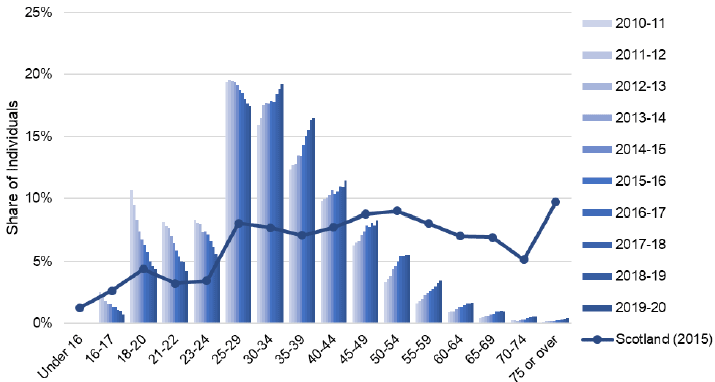
2.1 Age
(Data table B2)
People who spend time in prison are younger on average than the population of Scotland as a whole - younger people are far more likely to be imprisoned than older people. However, in the past ten years, this difference has narrowed.
- The imprisoned population overall was older in 2019-20 than in 2010-11 (Figure 5)
- The average age of individuals spending any time in prison in 2010-11 was 31.8; by 2019-20 this had risen 35.9
- The proportion aged 55 or older has more than doubled in ten years, from 3.3% to 7%.
2.2 Gender
(Data table B2)
Throughout this time series, men consistently make up the majority of people in prison. The proportion of prisoners who are women fell over the past ten years, from 1,693 individuals in 2010-11 (8.3% of the total) to 1,263 in 2019-20 (7.3%).
The average age of women in prisons is approximately the same as that of men, and has increased in step from 31.6 in 2010-11 to 35.4 in 2019-20.
2.3 Disability
(Data table B5)
On entry to prison, people are asked 'Do you consider yourself to have a disability?'. This self-reported status does not necessarily capture all the physical or mental needs of a person entering custody and should be viewed as a proxy measure only.
Between 8% and 10% of people who spent any time in prison over the past 10 years self-identified as being disabled.
The prevalence of people reporting a disabliity on entry to prison is broadly as expected for a relatively young population compared with population surveys of the Scottish population as a whole.[7]
2.4 Ethnicity
(Data table B3)
Reflecting the characteristics of Scotland as a whole, the majority of people who spend time in prison identify as White.
The proportion of individuals who spent time in prison over the last ten years and were in an ethnic group other than 'White' was between 3.7% and 4.3%; broadly in line with the profile of the Scottish population as a whole (4% on census day 2011).
Looking at the breakdown of minority ethnic categories in Figure 6, the prison data does show an increase in the numbers of individuals in the 'Mixed or Multiple' or 'Other Ethnic Group' categories over the last 10 years. The absolute numbers are small, but the size of these groups has almost doubled in the 10 year period examined. This is in the context of the number of individuals spending time in prison falling overall.
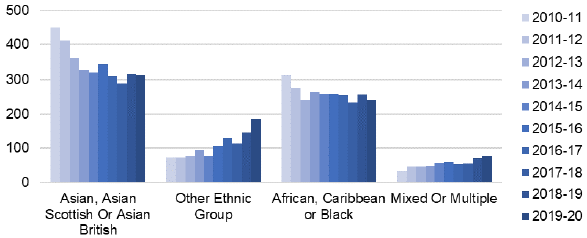
The 2011 census found a large proportion of minority ethnic groups in Scotland had much younger profiles than the white majority.[8] This was particularly evident among people identifying in the "Mixed or Multiple Ethnic groups category", of whom nearly half (9,762 people) were under 18 and 34% under 10 years old. The "African, Caribbean or Black" and "Other Ethnic Group" groups had similarly young demographics. The move to adulthood does seem to correlate with the rising numbers of prisoners in these demographic groups albeit further analysis combining different data sources would be needed to explore this pattern further.
Data from the 2011 census and the Scottish Surveys Core Questions[9] allow us to consider rates of imprisonment for different ethnic groups.
| 2011-12 | 2019-20 | range | |||
|---|---|---|---|---|---|
| individuals | per 1000 | individuals | per 1000 | ||
| White | 19,705 | 4.7 | 16,474 | 3.8 | (3.7 - 3.9) |
| Asian, Asian Scottish or Asian British | 412 | 3.8 | 312 | 2.5 | (2.2 - 2.8) |
| African, Caribbean or Black | 276 | 10.3 | 240 | 7.6 | (6.1 - 10.2) |
| Mixed or multiple ethnic groups | 48 | 5.7 | 78 | 4.5 | (3.4 - 6.4) |
| Other ethnic groups | 73 | 6.8 | 187 | 6.9 | (5.6 - 9.0) |
The incarceration rate for White and Asian people fell between 2011-12 and 2019-20. For other groups, taking into account the uncertainty around ethnic group population estimates, there was no discernable change.
In 2019-20, the incarceration rate for people who identify as African, Caribbean or Black, or from Other ethnic groups, remains significantly higher than for people who identify as White (see Table 2).
People identifying as Asian, Asian Scottish or Asian British have the lowest incarceration rates, and this rate has fallen from 3.8 per 1000 population in 2011-12 to between 2.2 and 2.8 in 2019-20.
Ethnic groupings have been aggregated in this report, which is likely to mask variations within each group. Disaggregation of prisoner ethnicity data is currently being pursued for future analyses.
Contact
Email: justice_analysts@gov.scot