Scottish prison population: statistics 2019 to 2020
This publication explores the characteristics of imprisoned people in Scotland. Following several years of sustained decrease, the prison population has risen sharply since 2017-2018 to an annual average of around 8,200 in 2019-2020.
1 Daily Average Populations
(Data tables A1 and A2)
Average prison population totals have been used to explore trends and patterns in the prison population. In a departure from this model, most of this publication focuses on the attributes of individuals who experience imprisonment in each year (see section 2). Statistics in this section provide comparisons to, and validation against, previously published estimates, and extends them to the latest available data.
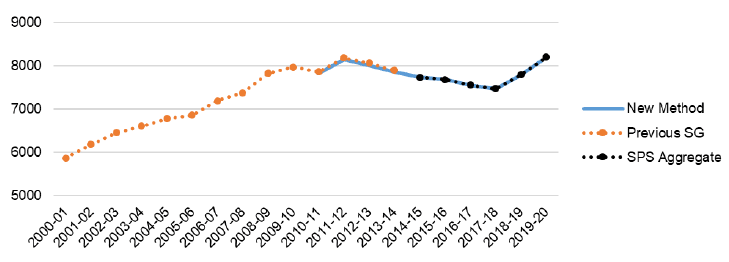
Daily population averages are derived by averaging population figures gathered over the course of a given year. Figures for calculating population averages were historically extracted on a daily basis. The average calculation in this publication is based on a "cell-wise" method[2] - a different methodology from both the SPS published values[3] and those from the previous Scottish Government publication.[4]
In spite of their methodological differences, the results from the three methods are broadly in line. The cellwise calculation differs from the SPS figures by less than 0.01% in each year, and by around 0.5% from the legacy Scottish Government publication.
The annual average population has fluctuated over the course of the ten years covered by these data (Figure 1). In 2011-12, there was a continuation of a general rising trend in the population. This was then followed by several years of steady reduction. However, between 2017-18 and 2019-20, the average daily prison population rose steeply from around 7,500 in 2017-18 to nearly 8,200 in 2019-20. Some of the reasons for this increase are unpicked in section 5.
1.1 Women and Young Offenders
(Data table A2)
The prison population is largely comprised of men aged 21 and over. Women and young offenders are held separately in custodial establishments and distinct approaches have been developed to manage these particular groups within the prison system. The size of these groups has followed diverging trends from the overall population.
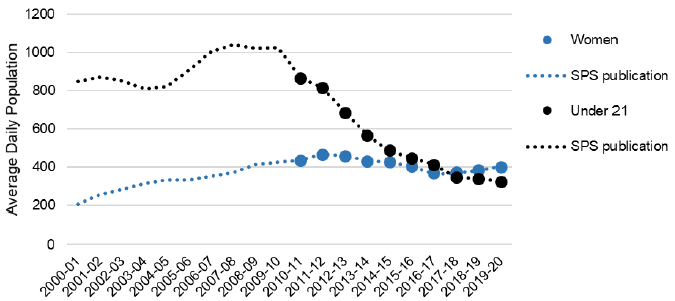
Following a period of rapid rise, the average number of women in custody fell between 2011-12 and 2016-17. Since 2016-17, the average population has been slightly under 400 people (Figure 2).
By contrast, the average number of young offenders in custody (people aged 20 or younger) has dropped considerably over the same period, from around 864 in 2010-11 to around 325 in 2019-20 (Figure 2).
1.2 Establishment Populations
(Data table B1)
The management of prison populations is complex, and cannot be fully captured over the long term with the currently available data. As well as segregation by gender and age (for young offenders), subgroups within the population are required to be seperated that we cannot currently identify, including: unsentenced individuals (the "remand" population), sexual offenders, those with links to serious and organised crime and those with characteristics requiring additional protections.
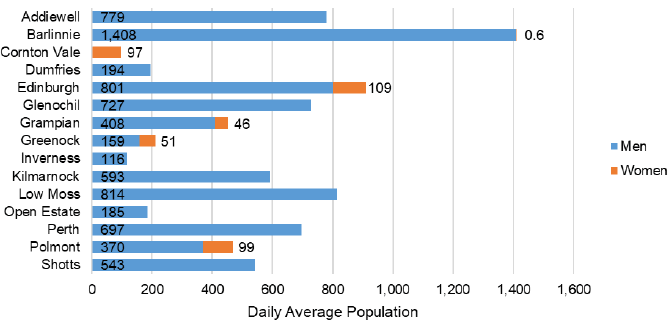
As a result, our analysis of the distribution of the prison population is a limited one until these additional factors can be fully isolated in our data. However we can see that women are not spread evenly across the estate but concentrated in specialist establishments like Cornton Vale (a dedicated women's prison) and Polmont (which also caters specifically to young offenders), or as separated populations in HMPs Edinburgh,Polmont, Greenock and Grampian.
Around 97% of prisoners under 21 are resident in HMPYOI Polmont.
1.3 Ethnicity
(Data table B3)
Previously published statistics on ethnicity were based on an extract from a single day. The new data allow us to survey the entire year and derive averages and total counts of individuals in a period. However, the prevalence of different ethnic groups in prison comparing the old method for a single day and the new methodology of an average day provide very similar estimates for 2013-14.
The proportion of prisoners who identify as “White” has remained more or less constant since 2013-14 at 96%. More detailed discussion of per capita imprisonment is provided in section 2.4 in terms of the absolute number of individuals who spend any time in prison in the course of a year.
| Previous publication[5] | 2013-14 | 2019-201 | ||||
|---|---|---|---|---|---|---|
| 30/06/2013 | % | average day | % | average day | % | |
| White | 7,603 | 96% | 7,563 | 96% | 7,859 | 96% |
| Asian, Asian Scottish or Asian British | 132 | 2% | 142 | 2% | 144 | 2% |
| African, Caribbean or Black | 107 | 1% | 104 | 1% | 97 | 1% |
| Mixed or multiple ethnic groups | 23 | 0% | 19 | 0% | 33 | 0% |
| Other ethnic groups | 18 | 0% | 22 | 0% | 62 | 1% |
| Total | 7,883 | 7,851 | 8,195 | |||
1.4 Armed Forces Service History
(Data table B4)
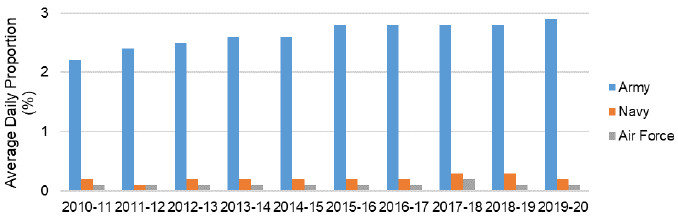
People arriving to prison are asked about current or past service in the armed forces to facilitate veterans organisations' interventions. The proportion of prisoners with some service history increased to above 3% in 2015-16, and was 3.2% in 2019-20.
Contact
Email: justice_analysts@gov.scot