Scottish Natural Capital Accounts: 2021
This report estimates quantity and value of services supplied by Scottish natural capital for:
Agricultural biomass
Fish capture
Timber
Water abstraction
Minerals
Fossil fuel
Renewable energy
Carbon sequestration
Air pollution removal
Noise mitigation
Urban cooling
Recreation and house price values
5. Cultural services
Cultural services are the non-material, experiential benefits people obtain from natural capital, such as recreation and aesthetic experience.
Nature provides us with several cultural services, the value of which can be understood by measuring engagement with the natural environment. This engagement involves visits to green and blue spaces, which are measured through survey responses, and desire to live near to these spaces or with a view of nature, which is measured by the value these features add to house prices. These two factors are related because living closer to green and blue spaces enables people to make "free trips" to the natural environment.
Recreation
During 2018, over 1 billion hours were spent on Scottish outdoor recreation (including travel time) for an estimated 534 million visits. The time spent in Scotland’s natural environment increased between 2012 to 2017, followed by a decline in 2018. However, 2018 still had the second highest amount of time spent on recreation across the time series. The largest year on year fall was between 2011 and 2012 where there was a 19% reduction in time spent in all Scottish habitat areas except woodland (Figure 28). The Scottish Recreation Survey summary report (PDF, 1.51MB) suggests that this may have been because of poor weather. This report estimated the number of visits to the Scottish outdoors was 25% lower during the summer months of 2012, compared with 2011. The total time spent on Scottish recreation fell by 6% from 2017 to 2018.
Visits to built-up urban green space areas in Scotland, such as local parks and gardens, made up the largest proportion of time spent in outdoor recreation between 2009 and 2018 (49% in 2018). An average trip to urban green space lasted an hour and 38 minutes, compared to an average of 2 hours 41 minutes for a trip to a mountain, moorland or hill habitat in 2018.
Estimates of outdoor recreation refer to people aged 16 years and over and excludes overnight and tourist visits. Since the survey is sampled on a residency basis, it does include day trips by Scottish residents which may have occurred outside of Scotland.
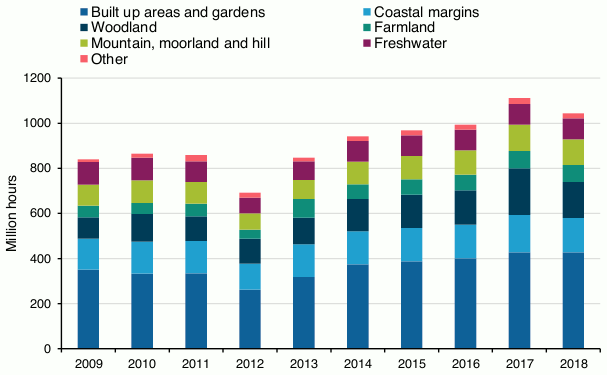
Time spent on recreation by habitat in Scotland, million hours, 2009 to 2018
Source: Office for National Statistics, Monitor of Engagement with the Natural Environment (MENE) survey, Scottish Recreation Survey, and Scotland’s People and Nature Survey
Scotland represented 10% of estimated UK time spent on outdoor recreation during 2018. In the same year, the average person in Scotland spent 231 hours on outdoor recreation. This was 24% higher than the UK average of 187 hours. There were also more outdoor recreation visits per person in Scotland; people in Scotland on average took 118 outdoor recreation visits in 2018, compared to the UK average of 95 visits.
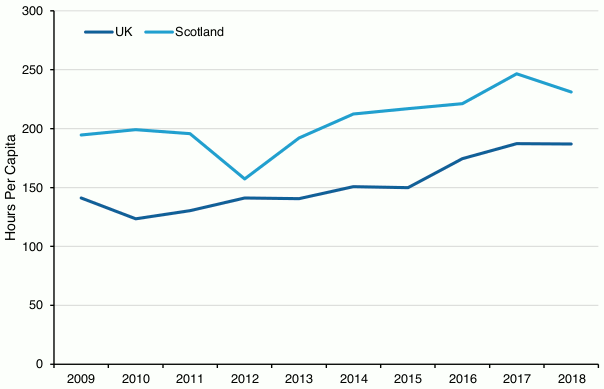
Total annual time spent (including travel) per person on outdoor recreation, 2009 to 2018
Source: Office for National Statistics, Monitor of Engagement with the Natural Environment (MENE) Survey, The Welsh Outdoor Recreation Survey, National Survey for Wales, Scottish Recreation Survey, and Scotland’s People and Nature Survey
In 2018, UK outdoor recreation had an annual value of £8 billion (2019 prices). Scottish visits represented around 7% of this (£535 million). The value (2019 prices) of Scottish recreation decreased by 34% between 2009 (£815 million) and 2018 (£534 million), whereas the value of UK recreation fell by 12% between 2009 (£9.1 billion) and 2018 (£8 billion).
The fall in Scottish expenditure can largely be attributed to reduced car running costs from fewer and shorter distance drives to the outdoors. In 2018, outdoor recreation visits that were travelled to by car decreased to 26%, down from 30% in 2009. The average roundtrip distance also decreased from 22 miles to 18 miles. People were trading their cars for walking boots as the percentage of people walking to their visit destination increased from 65% to 68% between 2009 and 2018. In 2009, Scottish residents walked 593 million miles travelling for outdoor recreation. In 2018, they walked 493 million miles more, walking 1.1 billion miles to visit nature near their door.
Scottish people are staying longer and visiting the outdoors more, while opting for cheaper visits. In Scotland, the average spend on an outdoor recreation visit in 2018 was £1, compared to the UK average of £1.50. In Scotland, visits to urban green space had the lowest average spend in 2018 of £0.73 per trip, with £0.55 of that being travelling expenses. A lower travel cost is likely to reflect shorter journeys and so improved access to urban green space. Lower values could as easily reflect good provision of natural spaces as bad in this context. Visits in Scotland to mountain, moorland, and hill habitats in 2018 had the highest per trip average spend of £2.77, with £1.96 being travel costs.
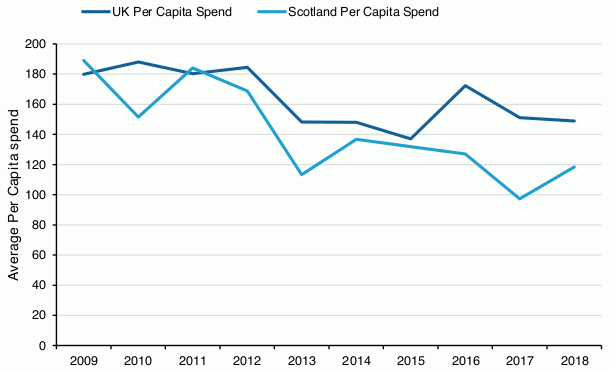
Average Per Capita spend across all habitats, UK and Scotland, 2009 to 2018
Source: Office for National Statistics, Monitor of Engagement with the Natural Environment (MENE) Survey, The Welsh Outdoor Recreation Survey, National Survey for Wales, Scottish Recreation Survey, and Scotland’s People and Nature Survey
As illustrated in Figure 30 above, the average per capita spend in Scotland across all habitats in 2018 was £118. The UK average equalled £148 for the same year. Across the time series, the average spend in Scotland has fallen by 37%, while the UK average has fallen by 17%.
The asset value of recreation in Scotland in 2018 was estimated to be £21.5 billion, 6% of the UK value.
Scottish House Prices: Recreation and Aesthetic Values
Living close to green spaces added, on average, £2,438 to Scottish property prices in 2016 (2019 prices).
The value of green and blue spaces measured by house prices at the UK level have previously been published. This analysis estimates what proportion of a house's price can be attributed to its views of or access to green and blue spaces, like parks and lakes. Access to and views of these spaces provide a range of benefits which are reflected through market prices for housing. From implementing a hedonic pricing method, we provide estimates for the value of green and blue spaces, relative to the value of properties within 500 meters of these spaces.
There are two important caveats to note before interpreting the estimates for Scotland. Firstly, we were unable to include data on Scottish schools, as Education Scotland only inspect a sample of schools and educational establishments are not given an overall inspection outcome in the same way that Ofsted and Estyn provide. Since there is a strong correlation between house prices and proximity to school, this lack of data will reduce the precision of the Scottish model.
Secondly, it is possible that our sample of urban property prices underestimates actual urban property prices in Scotland. This is because property price data from Zoopla captures the advertised price rather than the real selling price. Scottish properties, however, are marketed with either a fixed price or “offers over” – the minimum offer accepted by the seller. As bidding for “offers over” houses can drive up the selling price of properties, our data on advertised prices likely underestimate the real selling price.
The hedonic pricing approach analyses a range of other variables that affect house prices, in addition to willingness to pay for living close to green and blue spaces. Table 5 shows the variables included in this model. We can use this approach to measure the value of the “free” recreational trips to nearby green spaces, which are missing from the recreation account. It is worth noting that some of the differences we attribute to green or blue spaces may be because of additional characteristics of the property or the local area, which the model is unable to identify.
| Characteristic vector | Component variables | Sources |
|---|---|---|
| Structural | Number of bedrooms | Zoopla |
| Structural | Property area (square feet) | Zoopla |
| Structural | Property type, such as house, bungalow, flat | Zoopla |
| Structural | Property attributes based on description (for example, garage, double glazing) | Zoopla |
| Neighbourhood | Distance to railway station | Ordnance Survey |
| Neighbourhood | Distance to local labour market | Ordnance Survey |
| Neighbourhood | Distance to nearest transport infrastructure | Ordnance Survey |
| Neighbourhood | Distance to nearest retail cluster | Ordnance Survey |
| Socio-economic | Scottish Index of Multiple Deprivation, Output Area Classification | Scottish Government |
| Environmental amenities | Distance to green space | Ordnance Survey |
| Environmental amenities | Distance to blue space | Ordnance Survey |
| Environmental amenities | Area of Natural Features in 500 metres radius of property (square metres) | Ordnance Survey |
| Environmental amenities | Area of functional green space in 500 metres radius of property (square metres) | Ordnance Survey |
| Environmental amenities | Area of blue space in 500 metres radius of property (square metres) | Ordnance Survey |
| Environmental amenities | Function of green space | Ordnance Survey |
| Environmental amenities | Area of residential garden (square metres) | Ordnance Survey |
| Environmental amenities | Distance to railway line | Ordnance Survey |
| Environmental amenities | View over green or blue space | Zoopla |
| Environmental amenities | Air pollution | Department for Environment, Food and Rural Affairs |
| Environmental amenities | Noise pollution | Department for Environment, Food and Rural Affairs |
| Environmental amenities | Distance to coast | Department for Environment, Food and Rural Affairs |
| Environmental amenities | Distance to substation, tower, overhead lines | UK National Grid |
Source: Office for National Statistics
Table 6 shows the split of the total stock value by recreational and aesthetic values for the years 2010 to 2016. The value of recreational services is based on the distance travelled to green and blue spaces and the total area these spaces occupy. The value of aesthetic services is based on the view individuals have of green and blue spaces. Recreational values are significantly larger than aesthetic values across this time series.
In 2016, recreational value equalled £5.7 billion and aesthetic value equalled £0.56 billion. Across the time series, the average combined value of access to and views of green and blue space has fallen from £4,767 per property in 2010 to £2,438 in 2016.
We have no data to suggest that these value changes represent genuine falls in the provision or quality of urban green space. However, we do believe the yearly statistics are robust. England and Wales saw similar falls over the same period. We are observing a change in the price the public are willing to pay for houses with higher access to public green space. We have not yet fully analysed the drivers of this change – however it is worth noting that overall house prices have been increasing over that period. One theory is that as buyers start to further stretch their budgets the ability to pay for lower priorities will fall as they increasingly focus on more fundamental needs such as enough bedrooms.
| Year | Average value (£) | Average value (%) | Stock value (£billion) | Aesthetic value (£billion) | Recreational value (£billion) | N properties (millions) |
|---|---|---|---|---|---|---|
| 2010 | 4767 | 2.41% | 11.83 | 1.28 | 10.55 | 2.48 |
| 2011 | 3565 | 1.92% | 8.89 | 1.09 | 7.81 | 2.49 |
| 2012 | 4266 | 2.30% | 10.70 | 1.01 | 9.69 | 2.51 |
| 2013 | 3839 | 2.24% | 9.68 | 0.92 | 8.76 | 2.52 |
| 2014 | 3278 | 1.97% | 8.30 | 0.87 | 7.43 | 2.53 |
| 2015 | 2678 | 1.90% | 6.83 | 0.63 | 6.20 | 2.55 |
| 2016 | 2438 | 1.77% | 6.26 | 0.56 | 5.70 | 2.57 |
Source: Office for National Statistics
For annual values, we can present an equivalent rental value of living within 500 metres of green or blue space (Table 7). “Imputed rent” is a national accounting term for what homeowners would receive if all homes were rented. It can be thought of as the amount that non-renters are willing to pay themselves for the housing services they produce. This must be imputed as homeowners do not receive payment on their property.
In 2018, the estimated rental value of living within 500 meters of green and blue space was approximately £301 million.
| Year | Total (£ million, 2019 prices) |
|---|---|
| 2010 | 340 |
| 2011 | 277 |
| 2012 | 320 |
| 2013 | 322 |
| 2014 | 281 |
| 2015 | 275 |
| 2016 | 256 |
| 2017 | 303 |
| 2018 | 301 |
Source: Office for National Statistics
Travel to work areas (TTWA) are geographical areas created to approximate labour market areas. These are designed so that most people live and work within these defined areas, while relatively few people commute between areas. Table 8 presents the average effect of living near green and blue spaces in different TTWA.
Within the 10 most sampled travel to work areas, Edinburgh has the largest average effect with £6,928 of an average property’s value being attributed to access and views of blue and green spaces (2.93% of the average property price).
| Travel to work area | Average Value (£, 2019 prices) | Average value of property price (%) | N Validation Set | Average distance to green spaces (m) | Average distance to blue spaces (m) |
|---|---|---|---|---|---|
| Glasgow | 3,114 | 1.93% | 5,911 | 276 | 334 |
| Edinburgh | 6,928 | 2.93% | 2,415 | 254 | 390 |
| Motherwell and Airdrie | 2,094 | 1.65% | 1,907 | 290 | 473 |
| Falkirk and Stirling | 2,363 | 1.56% | 1,648 | 284 | 281 |
| Livingston | 2,562 | 1.77% | 1,174 | 285 | 350 |
| Kilmarnock and Irvine | 1,880 | 1.71% | 1,086 | 331 | 333 |
| Ayr | 1,626 | 1.09% | 729 | 290 | 367 |
| Dunfermline and Kirkcaldy | 2,266 | 1.73% | 601 | 315 | 355 |
| Perth | 3,010 | 1.75% | 585 | 262 | 345 |
| Inverness | 2,529 | 1.36% | 409 | 309 | 228 |
Source: Office for National Statistics