Scottish Housing Market Review Q4 2025
Quarterly bulletin collating a range of previously published statistics on the latest trends in the Scottish housing market.
Part of
1. Sales
1.1. Scottish Sales Performance: National
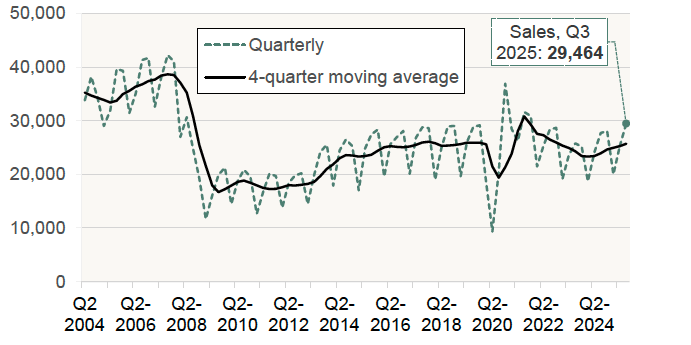
Source: Registers of Scotland
Chart 1.1 shows the volume of sales for each quarter and the 4-quarter moving average which gives a better indication of the longer-term trend.[1]
There were 29,464 sales registered across Scotland in Q3 2025 representing an annual increase of 6.2%. This meant that the total number of sales in the year to end Q3 2025 was 102,757, an annual increase of 7.4%, which is the highest level since the year ending September 2022. The uptick in sales is likely due in part due to the recent fall in mortgage interest rates (see Section 6) and other improvements in lending conditions (see Section 5).
The number of residential LBTT returns in the year to end Q3 2025 was 104,610, an annual increase of 7.5%. Chart 1.2 shows that for the months of October 2025 (10,100) and November 2025 (9,180) the number of returns is similar to the same months in 2024.
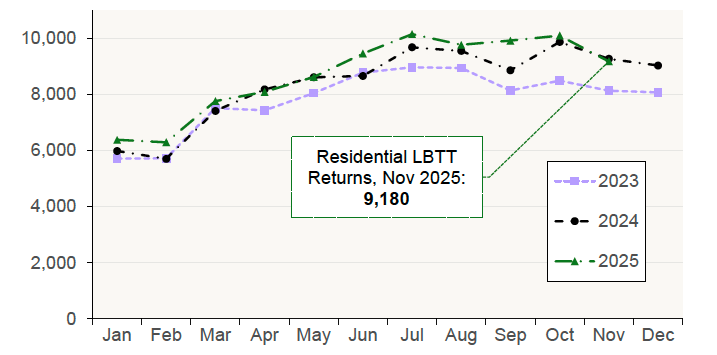
Source: Revenue Scotland
1.2. Scottish Sales Performance: Local Authorities
Table 1.1 sets out the level and annual change in quarterly transactions by local authority. The volume of transactions at local authority level can fluctuate significantly, particularly in smaller local authorities such as the island local authorities. To remove some of this volatility, the change in transactions in the last 4 quarters compared to the preceding 4 quarters is also presented.
Table 1.1 shows that the number of residential property sales has increased in most local authorities in Scotland: in the four quarters to Q3 2025 compared to the preceding four quarters, the only local authorities that experienced a fall in sales were Clackmannanshire (-9.9%), Orkney Islands (-4.5%), East Renfrewshire
(-4.2%), and West Dunbartonshire (-1.1%). The local authorities with the highest growth rates were Angus (21.7%) and East Lothian (21.2%).
| Local Authority | Sales - Q3 2025 | Q3 2025 on Q3 2024 | 4 quarters to Q3 2025 on previous 4 quarters |
|---|---|---|---|
| Aberdeen City | 1,516 | 16.3% | 13.8% |
| Aberdeenshire | 1,264 | 10.9% | 19.6% |
| Angus | 639 | 27.0% | 21.7% |
| Argyll and Bute | 503 | -13.0% | 1.8% |
| City of Edinburgh | 3,177 | 0.8% | 8.0% |
| Clackmannanshire | 222 | -8.6% | -9.9% |
| Dumfries and Galloway | 697 | 11.0% | 9.1% |
| Dundee City | 799 | 10.2% | 6.0% |
| East Ayrshire | 591 | 12.1% | 6.0% |
| East Dunbartonshire | 518 | 0.8% | 2.9% |
| East Lothian | 789 | 32.8% | 21.2% |
| East Renfrewshire | 497 | 6.4% | -4.2% |
| Falkirk | 785 | 4.2% | 8.9% |
| Fife | 2,046 | 8.7% | 5.8% |
| Glasgow City | 3,218 | 3.8% | 1.6% |
| Highland | 1,248 | 11.4% | 10.0% |
| Inverclyde | 392 | 18.8% | 12.7% |
| Midlothian | 611 | 12.3% | 13.4% |
| Moray | 528 | 16.3% | 6.1% |
| Na h-Eileanan Siar | 95 | 13.1% | 10.1% |
| North Ayrshire | 767 | 11.8% | 11.5% |
| North Lanarkshire | 1,528 | 3.6% | 5.2% |
| Orkney Islands | 96 | -15.0% | -4.5% |
| Perth and Kinross | 865 | -2.5% | 5.9% |
| Renfrewshire | 1,064 | 1.4% | 3.8% |
| Scottish Borders | 591 | 8.0% | 7.7% |
| Shetland Islands | 79 | -4.8% | 3.9% |
| South Ayrshire | 655 | -0.8% | 0.3% |
| South Lanarkshire | 1,850 | 3.4% | 7.4% |
| Stirling | 466 | -0.4% | 7.9% |
| West Dunbartonshire | 363 | -6.4% | -1.1% |
| West Lothian | 1,005 | 6.2% | 11.5% |
| Scotland | 29,464 | 6.2% | 7.4% |
Source: Registers of Scotland
Contact
Email: Jake.Forsyth@gov.scot