Scottish Housing Market Review: Q3 2022
Scottish housing market bulletins collating a range of statistics on house prices, housing market activity, cost and availability of finance and repossessions
Part of
5. Mortgage Approvals & LTVs
New Mortgage Advances
Chart 5.1 plots the monthly number of new mortgages advanced to first-time buyers and home movers in Scotland. There were 7,980 new mortgages advanced to first-time buyers in Scotland in Q2 2022, an annual decrease of 13.3% (-1,220). Meanwhile, there were 7,970 new mortgages advanced to home movers in Scotland in Q2 2022, an annual decrease of 2.1% (-170). Whilst the annual decrease for first-time buyers is large, this can be explained by the high number of new mortgages advanced in Q2 2021. Comparing the 12-month period to Q2 2022 against an equivalent pre-covid period (12 months to Q2 2019), new mortgage advances to first-time buyers increased by 1.1% whilst for home movers they decreased by 2.4%. (Source: UK Finance).
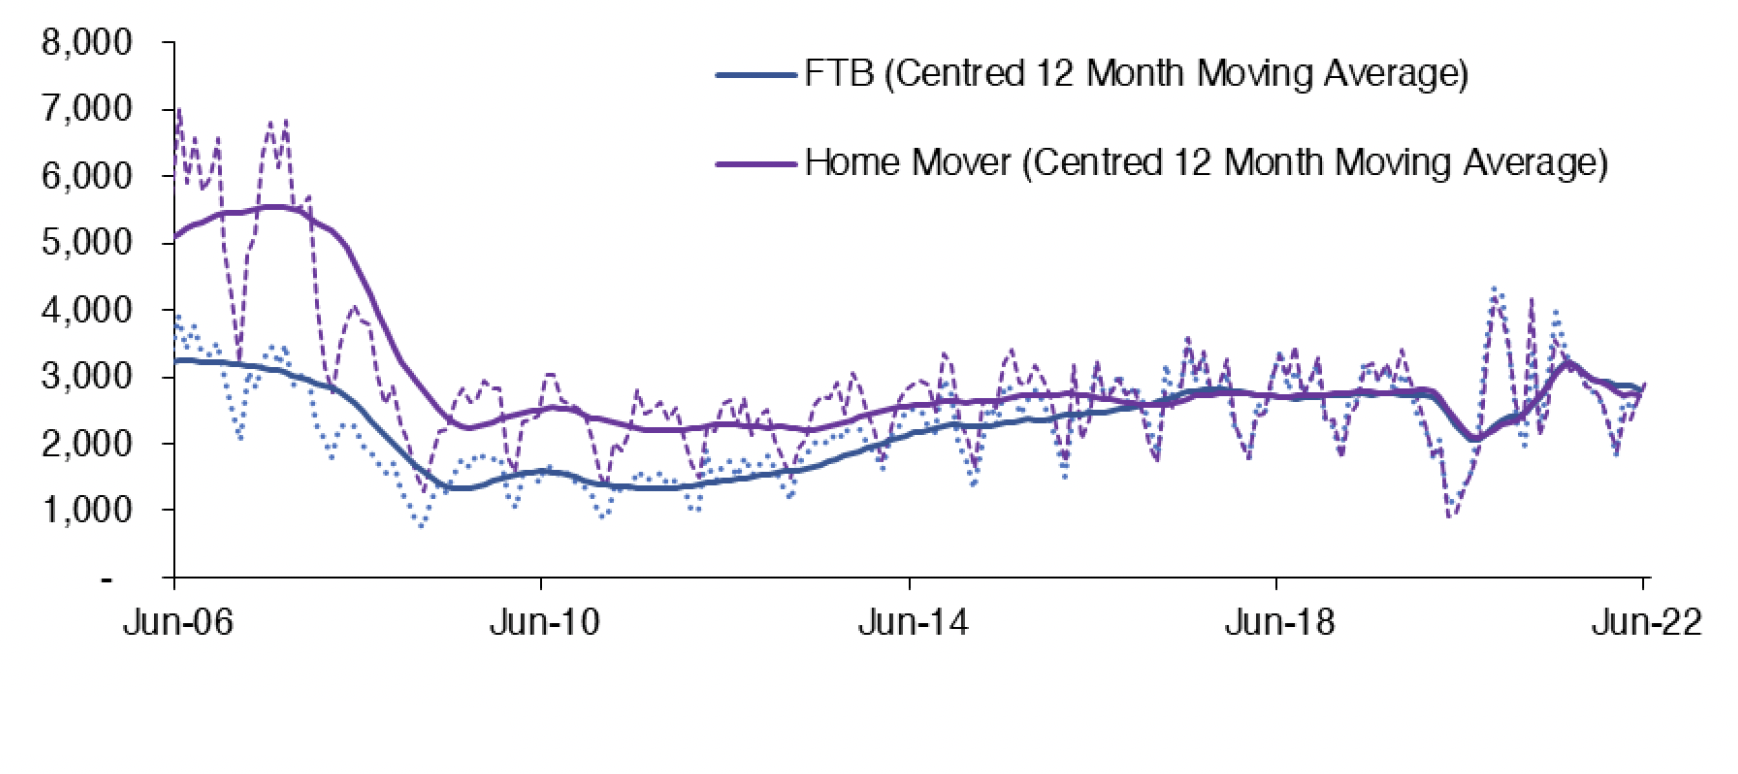
Source: UK Finance
Mortgage Approvals
Chart 5.2 plots the monthly number of mortgage approvals across the UK for house purchase (Source: BoE). Mortgage approvals for house purchase are the firm offers of lenders to advance credit fully secured on dwellings by a first charge mortgage. This data is a leading indicator of mortgage sales as it reflects activity early in the buying process.
Mortgage approvals for house purchase across the UK rebounded strongly following the lockdown in the second half of 2020, with mortgage approvals increasing from 9,922 in May 2020 to 104,806 in October 2020 (see Chart 5.2). Mortgage approvals have returned to more normal levels, with mortgage approvals for house purchase 2.7% higher in the first eight months of 2022 relative to the 2016-2019 average for the same months, however this data does not cover the period since the UKG Plan for Growth/mini-Budget on 23 September 2022.
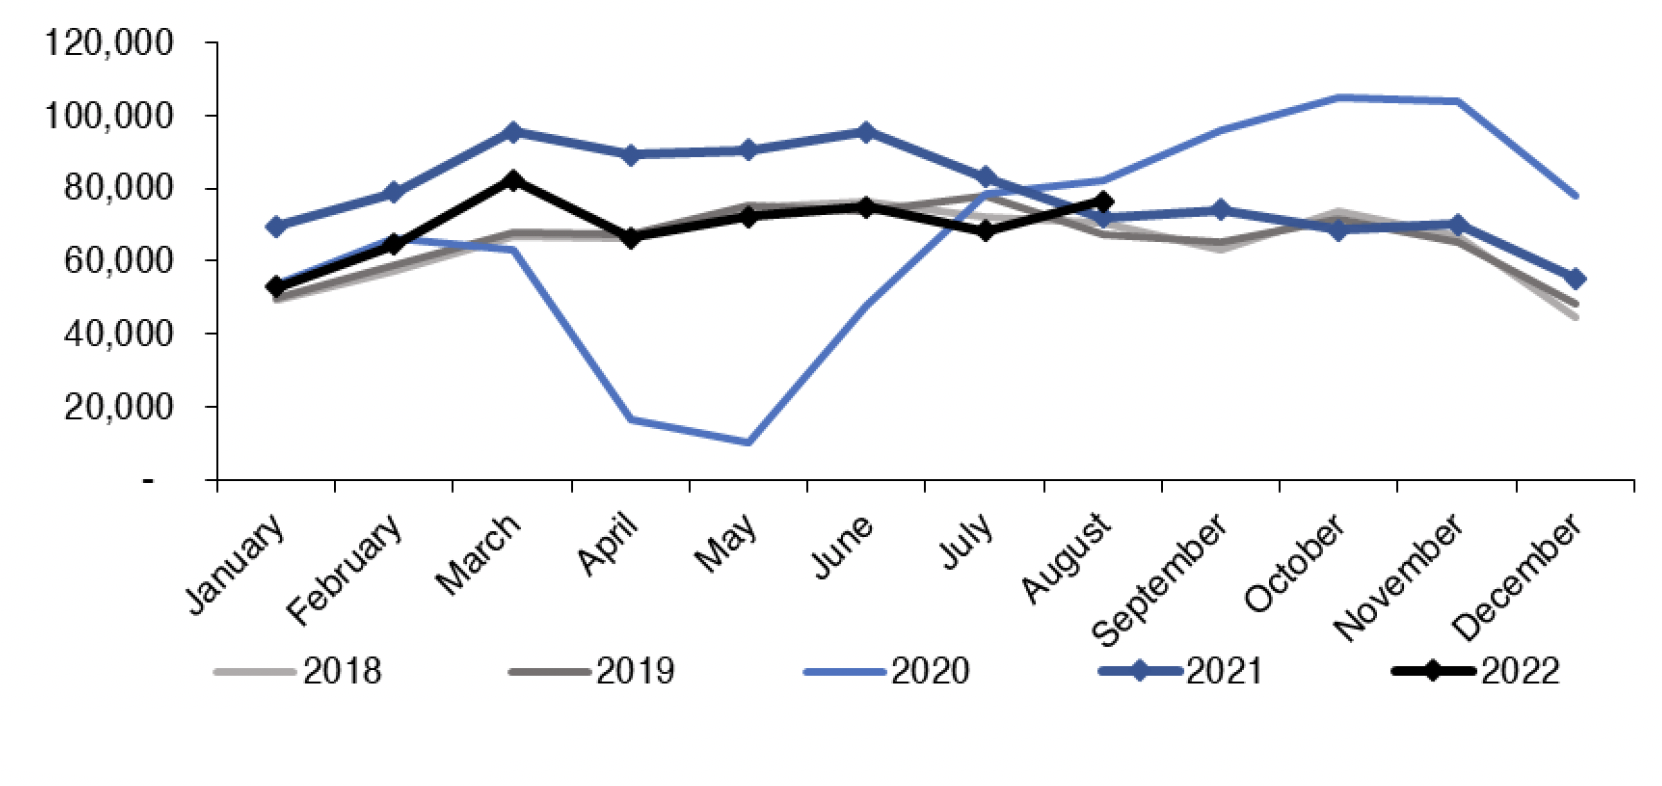
Source: Bank of England
Loan-to-Value (LTV) Ratios
In Q2 2022, the mean Loan-to-Value (LTV) ratio on new mortgages advanced to first-time buyers in Scotland stood at 83.4%, an annual increase of 4.1 percentage points. This likely reflects the return of high LTV ratio mortgages, whose availability fell substantially during the beginning of the coronavirus pandemic. Meanwhile, the mean LTV ratio for home movers in Scotland stood at 72.7% in Q2 2022, up 1.7 percentage points over the one year period. This is shown in Chart 5.3. (Source: UK Finance).
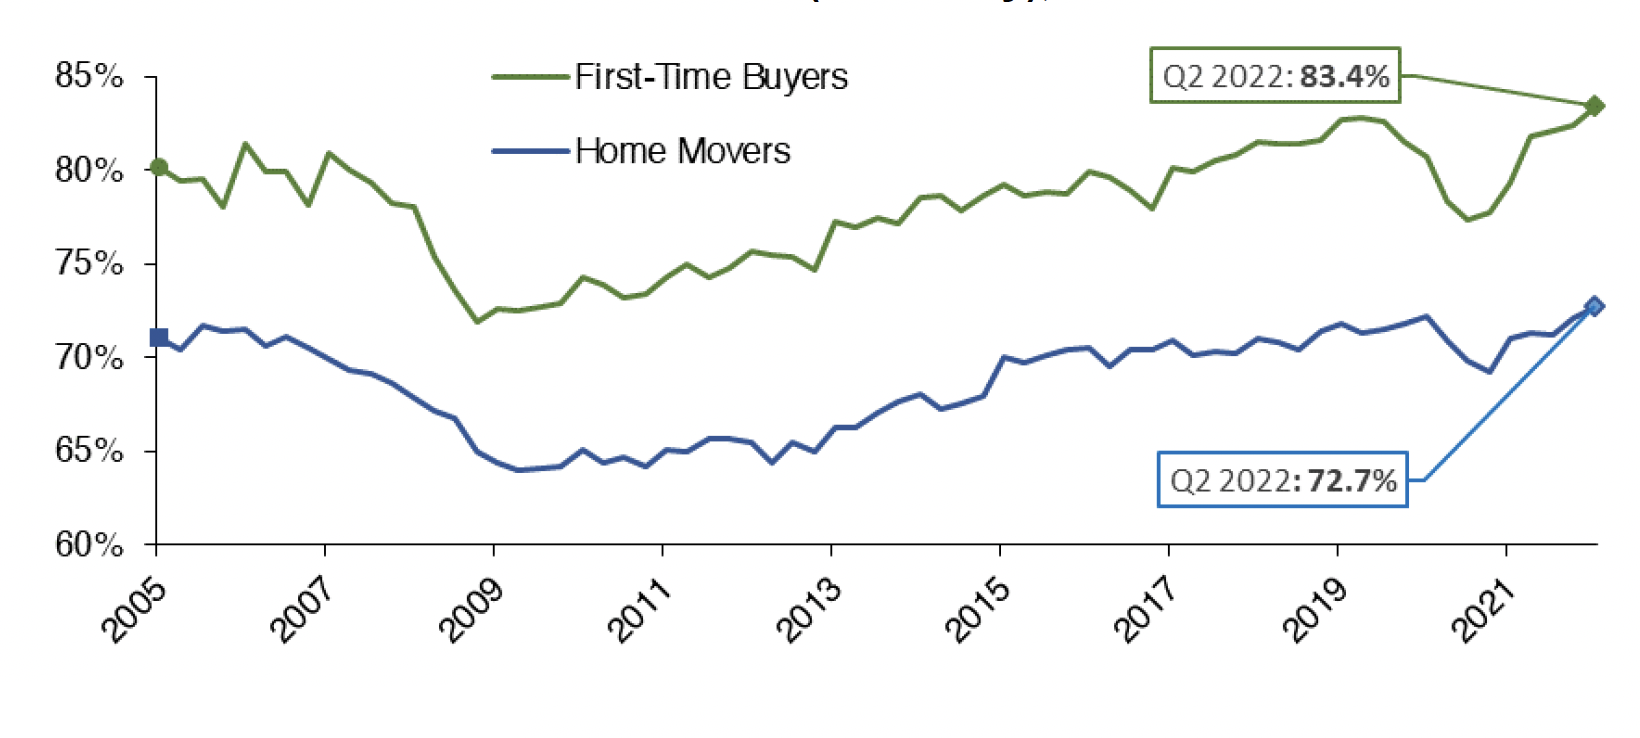
Source: UK Finance
Similarly, Chart 5.4 shows that while there was a reduction in new lending at high LTV mortgage ratios across the UK as from March 2020, the market has been recovering. The share of gross mortgage advances across the UK in Q2 2022 with an LTV ratio greater than 90% was 4.5%, 2.4 percentage points above the share in Q2 2021 but 1.0 percentage points lower than the share in Q2 2019. There has been a slight recovery in lending which is both high LTV and high LTI (loan-to-income) over the quarter, with the share of gross advances classified as high LTV and LTI increasing to 3.6% in Q2 2022, up by 2.0 percentage points on Q2 2021 but 0.5 percentage points lower than the share in Q2 2019.
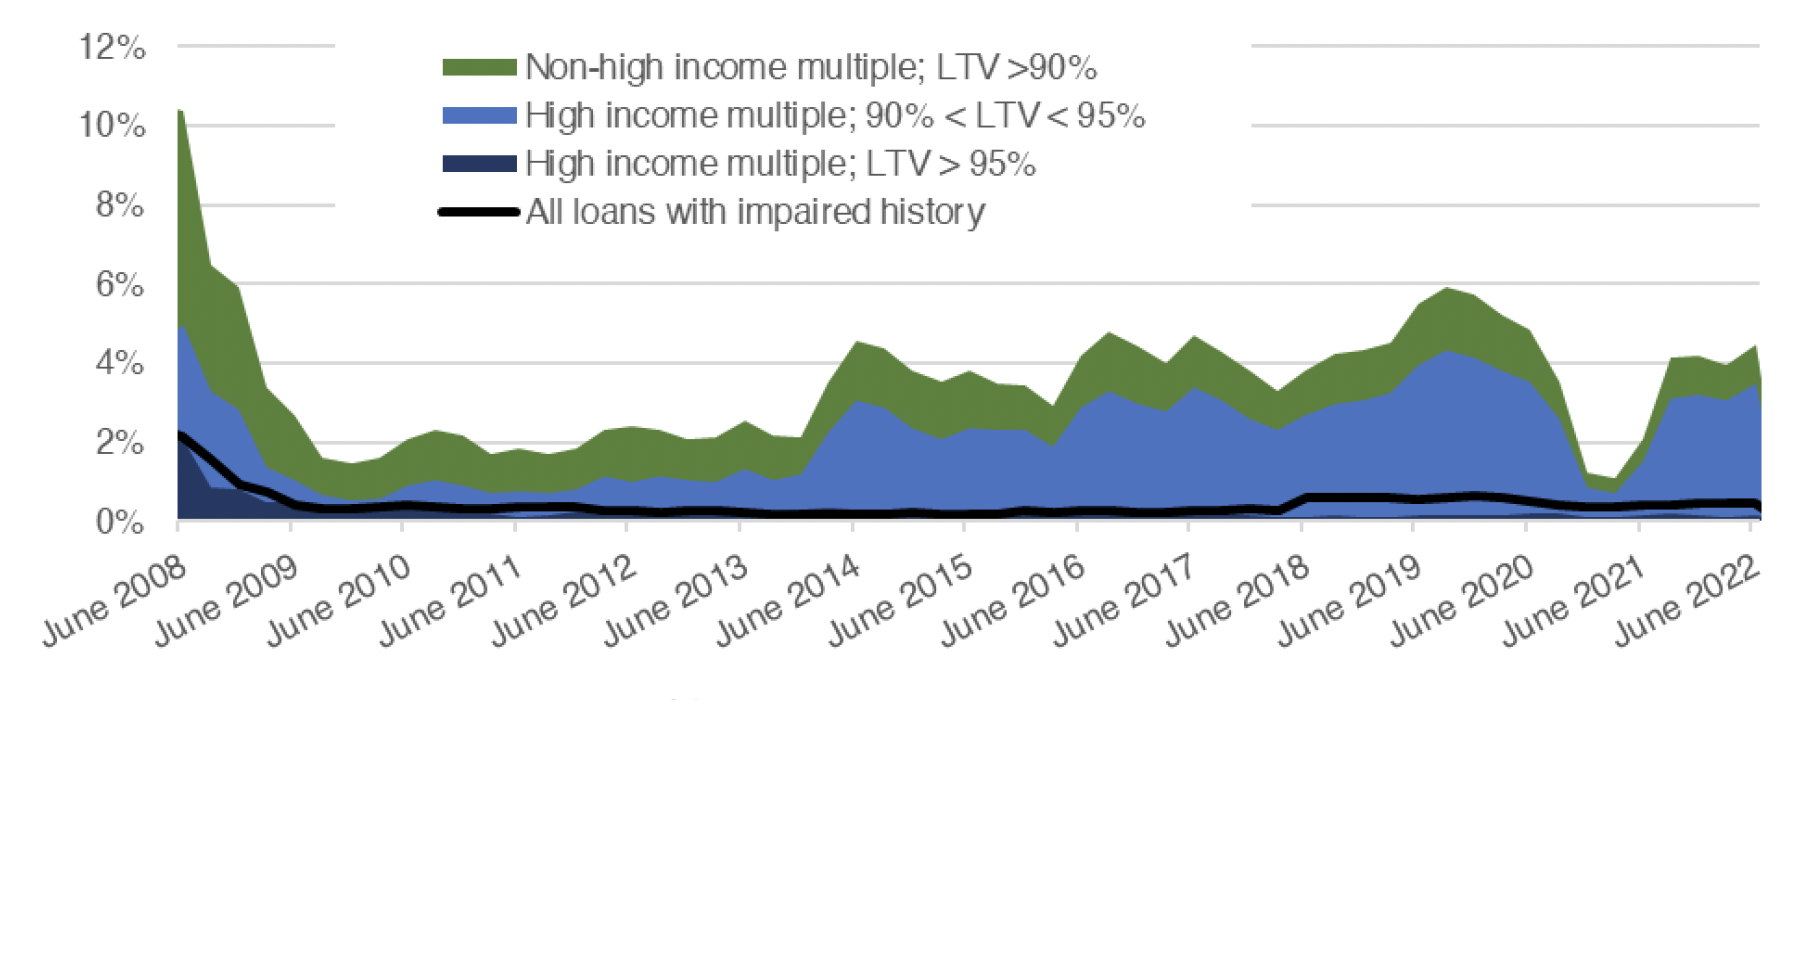
* Higher risk lending is classified by the FCA as an LTV over 90% and an income multiple greater than or equal to 3.5 for single income purchasers, or greater than or equal to 2.75 for joint income purchaser/s
Source: FCA
There was a substantial increase in the number of high LTV products offered by mortgage lenders after the Covid-19 pandemic, with the number of 95% LTV mortgages products increasing from 14 in September 2020 to 274 in September 2022. However, after the UKG Plan for Growth/mini-budget on 23 September 2022, the residential mortgage market saw a dramatic fall in the number of deals available to new borrowers over the month. The total number of residential mortgage products dropped to 2,258 in October. The fall of 1,632 from September 2022 marks the largest monthly drop in product numbers since April 2020 (2,030), when the market was struck by the COVID-19 pandemic. The fall in residential mortgages was seen to a greater extent in high LTV mortgages, exemplified by the number of 95% LTV mortgage products reaching 132 in October 2022, a decrease of more than 50% over the one month period. Furthermore, the decrease in high LTV mortgage products was more prominent in fixed rate mortgages, falling from 244 fixed rate, 95% LTV mortgage products in September 2022 to 105 in October 2022 (Source: Moneyfacts Mortgage Treasury Report).
Contact
Email: William.Ellison@gov.scot