Scottish Housing Market Review: Q3 2022
Scottish housing market bulletins collating a range of statistics on house prices, housing market activity, cost and availability of finance and repossessions
Part of
2. House Prices
National
Source: Registers of Scotland / UK HPI
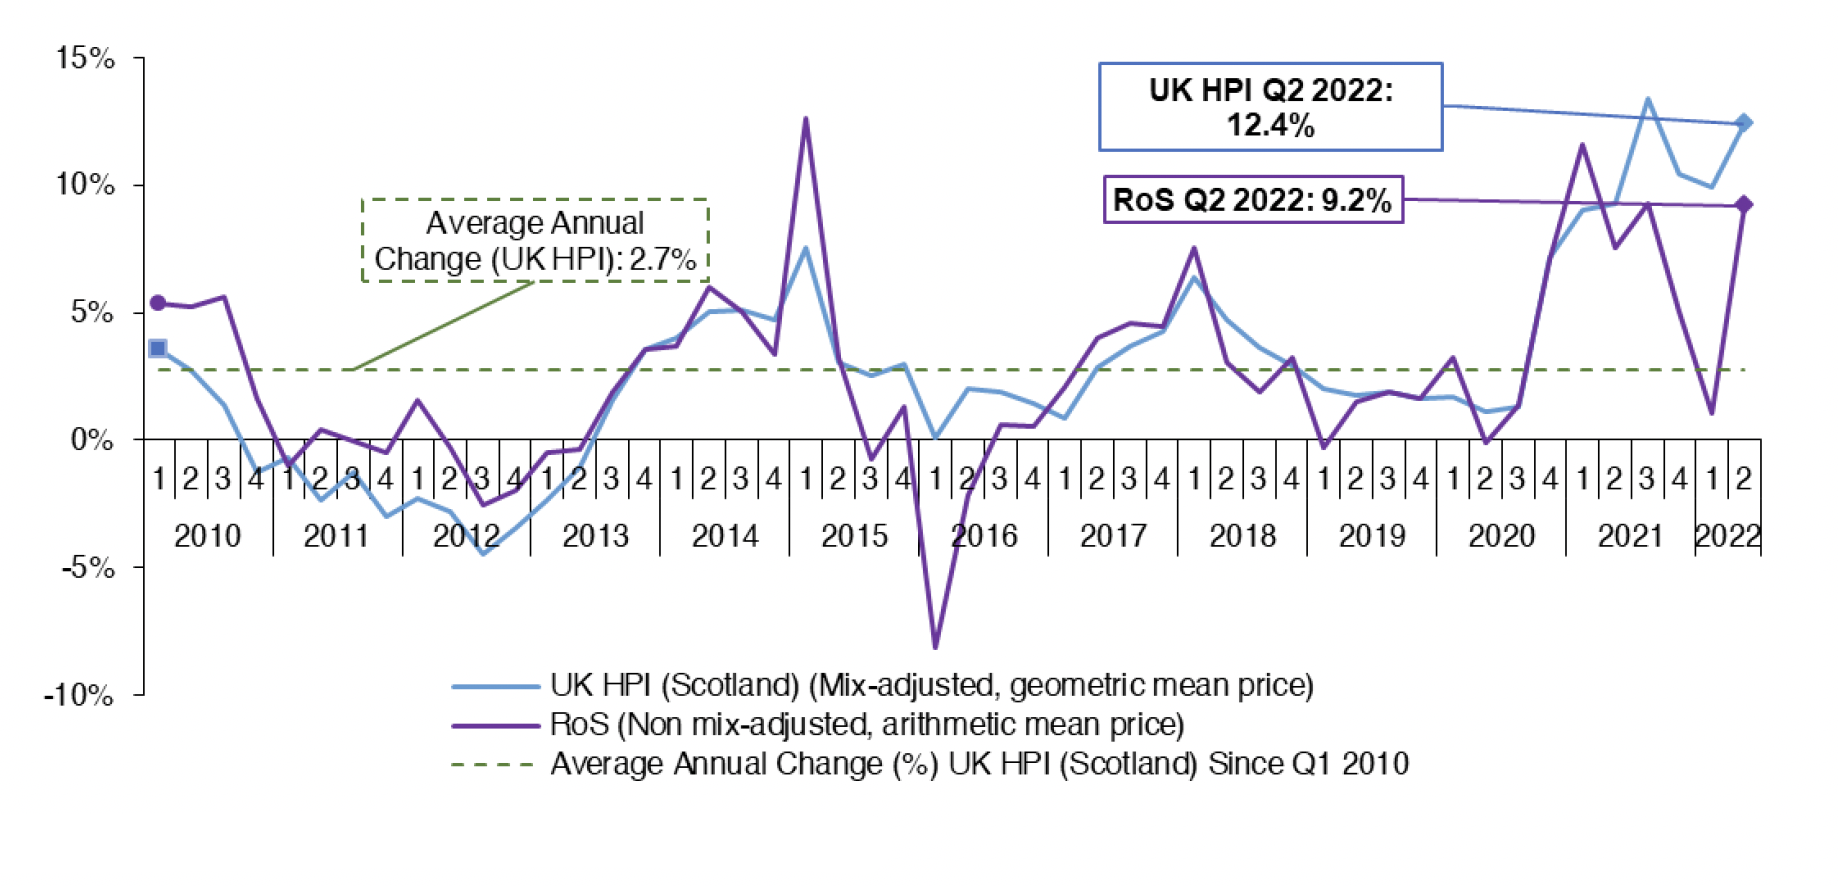
Scottish House Price Performance: National
Average house prices in Scotland, as measured by the UK HPI, increased in Q2 2022 by 12.4% relative to Q2 2021. Apart from annual house price growth in Q3 2021 of 13.4%, this is the highest quarter of house price inflation since Q1 2008, prior to the financial crisis. The average property price in Scotland stood at £188k in Q2 2022.
Data from Registers of Scotland shows a lower increase in annual house price inflation in Q2 2022, of 9.2%. Registers of Scotland data is not mix-adjusted, so it's likely to be affected by the composition of properties sold. This is supported by looking at the number of transactions in greater detail, with transactions for detached properties making up a smaller proportion of total transactions in Q2 2022 relative to Q1 2022.
UK HPI data shows that annual price growth to Q2 2022 was highest for detached properties (16.9%). Flats increased by the lowest amount, increasing by an annual 8.3%.
Scottish House Price Performance by Dwelling/Buyer Type
Chart 2.2 shows the rate of change in the average new and existing build property price in Scotland. This data is published with a lag relative to the headline HPI. In Q1 2022, the average Scottish new build property price increased to a greater extent than the existing build price, rising by 19.3% to £278K. The average existing build price rose by 8.8% to £176K.
The average price of new build properties is rising rapidly, with more recent monthly data for May 2022 showing an annual increase of 22.8%. This large increase is likely to be linked to the rise in the price of new build construction material (see Chart 10.3).
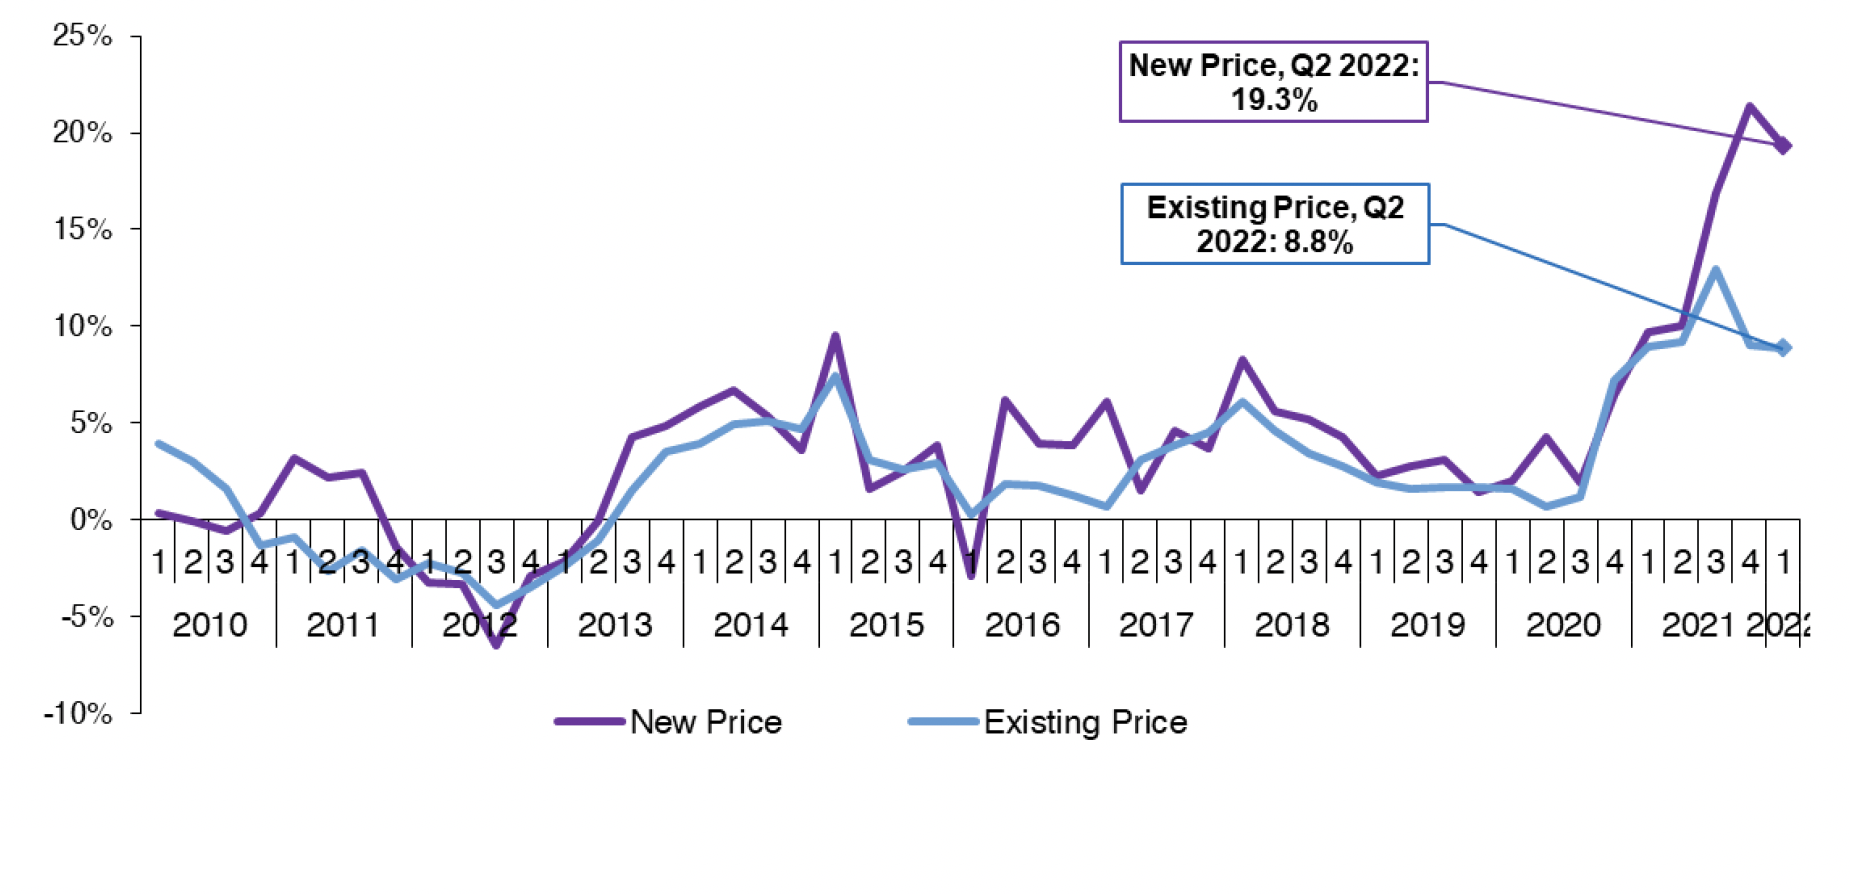
Source: UK HPI (Scotland)
The UK HPI also shows that the average price of a property bought by former owner occupiers in Scotland increased by an annual 13.5% in Q2 2022, to £228K. Meanwhile, the average price of a property purchased by a first-time buyer increased by an annual 11.3% in Q2 2022, to £151K.
Scottish House Price Performance: Regional
Registers of Scotland data show that house prices increased for all regions in Scotland in Q2 2022, although to a varying extent. The largest increase was in Argyll and Bute, Highlands and Islands, where house prices increased 14.6% annually to 216K (average arithmetic mean price; prices not mix-adjusted). The smallest increase was in Aberdeen/shire and Moray, which increased by 2.1% annually to £206K.
The longer-term trend (as measured by the change in house prices over the 4 quarter period to Q2 2022 over the previous four-quarter period) also shows that house price growth has been positive in all areas of Scotland. The strongest price growth was again seen in Argyll and Bute, Highlands and Islands, where house prices increased by 8.0%, whilst the smallest increase in house prices was seen in Aberdeen/shire and Moray, where house prices increased by 3.1%.
A summary of the average house price in Q2 2022 by Scottish region is included below. This also includes the annual change in the average house price in Q2 2022, as well as the annual change in the average house price using a rolling four quarter period to Q2 2022, which smooths out volatility in quarterly data (Source: Registers of Scotland).
Table 2.1 Regional house prices
Aberdeen/shire & Moray
Average Price – Q2 2022 £206K
12 Month Change 2.1%
Annual change (rolling 4 quarters) 3.1%
Edinburgh, Lothians & Borders
Average Price – Q2 2022 278K
12 Month Change 8.5%
Annual change (rolling 4 quarters) 6.3%
Argyll & Bute, Highland & Islands
Average Price – Q2 2022 £216K
12 Month Change 14.6%
Annual change (rolling 4 quarters) 8.0%
Forth Valley
Average Price – Q2 2022 £201K
12 Month Change 12.9%
Annual change (rolling 4 quarters) 4.0%
Ayrshires, Dumfries & Galloway
Average Price – Q2 2022 £163K
12 Month Change 9.6%
Annual change (rolling 4 quarters) 5.5%
Tayside & Fife
Average Price – Q2 2022 £192K
12 Month Change 8.3%
Annual change (rolling 4 quarters) 5.4%
Clyde Valley
Average Price – Q2 2022 £188K
12 Month Change 9.3%
Annual change (rolling 4 quarters) 5.6%
Scotland
Average Price – Q2 2022 £209K
12 Month Change 9.2%
Annual change (rolling 4 quarters) 5.7%
Source: Registers of Scotland
Contact
Email: William.Ellison@gov.scot