Scottish Housing Market Review: Q3 2022
Scottish housing market bulletins collating a range of statistics on house prices, housing market activity, cost and availability of finance and repossessions
Part of
10. Lending to House Builders, Insolvencies & Construction Prices
Lending to House Builders
The value of loans outstanding to UK firms involved in the construction of domestic dwellings rose by £1.9bn from February to March 2020, an increase of nearly one-third (31%), as shown in Chart 10.1. The sudden increase likely reflected the need for credit to fund short-term liabilities owing to Covid-19 restrictions on construction activities and home moves, which had adversely affected firms' income. In addition, firms may have drawn down funds as a precaution, given the economic uncertainty.
From May 2020 to September 2021 the value of loans steadily decreased, falling below pre-covid levels. However, the value of loans seems to have returned to pre-pandemic levels, with the value of outstanding loans for 2022 so far 0.8% below the same period in 2019, despite the sharp increase in construction material price inflation (compare Chart 10.3).
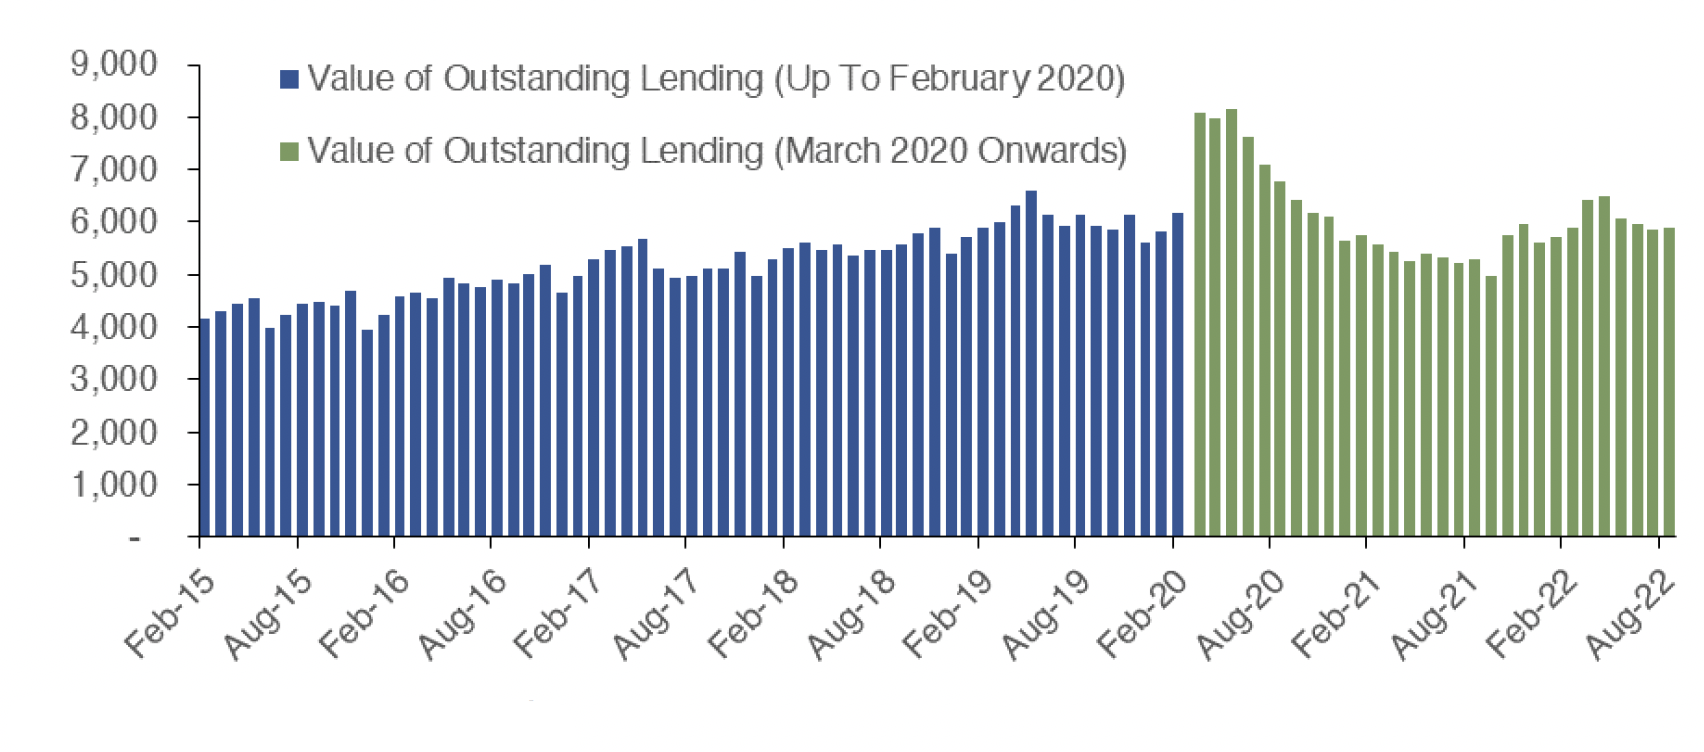
Source: Bank of England
Insolvencies
The health of construction firms can be identified by tracking the number of registered company insolvencies in the construction sector. Chart 10.2 outlines that during the pandemic insolvencies of construction companies registered in Scotland fell from 48 in Q1 2020 to 15 in Q1 2021, with a similar proportional fall evident for England and Wales, likely due to the business support in place. However, with this support unwinding and new build construction material prices increasing (as shown in Chart 10.3), insolvencies for construction companies registered in Scotland appear to have returned to pre-pandemic levels, with 45 insolvencies in Q2 2022, an increase of 36.4% on Q2 2021 but 10.9% below the 2016 – 2019 average for Q2. For construction companies registered in England and Wales, however, insolvencies have increased above pre-pandemic levels, with an annual increase of 74.0% on Q2 2021, reaching 1,039. This is also 46.2% above the 2016 – 2019 average for Q2. This is the second highest level of registered company insolvencies in England and Wales on record, only behind the level in Q1 2022 (1,044).
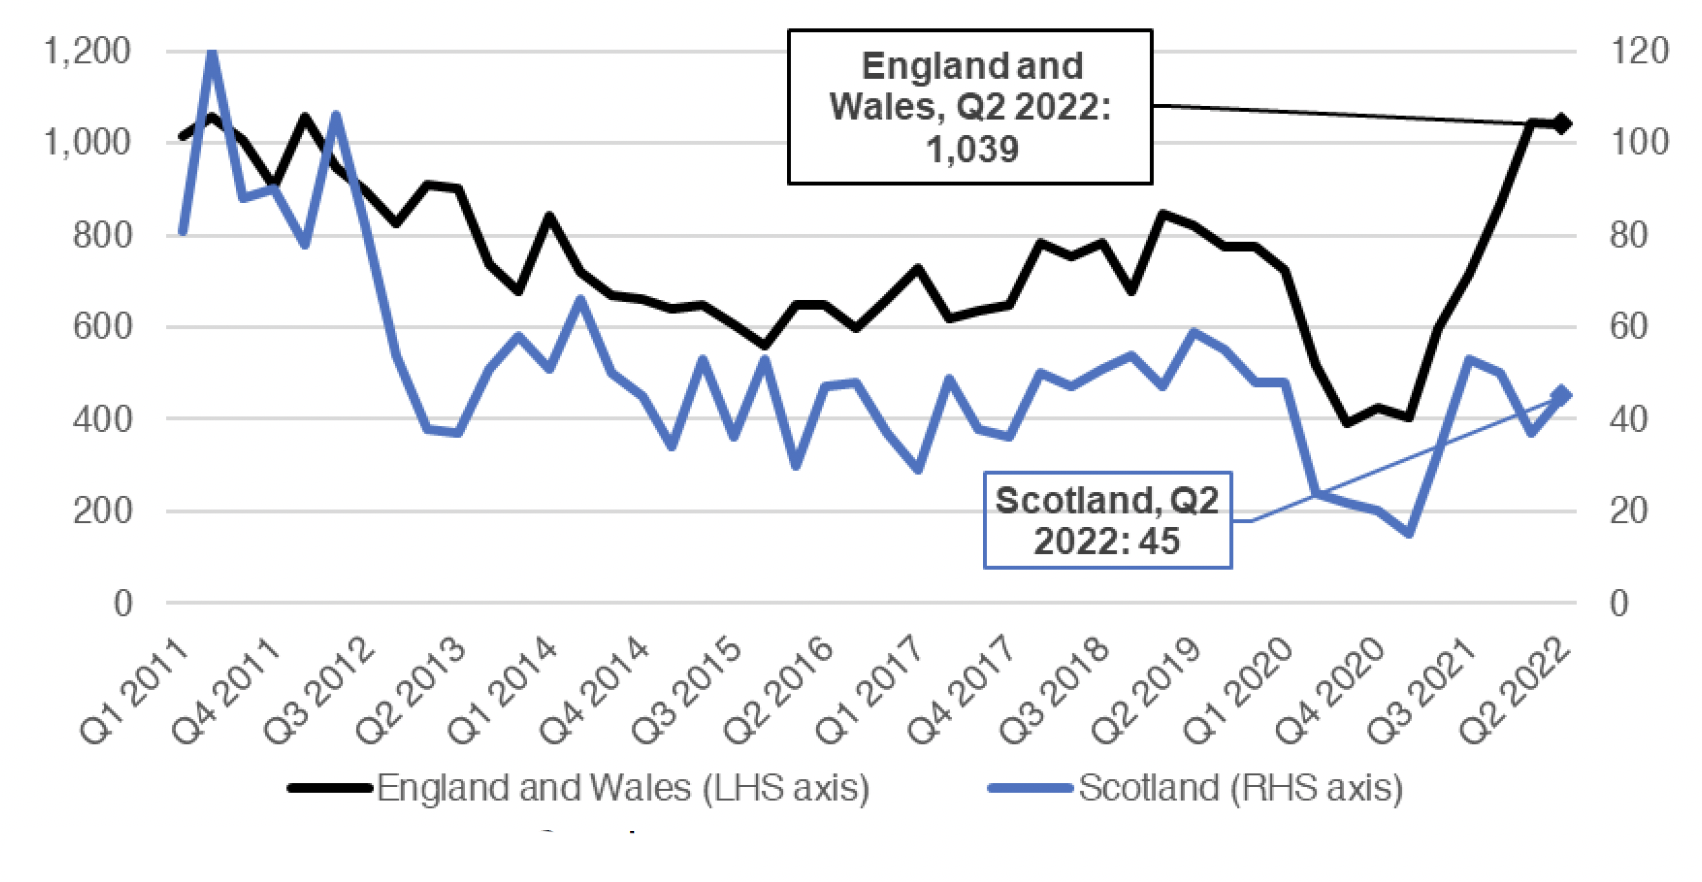
Source: The Insolvency Service
Construction Prices
Data from the ONS on the annual change in the output index price of new build housing (public and private), which covers the range of costs associated with building new public and private housing, shows an annual increase of 12.3% to June 2022. Data from BEIS on the cost of construction materials used in new house building shows that annual construction material price inflation, which stood at 22.8% to June 2022, is a key driver in the increase of the output price index of new build housing. This is outlined in Chart 10.3.
More recent data shows the annual increase in construction material prices has fallen since June 2022 to an annual 13.5% to August 2022, the first time the annual increase in construction material prices has fallen since Russia's invasion of Ukraine. The annual change has been driven in particular by gravel, sand, clays and kaolin, including aggregate levy (62.1%) and insulating material (+29.9%). The largest annual decrease in prices in August 2022 came from imported sawn or planed wood (-15.6%), imported plywood (-13.2%) and particle board (-9.1%).
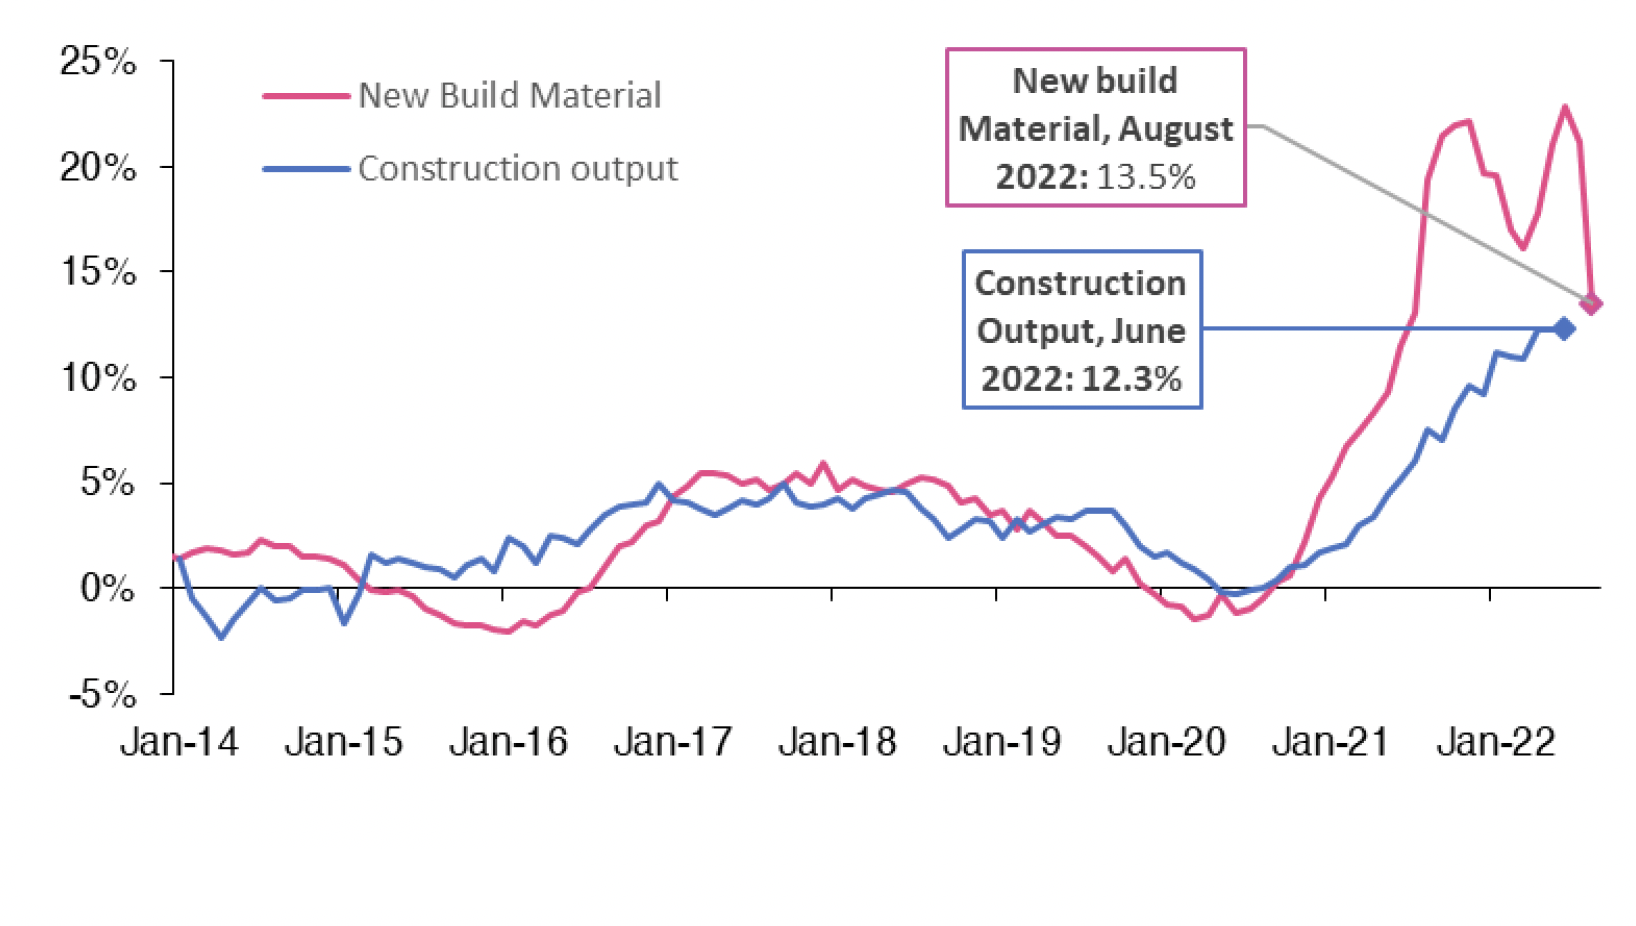
Source: ONS and BEIS
Contact
Email: William.Ellison@gov.scot