Scottish Household Survey 2020: methodology and impact of change in mode
The methodology report for the Scottish Household Survey 2020 telephone survey which discusses the impact of the change in mode.
Appendix 2: Corrective weighting
This appendix details the revised weighting approaches that were considered for the 2020 SHS.
The usual SHS weighting approach calibrates to published NRS mid-year household and population estimates by age and sex within local authorities. For full details on the usual SHS weighting approach and selection weighting, see the 2019 SHS methodology and fieldwork outcomes report[41].
The shift from face-to-face to remote interviewing was associated with a change in the profile of respondents – including a notable decrease in the proportion of respondents living in rented accommodation, and a corresponding increase in the proportion of owner occupiers. This is unlikely to be a genuine shift, and raises the question of whether alternative weighting strategies would assist in making the data more representative.
Non-response weighting is always problematic, because while we have a great deal of information about people who respond to the survey, we know very little about those who do not.
A calibration model for a survey should:
- Be simple, including as few variables as possible to avoid over-fitting the survey data to the model[42] and avoid having small groups with few or no respondents in them.
- Set calibration targets using known/accepted population totals that are independent of the survey being calibrated[43].
- Include variables for which non-response bias is apparent and that are associated with other measures in the survey.
Five different calibration models were considered.
Calibration model 1
The first calibration model considered was as close to the usual SHS calibration model as possible given the smaller sample sizes.
A household weight was created such that the population in households matched population estimates from the National Records of Scotland (NRS) for 2020[44] by age band (0 to 15, 16 to 34, 35 to 54, 55 to 64 and 65 or over) and sex[45] for each local authority, and by more detailed age bands (0 to 15, 16 to 24, 25 to 34, 35 to 44, 45 to 54, 55 to 64 and 65 or over) and sex nationally. An adjustment was then made such that the distribution of households by local authority matched household estimates from NRS for 2020[46].
A random adult weight was created such that the random adults who responded to the survey matched the NRS population estimates for 2020 by broad age band (16 to 64 and 65 or over) and sex for each local authority, and by more detailed age band (16 to 24, 25 to 34, 35 to 44, 45 to 54, 55 to 64 and 65 to 74 and 75 and over) and sex nationally.
A random schoolchild weight was created such that the randomly selected schoolchildren in the survey matched an estimate of schoolchildren using the NRS population estimates for 2020 and SHS data[47] by local authority and by age band (4 to 6, 7 to 9, 10 to 12 and 13 or over) nationally.
Calibration model 2
The first calibration model did not explicitly take steps to account for differential non-response by deprivation and rurality, which was more apparent in 2020 than in previous years (see Chapter 4). Therefore, the second calibration model we considered extended the first one to include the Scottish Index of Multiple Deprivation (SIMD) and Urban Rural Classification.
A household weight was created such that all the constraints of the first calibration model were met, and the population in responding households and the households themselves matched small area population[48] and household[49] estimates from the NRS for 2020 by SIMD quintile (quintile 1, quintiles 2 to 4 combined and quintile 5) by local authority, and Urban Rural Classification (Large/other urban areas and all other areas combined) by local authority.
Weights for the random adult and random schoolchild were created in a similar way, by including calibration totals based on SIMD quintile and Urban Rural Classification
Calibration model 3
The third calibration model extended the second one. A constraint was added to ensure that households, adults and school children matched percentage estimates by household tenure (owner occupied households and all other tenures combined) and local authority from the Scottish Survey Core Questions (SSCQ) 2019[50].
We considered a calibration model that included household tenure in an attempt to resolve the over representation of owner occupied households and under representation of rented households in the achieved sample as discussed in Chapter 5. Figures A2.1 and A2.2 compare the SHS estimates for the size of the Social Rented Sector and the Private Rented Sector against estimates from administrative data. They also show the difference in estimates between calibration model 2 and 3 for the 2020 data. These show that the estimates using the weights from model 3 are more plausible than model 2.
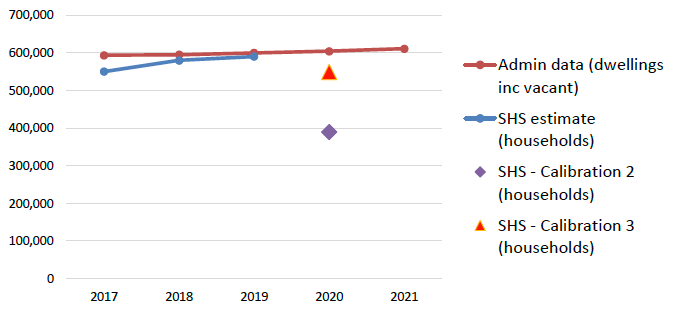
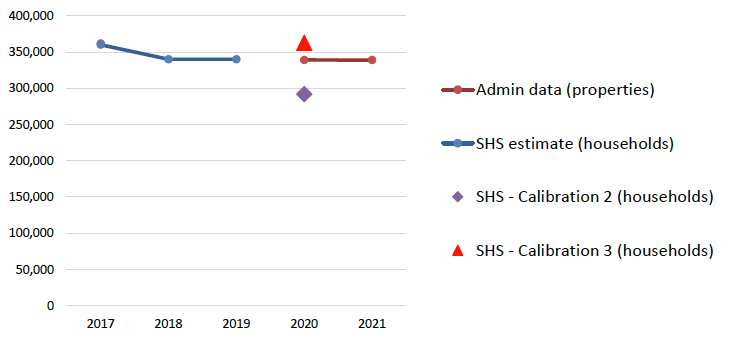
We acknowledge that it is not best practice to calibrate a survey against itself. Since the SHS is a major component of the SSCQ, this is effectively what we were doing by calibrating to estimates of household tenure from the SSCQ 2019. However, due to the lack of complete administrative data or data from a recent census on household tenure, there was no ideal alternative if we wished to consider a calibration model that included household tenure. Furthermore, the available administrative data on social housing stock from social landlords and on private rented properties from the Landlord Registration System indicates that the number of households in the social rented and private rented sectors are likely to have remained at relatively similar levels across the 2020 period compared to 2019, with the number of social rented dwellings expected to have seen a slight increase in 2020 due to the increase in recent years in the level of new affordable housing along with the ending of the Right to Buy scheme. This provides justification and reassurance for this calibration model.
The SSCQ 2019 was chosen over the 2019 SHS as the source of calibration targets for household tenure as estimates from the SSCQ are from a larger (pooled) sample and have smaller confidence intervals.
Calibration model 4
The fourth calibration model also extended the second one. A constraint was added to ensure that households, adults and school children matched estimates by dwelling type (houses and all other dwelling types combined) and local authority from the 2019 SHS[52].
Although houses are over represented in the achieved sample relative to flats and other dwelling types, the extent of the bias is not as pronounced as it is for household tenure. We did not, therefore, consider a calibration model that included dwelling type primarily to reduce the apparent bias in dwelling type. Household tenure is associated with dwelling type, and it was hoped by including dwelling type in the calibration model that this would reduce the bias in household tenure. If this were to prove to be the case, it may have been possible to use administrative data on dwelling type by local authority in the calibration model and avoid having to calibrate the survey using a previous wave of itself.
Calibration model 5
The fifth calibration model was also an extension of the second one. A constraint was added to ensure that, when weighted, the ratio of the opt-in only sample to the telephone matched sample was 72:28 (18:7).
This calibration model was considered in the hope that it would adjust for the over-representation of telephone matched households in the achieved sample, due to their higher response rate. In general, the estimates from the telephone matched sample are substantially further from the benchmark 2019 (or 2018) figures than those from the opt-in only sample (see Chapter 5). The reasons for this include the under-representation in the telephone matched sample of younger households, those in social rented and private rented housing, and those who have lived in their current address for a short period of time. Therefore, giving more weight to the opt-in only sample could reduce this bias.
The ratio was set such that the samples were weighted in proportion to the inverse of their response rates. The response rates were 37.1% for the telephone matched sample and 14.5% the opt-in only sample (see Table 4.7).
Comparison of the models
We used these five calibration models to produce five sets of weights. These weights were then used to produce estimates for a selection of household and random adult questions asked in the survey. These estimates are provided in Tables A2.1 to A2.4, and are compared with benchmark estimates from 2019 (or 2018 for the biennial questions).
| 2019 | Model 1 | Diff (-2019) | Model 2 | Diff (-2019) | Model 3 | Diff (-2019) | Model 4 | Diff (-2019) | Model 5 | Diff (-2019) | |
|---|---|---|---|---|---|---|---|---|---|---|---|
| Urban/rural indicator | |||||||||||
| Large Urban | 35% | 35% | -1% | 35% | 0% | 35% | 0% | 35% | 0% | 35% | 0% |
| Other Urban | 35% | 33% | -3% | 36% | 1% | 36% | 1% | 36% | 1% | 36% | 1% |
| Accessible Small Towns | 9% | 10% | 2% | 9% | 0% | 9% | 0% | 9% | 0% | 9% | 0% |
| Remote Small Towns | 4% | 3% | -1% | 3% | -1% | 2% | -1% | 3% | -1% | 3% | -1% |
| Accessible Rural | 11% | 13% | 3% | 11% | 0% | 12% | 1% | 11% | 0% | 11% | 1% |
| Remote Rural | 6% | 7% | 1% | 6% | 0% | 6% | 0% | 6% | 0% | 6% | 0% |
| SIMD Quintile | |||||||||||
| Most deprived | 21% | 15% | -6% | 21% | 0% | 21% | 0% | 21% | 0% | 21% | 0% |
| 2nd | 21% | 17% | -4% | 17% | -4% | 18% | -3% | 17% | -4% | 16% | -4% |
| Middle quintile | 20% | 20% | 0% | 19% | -1% | 19% | -1% | 19% | -1% | 19% | -1% |
| 4th | 20% | 26% | 6% | 25% | 6% | 23% | 4% | 25% | 6% | 25% | 6% |
| Least deprived | 19% | 23% | 4% | 18% | -1% | 18% | -1% | 18% | -1% | 18% | -1% |
| 2019 | Model 1 | Diff (-2019) | Model 2 | Diff (-2019) | Model 3 | Diff (-2019) | Model 4 | Diff (-2019) | Model 5 | Diff (-2019) | |
|---|---|---|---|---|---|---|---|---|---|---|---|
| Tenure | |||||||||||
| Owner-occupied | 62% | 74% | 13% | 72% | 10% | 62% | 1% | 71% | 9% | 71% | 10% |
| Social Rented | 24% | 14% | -10% | 16% | -8% | 22% | -2% | 17% | -7% | 16% | -8% |
| Private Rented | 14% | 11% | -3% | 12% | -2% | 14% | 1% | 12% | -2% | 12% | -2% |
| Other | 1% | 1% | 0% | 1% | 0% | 1% | 0% | 1% | 0% | 1% | 0% |
| Length of time at address[53] | |||||||||||
| Less than a year | 11% | 8% | -3% | 8% | -3% | 9% | -2% | 8% | -3% | 8% | -3% |
| 1-3 years | 20% | 20% | 0% | 21% | 1% | 21% | 1% | 21% | 1% | 22% | 2% |
| 4-15 years | 35% | 34% | -2% | 34% | -1% | 35% | 0% | 34% | -1% | 35% | 0% |
| Over 15 years | 34% | 38% | 4% | 37% | 3% | 36% | 2% | 37% | 3% | 35% | 1% |
| Property type | |||||||||||
| House | 66% | 70% | 4% | 68% | 2% | 66% | 0% | 66% | 0% | 67% | 1% |
| Flat | 34% | 30% | -4% | 32% | -2% | 34% | 0% | 34% | 0% | 33% | -1% |
| Other | 1% | 0% | -1% | 0% | 0% | 0% | 0% | 0% | 0% | 0% | 0% |
| Household type | |||||||||||
| Single adult | 20% | 16% | -5% | 17% | -4% | 18% | -3% | 17% | -4% | 17% | -3% |
| Small adult | 20% | 19% | -1% | 19% | -1% | 18% | -2% | 18% | -2% | 19% | -1% |
| Single parent | 4% | 4% | -1% | 4% | 0% | 4% | 0% | 4% | 0% | 4% | -1% |
| Small family | 13% | 14% | 2% | 14% | 1% | 13% | 1% | 14% | 2% | 14% | 1% |
| Large family | 5% | 6% | 1% | 7% | 2% | 7% | 2% | 7% | 2% | 7% | 2% |
| Large adult | 9% | 12% | 3% | 12% | 3% | 11% | 2% | 12% | 3% | 11% | 2% |
| Older smaller | 14% | 16% | 3% | 16% | 2% | 15% | 2% | 15% | 2% | 15% | 2% |
| Single pensioner | 14% | 12% | -2% | 12% | -2% | 13% | -1% | 13% | -2% | 13% | -2% |
| Household working status | |||||||||||
| Single working adult | 20% | 16% | -3% | 17% | -3% | 17% | -3% | 17% | -3% | 17% | -3% |
| Non-working single | 26% | 22% | -5% | 22% | -4% | 25% | -2% | 23% | -3% | 23% | -3% |
| Working couple | 30% | 34% | 4% | 34% | 4% | 32% | 2% | 33% | 3% | 33% | 3% |
| Couple, one works | 10% | 13% | 2% | 12% | 2% | 13% | 2% | 12% | 2% | 12% | 1% |
| Couple, neither work | 14% | 15% | 2% | 15% | 1% | 14% | 1% | 15% | 1% | 15% | 1% |
| Net annual household income | |||||||||||
| GBP 0 to GBP 10,000 | 8% | 6% | -2% | 7% | -2% | 7% | -1% | 7% | -2% | 7% | -2% |
| GBP 10,001 to GBP 20,000 | 27% | 20% | -7% | 20% | -6% | 23% | -4% | 21% | -6% | 21% | -6% |
| GBP 20,001 to GBP 30,000 | 21% | 21% | 0% | 22% | 0% | 21% | 0% | 22% | 0% | 22% | 0% |
| GBP 30,001 to GBP 40,000 | 15% | 17% | 1% | 16% | 1% | 16% | 1% | 16% | 1% | 16% | 1% |
| GBP 40,001 and above | 28% | 36% | 8% | 35% | 7% | 33% | 4% | 34% | 6% | 34% | 6% |
| Whether struggling financially | |||||||||||
| Struggling financially | 9% | 6% | -3% | 7% | -2% | 8% | -1% | 7% | -2% | 7% | -2% |
| Satisfaction with housing | |||||||||||
| Very/fairly satisfied | 90% | 94% | 4% | 94% | 4% | 94% | 4% | 94% | 4% | 94% | 4% |
| 2019 | Model 1 | Diff (-2019) | Model 2 | Diff (-2019) | Model 3 | Diff (-2019) | Model 4 | Diff (-2019) | Model 5 | Diff (-2019) | |
|---|---|---|---|---|---|---|---|---|---|---|---|
| HIH Banded age | |||||||||||
| 16-24 | 5% | 2% | -2% | 2% | -2% | 3% | -2% | 2% | -2% | 2% | -2% |
| 25-44 | 30% | 31% | 0% | 31% | 1% | 30% | 0% | 30% | 0% | 31% | 0% |
| 45-59 | 29% | 29% | 0% | 30% | 1% | 30% | 1% | 30% | 2% | 30% | 1% |
| 60+ | 36% | 38% | 2% | 37% | 1% | 37% | 1% | 37% | 1% | 37% | 1% |
| HIH Gender | |||||||||||
| Man/Boy | 58% | 58% | 1% | 58% | 0% | 58% | 0% | 58% | 0% | 58% | 0% |
| Woman/Girl | 42% | 42% | -1% | 42% | 0% | 42% | 0% | 42% | 0% | 42% | 0% |
| HIH Economic status | |||||||||||
| Self employed | 7% | 6% | -1% | 6% | -1% | 6% | -1% | 6% | -1% | 6% | -1% |
| Employed full time | 44% | 47% | 4% | 47% | 3% | 46% | 2% | 47% | 3% | 46% | 3% |
| Employed part time | 7% | 7% | 0% | 7% | 0% | 7% | 0% | 7% | 0% | 7% | 0% |
| Looking after the home/family | 2% | 1% | -1% | 1% | -1% | 1% | -1% | 1% | -1% | 1% | -1% |
| Retired from work | 28% | 30% | 1% | 29% | 1% | 29% | 1% | 29% | 1% | 30% | 1% |
| Unemployed | 2% | 3% | 0% | 3% | 1% | 4% | 1% | 3% | 1% | 3% | 1% |
| In further/higher education | 3% | 2% | -1% | 2% | -1% | 2% | -1% | 2% | -1% | 2% | -1% |
| Permanently sick or disabled | 5% | 3% | -2% | 4% | -1% | 4% | -1% | 4% | -1% | 4% | -1% |
| Short-term illness or injury | 1% | 1% | 0% | 1% | 0% | 1% | 0% | 1% | 0% | 1% | 0% |
| 2019 | Model 1 | Diff (-2019) | Model 2 | Diff (-2019) | Model 3 | Diff (-2019) | Model 4 | Diff (-2019) | Model 5 | Diff (-2019) | |
|---|---|---|---|---|---|---|---|---|---|---|---|
| Banded age | |||||||||||
| 16-24 | 11% | 12% | 1% | 12% | 1% | 12% | 1% | 12% | 1% | 12% | 1% |
| 25-44 | 33% | 31% | -2% | 31% | -2% | 31% | -2% | 31% | -2% | 31% | -2% |
| 45-59 | 26% | 24% | -2% | 24% | -2% | 24% | -2% | 24% | -2% | 24% | -1% |
| 60+ | 30% | 32% | 2% | 32% | 2% | 32% | 2% | 32% | 2% | 32% | 1% |
| Gender | |||||||||||
| Man/Boy | 48% | 48% | 0% | 49% | 0% | 48% | 0% | 48% | 0% | 49% | 0% |
| Woman/Girl | 52% | 51% | 0% | 51% | 0% | 51% | 0% | 51% | 0% | 51% | 0% |
| Ethnicity | |||||||||||
| White Scottish/British | 89% | 90% | 1% | 90% | 1% | 90% | 1% | 90% | 1% | 90% | 1% |
| White other[54] | 7% | 5% | -1% | 5% | -2% | 6% | -1% | 5% | -1% | 5% | -1% |
| Minority ethnic groups[55] | 4% | 4% | 0% | 4% | 0% | 5% | 0% | 4% | 0% | 5% | 0% |
| Highest educational attainment | |||||||||||
| None | 15% | 10% | -5% | 11% | -4% | 12% | -3% | 11% | -4% | 11% | -5% |
| Level 1 - O grade etc | 17% | 13% | -4% | 14% | -4% | 14% | -3% | 14% | -4% | 13% | -4% |
| Level 2 - Higher, A | 17% | 19% | 2% | 19% | 2% | 19% | 2% | 19% | 2% | 19% | 2% |
| Level 3 - HNC/HND | 13% | 13% | 0% | 13% | 0% | 13% | 0% | 13% | 0% | 13% | 0% |
| Degree or prof qual | 32% | 41% | 9% | 40% | 8% | 38% | 6% | 40% | 8% | 41% | 9% |
| Other qualification | 5% | 3% | -2% | 3% | -2% | 3% | -2% | 3% | -2% | 3% | -2% |
| General health | |||||||||||
| General health bad or very bad | 8% | 5% | -4% | 6% | -3% | 7% | -2% | 6% | -3% | 6% | -3% |
| Disability | |||||||||||
| Disabled | 24% | 22% | -3% | 23% | -1% | 25% | 1% | 23% | -1% | 23% | -1% |
| Non-disabled | 75% | 78% | 3% | 77% | 2% | 75% | -1% | 76% | 1% | 77% | 1% |
| Greenspace | |||||||||||
| Within 5 mins of greenspace | 66% | 68% | 3% | 68% | 2% | 67% | 2% | 67% | 2% | 68% | 3% |
| Personal use of the internet | |||||||||||
| Used internet for personal use | 87% | 92% | 5% | 92% | 4% | 91% | 3% | 91% | 4% | 92% | 5% |
| Culture and Heritage | |||||||||||
| Cultural attendance | 81% | 45% | -36% | 44% | -37% | 44% | -37% | 44% | -37% | 45% | -36% |
| Cultural participation | 75% | 84% | 9% | 83% | 8% | 82% | 7% | 83% | 8% | 84% | 8% |
| Cultural engagement | 90% | 87% | -3% | 86% | -4% | 86% | -5% | 86% | -4% | 87% | -4% |
| Physical Activity and Sport | |||||||||||
| Participated in sport in last 4 weeks | 80% | 87% | 7% | 86% | 6% | 85% | 5% | 86% | 6% | 86% | 7% |
| Discrimination and Harassment | |||||||||||
| Experienced either discrimination or harassment | 9% | 8% | -1% | 8% | -1% | 9% | -1% | 9% | -1% | 9% | -1% |
| Satisfaction with local services | |||||||||||
| Satisfied with local health services (excluding no opinion) | 80% | 88% | 9% | 88% | 9% | 88% | 8% | 88% | 9% | 88% | 9% |
| Satisfied with local schools (excluding no opinion) | 73% | 78% | 5% | 78% | 5% | 78% | 5% | 78% | 5% | 78% | 4% |
| Satisfied with public transport (excluding no opinion) | 68% | 69% | 1% | 70% | 2% | 70% | 2% | 70% | 2% | 69% | 2% |
| Satisfied with all three services (no opinion for up to two) | 53% | 60% | 7% | 61% | 8% | 60% | 8% | 61% | 8% | 60% | 8% |
| Outdoors | |||||||||||
| One+ visits to the outdoors | 56% | 80% | 24% | 79% | 23% | 77% | 21% | 79% | 23% | 79% | 23% |
| Social capital | |||||||||||
| Feels lonely some, most, almost all or all of the time[56] | 21% | 34% | 13% | 35% | 13% | 36% | 15% | 36% | 15% | 35% | 14% |
| Meets socially at least once a week[57] | 73% | 43% | -30% | 43% | -30% | 42% | -30% | 43% | -29% | 43% | -30% |
| Volunteering | |||||||||||
| Volunteered | 26% | 26% | 0% | 26% | 0% | 25% | -1% | 25% | -1% | 26% | 0% |
| Provided unpaid help to improve their local environment[58] | 4% | 8% | 4% | 8% | 3% | 7% | 3% | 8% | 3% | 8% | 4% |
| Rating of neighbourhood | |||||||||||
| Rating of neighbourhood as very good | 57% | 62% | 5% | 59% | 2% | 58% | 1% | 59% | 2% | 59% | 2% |
| Rating of neighbourhood as fairly good | 37% | 35% | -2% | 37% | 0% | 38% | 1% | 37% | 0% | 37% | 0% |
| Community belonging | |||||||||||
| Very/fairly strong feeling on belonging to immediate neighbourhood | 78% | 81% | 4% | 81% | 3% | 80% | 2% | 80% | 3% | 80% | 2% |
| Agreement with statements about local neighbourhood | |||||||||||
| If I was alone and needed help, I could rely on someone in this neighbourhood to help me | 85% | 88% | 3% | 88% | 2% | 86% | 1% | 87% | 2% | 87% | 2% |
| If my home was empty, I could count on someone in this neighbourhood to keep an eye on my home | 85% | 88% | 3% | 88% | 3% | 86% | 1% | 87% | 2% | 87% | 2% |
| I feel I could turn to someone in this neighbourhood for advice or support | 78% | 81% | 2% | 80% | 2% | 78% | 0% | 80% | 1% | 80% | 1% |
| In an emergency, I would offer to help people in my neighbourhood who might not be able to cope well | 90% | 92% | 3% | 92% | 2% | 91% | 1% | 92% | 2% | 92% | 2% |
| This is a neighbourhood where people are kind to each other | 83% | 90% | 7% | 89% | 6% | 88% | 6% | 89% | 6% | 89% | 6% |
| This is a neighbourhood where most people can be trusted | 79% | 85% | 7% | 84% | 5% | 82% | 4% | 83% | 5% | 84% | 5% |
| There are welcoming places and opportunities to meet new people | 52% | 54% | 3% | 54% | 2% | 54% | 2% | 54% | 2% | 54% | 2% |
| There are places where people can meet up and socialize | 57% | 61% | 4% | 61% | 4% | 61% | 4% | 62% | 5% | 61% | 4% |
| This is a neighbourhood where people from different backgrounds get on well together | 69% | 77% | 7% | 77% | 8% | 76% | 6% | 76% | 7% | 76% | 7% |
| This is a neighbourhood where local people take action to help improve the neighbourhood | 57% | 68% | 11% | 67% | 10% | 65% | 8% | 66% | 9% | 67% | 10% |
| I can influence decisions affecting my local area | 18% | 24% | 7% | 25% | 7% | 25% | 7% | 24% | 7% | 25% | 7% |
Table A2.1 shows that all calibration models except for the first one (which does not include Urban Rural Classification and SIMD) correct for the under-representation of households from urban and deprived areas. As many survey measures are likely to be associated with rurality and deprivation, it is important to correct for the under-representation of these households.
For household and HIH measures, generally all calibration models brought most estimates into line with the benchmark estimates from 2019 (see Tables A2.2 and A2.3). One exception to this was household tenure (see Table A2.2). Only the third calibration model, which includes SSCQ 2019 estimates of household tenure, produced (by constraint) a household tenure profile that was plausible in comparison to that from the 2019 SHS.
For random adult measures, generally all calibration models also brought most estimates into line with the benchmark estimates from 2019 or, for biennial questions, 2018 (see Table A2.4). However, there were some random adult measures (e.g. highest educational attainment, satisfaction with local health services, cultural attendance and visits to the outdoors) with large differences compared to the benchmark estimates from 2019.
The substantial changes in cultural attendance and visits to the outdoors are likely to be due to the pandemic. The increase in satisfaction with local health services could be genuine, resulting from the increased appreciation for the NHS that we have seen during the pandemic. But it could also be driven, at least in part, by the change in mode, and/or by non-response bias (i.e. people who chose to take part in 2020, despite interviewers not being able to persuade them face to face to take part, might tend to be generally more positive people than respondents in previous years).
The increase in respondents with a degree or professional qualification is likely to be due to a different pattern of non-response compared to previous years. We could have considered a calibration model that included highest educational attainment, as we have done for household tenure. However, it is unlikely this would have much if any impact on the changes seen in other random adult measures (e.g. satisfaction with local health services, cultural attendance and visits to the outdoors), as the changes in the measures are generally consistent across attainment levels.
Except for measures included in the calibration models (e.g. household tenure), the calibration models produced similar results for all household and random adult measures. It is likely that the calibration models produced similar results because of associations between the variables used in the models. For example, household tenure is associated with age, deprivation, dwelling type and rurality. Measures associated with household tenure are also likely to be associated with age, deprivation, dwelling type and rurality.
However, though household tenure is associated with age, deprivation, dwelling type and rurality, including these variables in the calibration models did not correct for the over-representation of owner occupied households in the sample relative to private and social rented households. This is because this over-representation is generally consistent across all ages, levels of deprivation, dwelling types and rurality. The only way to correct for this over-representation via calibration is to consider a calibration model that includes household tenure. Furthermore, a separate assessment undertaken for measures related to housing, focussing on the second and third calibration models, showed that the third model (calibrated to household tenure) appears to give some more feasible looking results compared with the second model when looking across a range of housing related measures such as dwelling type, number of bedrooms, housing views and aspirations, and households on a housing list. This supports the use of the weights produced by the third calibration model when reporting on housing related measures for 2020.
Re-weighting 2019 data based on new approach
For quality assurance, the 2019 SHS was re-weighted using the second calibration model and it was found that this generally made very little difference to any estimates. Full details are not provided here but are available upon request.
Conclusions
Since all calibration models produced similar results for non-housing related measures, we opted to weight the non-housing related results presented in the key findings report using the second calibration model. This is similar to the usual SHS calibration model, with the addition of Urban Rural Classification and SIMD to address the more pronounced under-representation of households from urban and deprived areas than in previous years. With these additions, it is similar to the model used to weight the results from the 2020 Scottish Health Survey telephone survey[59]. All of the calibration targets for this model are sourced from NRS population and household estimates.
The only other calibration model that merited consideration was the third one, which included SSCQ 2019 estimates of household tenure. The obvious benefit of this model over the second one is that it brings housing related measures, e.g. tenure, dwelling type, number of bedrooms, housing views and aspirations, and households on a housing list, more into line with estimates from the 2019 SHS. Therefore, we opted to weight the housing results presented in the key findings report using this calibration model.
It is worth noting that as the third calibration model contains more constraints than the second calibration model, it produces weights that are more extreme/have more variation and this results in slightly larger design effects[60] and confidence intervals. Therefore, we felt it was best to use the third calibration model only when the non-response bias in household tenure that was being corrected was also having a corrective effect on other measures associated with tenure. This was most notable for housing related measures and less so for non-housing related measures.
Contact
Email: shs@gov.scot