Scottish COVID-19 Mental Health Tracker Study: Wave 4 Report
Wave 4 findings (data collected between 4 February and 9 March 2021.) indicate that young adults, women, people with physical and/or mental health conditions, and people in a lower socio-economic group are more likely to report experiencing poor mental health.
3. Wave 4 COVID-19 Contextual Factors
This section provides a summary of respondents' experiences of, and views on COVID-19 between the 4th February and 9th March 2021 during a UK-wide lockdown. This section assesses people's experiences during this phase of lockdown restrictions in order to provide an understanding of the context in which respondents were living while they responded to the mental health and wellbeing focussed questions in the Wave 4 SCOVID questionnaire. Tracking these contextual factors is useful in understanding whether particular factors are correlated with certain mental health outcomes as findings from subsequent waves of this tracker study are gathered. Comparison to previous waves will not be made in this section, however corresponding data can be found in section 4 of the previous reports (Wave 1, Wave 2, Wave 3).
3.1 COVID-19 related experiences
Of the Wave 4 sample, 2.6% of respondents reported that they had been diagnosed with COVID-19, and 6.7% reported that they had not been diagnosed but suspected they had contracted COVID-19. Over three quarters of this group (81.2%) reported self-isolating as a result of their symptoms. The majority of respondents who were either diagnosed with or suspected they had COVID-19 reported having it over 6 months ago (64.8%). Around a quarter (26.9%) of respondents who have had COVID-19 reported experiencing 'Long COVID'. A third (33.2%) of respondents reported that they knew someone diagnosed with COVID-19 and 5.5% of respondents reported having lost friends or family members to COVID-19.
Attitudes to COVID-19 vaccination
At the time of the Wave 4 survey, just under a third (30.7%) of respondents reported having been offered a vaccine, and over half of those offered (66.4%) had received at least a first vaccine dose.
Respondents were asked to indicate up to three reasons for taking a COVID-19 vaccine. Of respondents who planned to take a vaccine, the most frequently reported reasons to take the vaccine were:
- 'to stop me catching COVID-19 or getting very ill from it' (74.5%),
- 'to allow my social and family life to get back to normal' (45.9%),
- 'to protect other people from catching COVID-19' (44.4%).
A tenth (10%) of respondents reported not planning to take a COVID-19 vaccine. Within this group, the main reasons for not taking the vaccine were:
- 'I am worried about unknown future effects of the vaccine' (55.2%),
- 'I am worried about side effects' (29.4%),
- 'I am concerned about how quickly the vaccines have been developed' (23.4%).
See Figures i and ii in Annex 3 for full breakdown of the reasons.
3.1.1 Summary of views on COVID-19
Respondents were asked a series of questions about their views and experiences of COVID-19 and the related restrictions. Responses for each question were recorded on a 0 to 10 scale, with 0 indicating 'Not at all' and 10 indicating 'Very much', with no definition ascribed to the points in between. The average scores for the whole Wave 4 sample are reported in this section. See Annex 3 and 4 for more detail.
- Respondents indicated the higher end of the scale, 8.0/10, on average to indicate how necessary they felt social distancing and lockdown measures to be in helping prevent the spread of COVID-19.
- When asked how concerned they felt about COVID-19, respondents averaged above the middle of the scale 6.7/10
- Overall, respondents on average indicated above middle of the scale for the effect of COVID-19 on their lives more generally as 6.3/10.
- Respondents on average indicated the middle of the scale (5.5/10) to indicate the impact COVID-19 had on how they felt emotionally (e.g., scared, upset, angry, depressed).
- When asked about how much control society had over COVID-19, they scored on average at the lower end of the scale (4.1/10).
Respondents were also asked how often they had followed the Government's COVID-19 prevention guidelines in the two weeks before the Wave 4 survey:
- Overall, over eighty percent (86.3%) of respondents reported that they had 'always or often' followed Government guidelines.
- Respondents with pre-existing physical health (92.8%) and those who lived alone (91.1%) were most likely to report following Government guidelines 'always or often'.
Wave 4 specific items
Respondents were asked to indicate the extent to which they agreed statements about COVID-19 risk, with response options ranging from strongly disagree to strongly agree. The items assessed included: concerns that their own or loved one's risk of catching COVID-19 had increased, concerns around other people's ability/willingness to follow COVID-19 restriction guidelines, and their overall feelings of safety to go out in the two weeks before the wave 4 survey.
- Those most likely to report feeling concerned that their risk of catching COVID-19 had increased were respondents with pre-existing mental health conditions (52.5%) and those with caring responsibilities (48.3%)
- The most likely to report feeling concerned that the risk of a loved one getting COVID had increased were respondents with a pre-existing mental (64.6%) or physical (56.9%) health condition and women aged 30-59 (55.6%).
- Those most likely to report concerns around other people's ability/willingness to follow COVID-19 restriction guidelines were respondents with a pre-existing physical (89.3%) or mental (86.2%) health condition.
- Those most likely to report not feeling safe to go out due to COVID-19 were respondents with a pre-existing physical (60.2%) or mental (57.8%) health condition.
Support seeking
Respondents were asked how willing they currently felt to contact healthcare services for a physical or mental health concern. Responses for each question were recorded on a 0 to 10 scale with 0 indicating 'Not at all willing' to 10 'Extremely willing'. No definition was ascribed to the points in between.
- At Wave 4, respondents recorded 7/10 as the average score to mark their willingness to contact their GP about a non-COVID-19 related health concern. Respondents in the 60+ age group (7.6/10) and men (7.2/10) were the most willing to contact the GP.
- On average, respondents recorded 6.3/10 to mark their willingness to seek professional help for their mental health. Respondents in the 60+ age group (6.6/10) and those with dependents under 16 years old (6.6/10) being most willing to seek help for their mental health.
3.2 General health and lifestyle factors during COVID-19
This section presents a brief breakdown of physical health, sleep, activity levels, and other lifestyle factors at Wave 4, which help to contextualise the mental health findings. Specifically, physical health and healthy lifestyle factors (e.g., good sleep, healthy eating) can have a positive influence upon mental health and wellbeing. Evidence suggests that the more healthy lifestyle choices an individual makes, the higher life satisfaction and lower psychological distress he or she tends to have (Velten, et al., 2014). Due to the restrictions during the COVID-19 pandemic, there is a risk that these general health and lifestyle factors will be negatively impacted, so that people are more likely to make unhealthy lifestyle choices, which may then have an effect on mental health and wellbeing.
3.2.1 Perceptions of overall health
Findings suggest that overall, respondents felt that their overall health was reasonably good. Respondents with a pre-existing mental or physical health condition reported worse perceptions of their health compared to those without pre-existing mental or physical health conditions.
At the time of the Wave 4 survey, most respondents (63.7%) reported that their health was 'very good' (15.6%) or 'good' (48.1%). Over a quarter (27.7%) reported their health as 'fair', and fewer than one in ten felt their health was either 'poor' (6.8%) or 'very poor' (1.7%).
Looking at the data more closely, there were some differences in reports on reporting of 'poor' or 'very poor' perceived health according to groups categorised by background factors:
- Respondents in the youngest age group (18-29 years) were least likely to report feeling their health was poor or very poor (3.4%) compared to 30-59 year olds (9.3%) and the 60+ years group (11.0%).
- Respondents from lower SEG (13.9%) were more likely to report poor or very poor general health than those in the higher SEG (5.3%).
- Respondents living in rural areas (9.4%) were more likely to report poor or very poor general health than those living in urban areas (8.2%).
- Respondents with caring responsibilities (12.6%) were more likely to report poor or very poor general health than those with no caring responsibilities (7.8%).
- Respondents with who were not keyworkers (9.6%) were more likely to report poor or very poor general health than those who were keyworkers (4.4%).
- Respondents living alone (13.3%) were more likely to report poor or very poor general health than those living with others (7.1%).
- Respondents who had not experienced a change in working status were more likely to report poor or very poor general health (12.2%) than those who had experienced a change in working status (4.3%).
- Around a third of respondents with pre-existing mental (31.1%) or physical health conditions (30.1%) reported poor or very poor general health compared to those without a pre-existing mental (5.1%) or physical health (3.3%) conditions.
3.2.2 Sleep
This section presents a brief overview of respondents' sleep quality in the week prior to Wave 4. Disturbances in sleep have been shown to be related to poor mental health and wellbeing, including associations with suicidal thoughts and self-harm (Russell et al., 2017). Due to the lockdown restrictions people may lose their normal routines, and this can lead to poorer or less structured sleep. The data indicated that the highest proportion of respondents (44.6%) rated their sleep as 'average', over a quarter of respondents rated their sleep as good or very good (30.0%), while a quarter felt their sleep had been poor or very poor (25.3%).
A more detailed analysis of the sleep data shows that there were some subgroup differences by background:
- Respondents in the middle age group (30-59 year olds) were more likely to report experiencing poor or very poor (28.5%) sleep compared to around a quarter of the youngest age group (24.7%) and a fifth of respondents in the 60+ years age group (21.2%).
- Men were more likely to report good or very good (34.5%) sleep compared to women (25.9%).
- Respondents from the lower SEG were more likely to report poor or very poor (27.8%) sleep compared to the higher SEG (24.0%).
Sleep quality differed among respondents with or without pre-existing mental health conditions:
- Just under half of respondents with a pre-existing mental health condition reported poor or very poor sleep quality (46.6%) in the past week, compared to around a fifth (22.2%) of those with no mental health condition.
- Over a third of those with a pre-existing physical health condition reported poor or very poor sleep quality (34.8%) compared to under a quarter (23.1%) of those with no condition.
3.2.3 Lifestyle factors
This section presents a brief breakdown of respondents' lifestyle factors at Wave 4. Lifestyle factors can be important factors in an individual's mental and physical wellbeing. Behaviours such as taking part in regular physical activity, limiting alcohol intake and drug use (other than prescription or over the counter medicines) can help maintain physical and mental wellbeing (WHO, 2004). Maintaining a healthy lifestyle can be difficult at times of uncertainty and increased stress, such as during the COVID-19 pandemic. Respondents were asked to indicate whether, in comparison to their usual behaviours, they felt that they had done various activities 'Less than usual', 'About the same' or 'More than usual' in the week prior to the questionnaire. The lifestyle factors and behaviours included alcohol use, smoking, drug use (other than prescription or over the counter medicines), online gambling, and physical activity. The following section provides a brief overview of these lifestyle factors, noting statistically significant differences by subgroups.
Alcohol
Around a third of respondents (29.2%) reported not drinking alcohol in the past week. Around two fifths (41.9%) reported no changes in their drinking in the past week, a fifth (20.8%) reported drinking less than usual while 8.1% of respondents felt they had drunk more than usual.
Smoking
The majority of the sample (80.6%) reported not smoking during the previous week. Under 10% of the sample reported changes in smoking behaviour with 2.6% of respondents reporting having smoked less than usual, while 4.6% felt they had smoked more than usual.
Drugs
The majority of the sample (86.7%) reported not using drugs, 2.6% of the sample reported increased drug use in the previous week prior compared to their usual usage, while 1.0% reported decreased use.
Gambling
The majority of the sample reported not engaging in online gambling (77.5%) in the week prior. Under 10% of the sample reported changes in gambling behaviour with 4.3% of respondents reporting gambling less than usual, while 2.7% felt they had gambled more than usual.
Physical Activity
This section reports on how many days in the last week respondents had engaged in moderate or vigorous physical activity for 15 minutes or more. Overall, respondents reported engaging in exercise for an average of two and a half days per week (mean= 2.6 days).
- Respondents in the 18-29 year old age group reported higher levels of vigorous physical activity (mean= 2.7 days) compared to the 30-59 year olds (mean= 2.6 days) and the 60+ age group (mean= 2.5 days).
- Men reported higher levels of vigorous physical activity (mean= 2.6 days) compared to women (mean= 2.5 days).
- Respondents from higher SEGs (mean= 2.8) reported engaging in more vigorous physical activity compared to those from lower SEGs (mean= 2.2).
There were also differences in levels of physical activities among respondents with or without a pre-existing mental health condition:
- Respondents with a pre-existing mental health condition reported lower levels of vigorous physical activity (mean= 2.1 days) compared to those with no mental health condition (mean= 2.6 days).
- Lowest levels of vigorous physical activity were reported by respondents with pre-existing physical health conditions (mean= 1.7 days) compared to those with no physical health conditions (mean= 2.8 days).
3.3 Support network and emotional support
This section presents an overview of respondents' emotional and social support at Wave 4. The availability of help and assurance from friends, relatives, and colleagues has previously been found to improve individuals' capability to deal with stressful life events and to protect against mental distress and mental health problems (Saltzman, Hansel, & Bordnick, 2020). Given the possibility that people would be isolated from their usual support networks due to the COVID-19 pandemic, Wave 4 asked respondents how connected they felt to friends, family, colleagues, and their community during the COVID-19 lockdown. For the purposes of this report, those who reported being quite a bit, moderately or extremely connected were grouped in the category of 'Connected', and those who reported feeling not or a little bit connected were grouped as being 'Not connected'.
On average, those that felt the most connected included:
- A higher proportion of young adults (18-29 years) felt connected to friends and colleagues than the other age groups.
- More women felt connected to family than men, whereas more men felt connected to colleagues.
- Those in the higher SEG were more likely to feel connected to friends and colleagues than those in the lower SEG
- A higher proportion of respondents with no pre-existing mental or physical health condition felt connected to family, friends, colleagues, and community than those with a pre-existing mental or physical health condition.
3.3.1 Support Network
Family and Friends
Around two thirds of the sample (64.3%) felt connected to family, while under half the sample felt connected to friends (40.9%), and under a fifth (16.1%) felt connected to their community. Of respondents who worked, 38.5% felt connected to their colleagues.
Differences in feelings of social connectedness to friends or family were found for different groups based on age, sex and background:
- Young adults (18-29 year olds) were most likely to report feeling connected to their family (68.3%), followed by the middle age (30-59 years old) group (64.0%), and then the older (60+) age group (61.7%).
- Young adults (18-29 year olds) were more likely to report feeling connected to their friends (53.2%) than the older age groups (30-59 years: 37.7%; 60+ years: 37.0%).
- Respondents from the higher SEG were more likely to feel connected to family (66.2%) compared to those from the lower SEG (60.9%).
- Respondents from the higher SEG were more likely to feel connected to friends (44.3%) compared to those from the lower SEG (35.0%).
- Respondents who lived alone were less likely to feel connected to family (53.5%) than those living with others (67.3%).
- Respondents with caring responsibilities were less likely to feel connected to friends (34.4%) than those without caring responsibilities (42.1%).
- Respondents who had experienced a change to their working status were more likely to feel connected to family (66.4%) and friends (45.6%) than those who's working status hadn't changed (family: 62.4%, friends: 36.8%)
Living with an illness was also associated with different reports of connectedness:
- Respondents with a pre-existing mental (48.8%) or physical health (40.0%) condition were more likely to report not feeling connected to family compared to respondents without a pre-existing mental (32.7%) or physical (33.6%) health condition.
- The majority of respondents with a pre-existing mental (76.4%) or physical (69.5%) health condition did not feel connected to friends compared to around half of those without a pre-existing mental (54.7%) or physical (54.6%) health condition.
Colleagues and Community
Under a fifth (16.1%) of the overall sample reported feeling connected to their community. Around a quarter (26.8%) of respondents responded that the item assessing connectivity to colleagues was not applicable to them (e.g., respondents who may not work or had been furloughed) and they have been excluded from analysis of this item. Differences arose across subgroups such as age, sex, background and health status:
- Just under half of 30-59 year olds (45.2%) and 18-29 year olds (44.2%) reported feeling connected to their colleagues, compared to under a fifth (14.9%) of the 60+ age group.
- 20.4%) of 30-59 year olds felt connected to their community compared to 18.0% of 18-29 year olds, and 16.6% of the 60+ age group.
- Men were more likely to report feeling connected to their community (19.0%) than women (13.2%).
- Respondents from the higher SEG were more likely to feel connected to colleagues (42.6%) than those from the lower SEG (30.5%). Respondents from higher SEG were also more likely to feel connected to their community (18.5%) than those from lower SEG (11.9%).
- Respondents with a pre-existing mental health condition were less likely to feel connected to colleagues (20.5%) compared to respondents without a pre-existing condition (40.7%). Respondents with a pre-existing mental health condition reported feeling less connected to their community (8.0%) than those with no pre-existing mental health condition (17.3%).
- Respondents with a pre-existing physical health condition were less likely to feel connected to colleagues (15.7%) than those without a pre-existing physical health condition (42.2%). A tenth (9.8%) of respondents with a pre-existing physical health condition felt connected to their community compared to around a fifth (17.6%) without a pre-existing physical health.
- Respondents who had caring responsibilities were less likely to feel connected to colleagues (31.1%) than those without caring responsibilities (40.1%).
- Over half of respondents who were fulfilling keyworker roles (55.8%) felt connected to colleagues compared to a third of those who were not keyworkers (31.4%). Additionally, just around a quarter of keyworkers (22.5%) felt connected to their community compared to 14.3% of those who were not keyworkers.
- Respondents who had experienced a change to their working status were more likely to feel connected to colleagues (45.6%) than those who's working status hadn't changed (28.3%).
3.3.2 Emotional support
This section presents a breakdown of sources of emotional support respondents used in the month prior to Wave 4. Sources of emotional support included family, counsellors, GP, and NHS services. The findings for the whole sample are displayed in Table 3.1 below, with the percentage of people who had made contact with a particular source at least once in the month before the Wave 4 survey.
Friends and family were the most used source of support and NHS 24 was least used. Young adults (18-29 years old) were most likely to make use of the supports available. Women were more likely to have sought support from friends and family, while men were more likely to access resources online or by telephone.
| Source of support | Respondents accessing in month prior to Wave 4 survey (%) |
|---|---|
| Friends or family | 37.4 |
| Professional counselling or therapy (via telephone, online or face-to-face) | 5.8 |
| GP or community health worker (e.g. health visitor, midwife, pharmacist) | 6.7 |
| NHS 24 111 telephone service | 2.3 |
| NHS Inform/Shielding support telephone line | 4.3 |
Differences in use of support
- Women were more likely to have contacted friends and family for emotional support (44.0%) than men (30.1%).
- Men were more likely (3.2%) to have contacted NHS 24 than women (1.4%).
- Respondents in the youngest age group (18-29 years) were the most likely to have contacted community based emotional support compared to the other age groups whereas the 30-59 year age group were more likely to use NHS information services (e.g., NHS 24). Specifically:
- The 18-29 year olds were more likely to have contacted friends and family for emotional support (63.9%) than the 30-59 year olds (36.2%) and the 60+ group (20.0%).
- Respondents in the 18-29 year old age group were also more likely to have used professional counselling or therapy services (9.6%) than the other age groups (30-59 years: 7.3%, 60+ years: 0.9%).
- The youngest age group were also more likely to report having contact with a GP or community health worker (9.5%) than the 30-59 year olds (6.9%) and the 60+ group (4.2%).
- Respondents in the middle age group (30-59 years old) were more likely to report using NHS 24 (3.5%) than the 18-29 year olds (2.5%) or the 60+ group (0.3%).
- The 30-59 years old age group were also more likely to report using NHS Inform/Shielding support telephone line (6.5%) than the 18-29 year olds (4.9%) and the 60+ group (0.7%).
- Respondents with a pre-existing mental health condition were more likely (52.6%) to have contacted friends and family for emotional support than those with no pre-existing condition (35.1%).
- Those with a pre-existing mental health condition were also more likely to have used professional counselling or therapy services (14.2%) compared to those with no pre-existing condition (4.6%).
- Respondents with a pre-existing mental health condition were more likely to report contact with GP or community health worker (14.4%) than those with no pre-existing mental health condition (5.5%).
- Respondents with a pre-existing mental health condition were also more likely (7.4%) to have used NHS Inform/Shielding support telephone line than those with no pre-existing physical health condition (3.9%).
- Respondents with a pre-existing physical health condition were less likely (32.0%) to have contacted friends and family for emotional support than those with no pre-existing condition (38.7%).
- Respondents with a pre-existing physical health condition were more likely to report contact with GP or community health worker (9.4%) than those with no pre-existing physical health condition (6.0%).
- Those with a pre-existing physical health condition were also less likely (0.6%) to have used NHS 24 than those with no pre-existing physical health condition (2.7%).
3.4. Finances during easing of lockdown
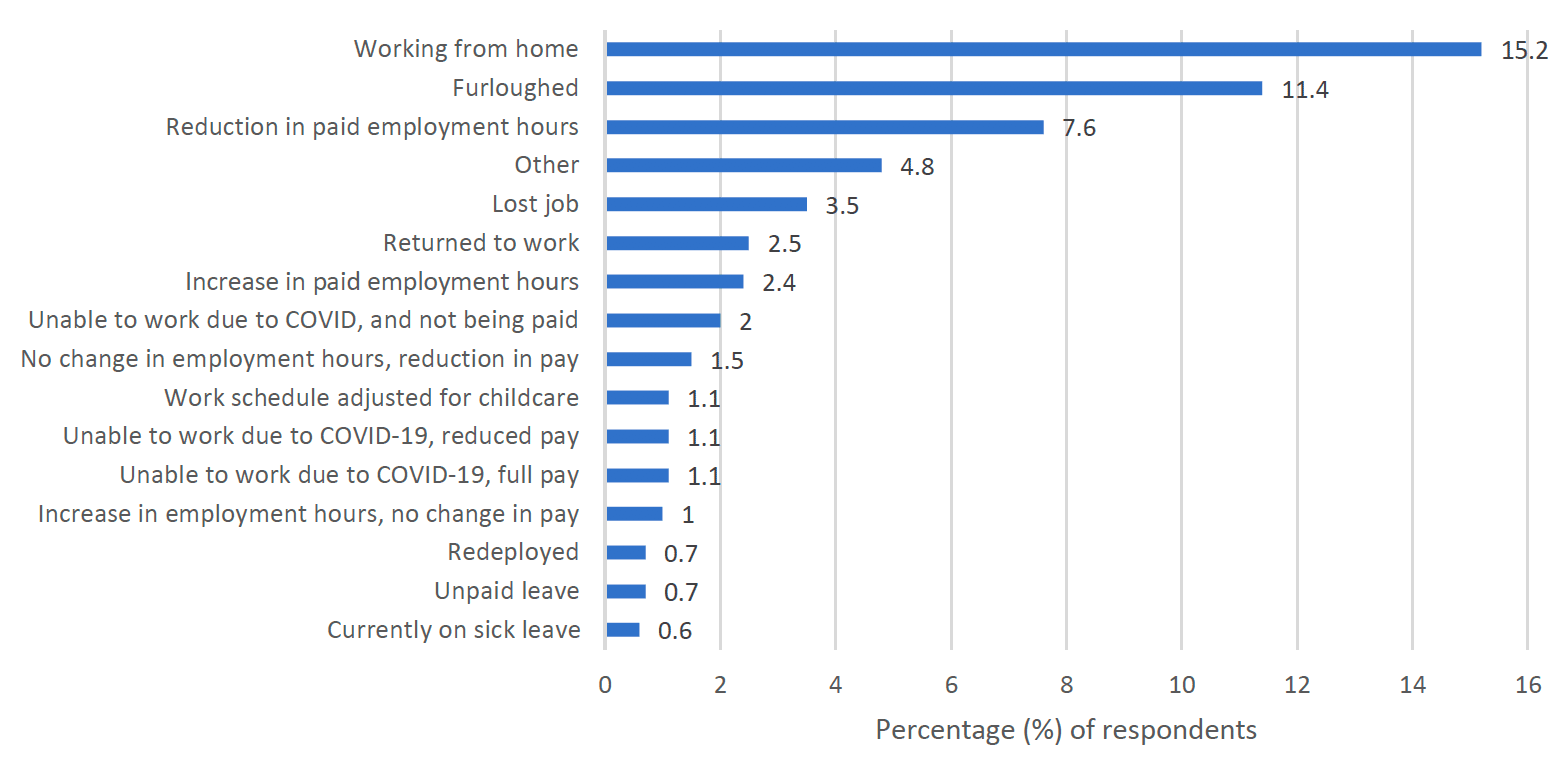
Financial difficulties, especially financial debts, have previously been found to be associated with mental health issues within the UK population (Jenkins et al., 2008). Additionally, different financial crises have been linked to increased prevalence rates of mental disorders and substance use (Van Hal, 2015) Considering links between finances and mental health, respondents were asked questions around work status and financial security during the Wave 4 survey period, and were able to select multiple options to reflect more than one change which may have occurred. Overall, just under half of respondents (42.5%) reported that their job had changed in some way during the COVID-19 pandemic. As displayed in Figure 3.2, at Wave 4 the most commonly reported changes were:
- 15.2% of the sample were working from home,
- 11.4% were furloughed,
- 7.6% of respondents had a reduction in paid employment hours.
To assess perceived financial coping during COVID-19 in Wave 4 of the SCOVID study, respondents were asked: "How well would you say you are managing financially these days?". Responses ranged from 'living comfortably' to 'doing alright', to 'just about getting by', to 'finding it quite difficult' to 'finding it very difficult'. For this report we have grouped responses to reflect respondents reporting financial coping (living comfortably, doing alright, and just about getting by) and those who were experiencing difficulties (finding it quite difficult, and finding it very difficult). At the time of the Wave 4 survey the majority of respondents (90.1%) reported no financial difficulties.
Particular groups within the sample reported experiencing financial difficulties. These include respondents in the younger age groups, those in the lower SEG, carers, those living in rural areas, and respondents with a pre-existing mental health condition.
- Young adults (10.5%) and those aged 30-59 years (13.6%) were more likely to report financial difficulties than the 60+ age group (3.8%).
- Women were more likely to report financial difficulties (11.9%) than men (7.7%).
- Respondents with caring responsibilities were more likely (18.3%) to report financial difficulties than those without caring responsibilities (8.3%).
- Respondents from the lower SEG were more likely (14.4%) to report financial difficulties than those from higher SEG (7.2%).
- Respondents with a pre-existing mental health condition were more likely to report financial difficulties (23.9%) compared to those with no pre-existing mental health condition (7.8%).
- Respondents with a pre-existing physical health condition were more likely to report financial difficulties (12.7%) compared to those with no pre-existing condition (9.2%).
At Wave 4 respondents were asked if they had received financial or other material help from charities (e.g. used foodbanks) since the start of the COVID-19 pandemic.
Overall, 3.4% respondents said they had received financial or other material help from charities since the start of the COVID-19 pandemic. Particular groups within the sample reported receiving financial or other material help from charities:
- Respondents from the lower SEG were more likely (5.4%) to report receiving financial or other material help from charities than those from higher SEG (2.3%).
- Respondents aged 30-59 (5.4%) were the most likely of the age groups (18-29 years: 2.2%, 60+ years: 1.2%) to report having received financial or other material help from charities.
- Women (4.9%) were more likely to report having received financial or other material help from charities than men (1.8%).
- Respondents with a pre-existing physical health condition (5.7%) were more likely to report having received financial or other material help from charities than respondents without a pre-existing physical health condition (2.8%).
- Of all the groups, respondents with a pre-existing mental health condition (8.3%) were most likely to report having received financial or other material help from charities, compared to respondents with no pre-existing mental health condition (2.7%).
3.5 Interpersonal harm
Experiences of psychological and physical violence have short-term as well as long-lasting effects on individuals' mental health (Lindert & Levav, 2015). For example, intimate partner violence has been associated with subsequent symptoms of posttraumatic stress disorder, anxiety, and general psychological distress (Lagdon, Armour & Stringer, 2014). Given these links, respondents were asked questions about recent experiences of physical harm and bullying or psychological harm in the 2 weeks before the Wave 4 survey.
Overall, 6.2% of respondents reported that they had been physically harmed by another person in the prior 2 weeks. Additionally, 7.7% of respondents reported experiences of being bullied, controlled, intimidated or psychologically hurt by somebody else.
Particular groups within the sample reported higher rates of interpersonal harm than their subgroup counterpoints:
- Younger ages groups (18-29 years: 7.0%, 30-59 years: 7.3%) reported higher rates of more physical harm than the 60+ age group (3.8%)
- Respondents in the 30-59 year old age group were most likely (11.0%) to report psychological harm compared to the other age groups (18-29 years: 5.2%, 60+ years: 4.3%).
- Those with a pre-existing mental health condition were more likely to report physical (10.4%) and psychological harm (12.0%) than those without a pre-existing condition (physical harm: 5.6%, psychological harm: 7.0%).
- Those with a pre-existing physical health condition were more likely to report physical (9.6%) and psychological harm (12.0%) than those without a pre-existing physical health condition (physical harm: 5.4%, psychological harm: 6.8%).
3.6 Finding positives during the COVID-19 pandemic
Experiencing adversity can sometimes have positive effects for individuals. At Wave 4, a modified version of the Benefit Finding Scale (Tomich & Helgeson, 2004) was included, to assess if living through the COVID-19 pandemic had had any positives for respondents.
The three most endorsed items were:
- "Living through the COVID-19 pandemic has taught me how to adjust to things I cannot change" (34.0%)
- "Living through the COVID-19 pandemic made me more grateful for each day" (31.9%)
- "Living through the COVID-19 pandemic made me realize the importance of planning for my family's future" (31.8%)
A total score for the measure is calculated by adding together each question response, with 14 indicating no positive effects of the COVID-19 pandemic and 70 indicating very high positive effects from the COVID-19 pandemic.
There are no cut-off scores for this scale showing high or low levels of benefit finding, therefore an average mean score is used to compare differences between the subgroups. The mean score for the sample was 36 (out of a possible 70). There were some differences between particular subgroups:
- Women (37.8) reported a higher average score than men (33.9), indicating that women were more likely to find benefits from experience of the COVID-19 pandemic.
- Respondents without a pre-existing mental health condition (36.4) reported higher levels of benefit finding than those with a pre-existing mental health condition (32.7)
- Respondents without a pre-existing physical health condition (36.2) reported higher levels of benefit finding than those with a pre-existing physical health condition (34.6)
3.7. Trust in authorities
Trust is an important indicator of how confident people are in society more widely. During COVID-19, public trust in the authorities is important as various public health rules and restrictions have been introduced to mitigate the spread of the virus. There is evidence that high public trust in the government regarding COVID-19 was correlated with lower psychological distress and higher physical well-being (Olagoke et al., 2020). In Wave 4 of the SCOVID study, trust in the authorities (police, NHS, UK, and Scottish governments) was assessed. Differences in levels of trust by groups can be found in Annex 4.
Police
Around two thirds of respondents (68.6%) said that they trusted the police to some extent and around a third of these respondents reported trusting the police completely.
NHS
The majority of respondents (87.7%) reported trusting the NHS to some extent and around half (47.2%) of these respondents endorsed trusting the NHS completely.
Trust in government
Respondents were asked to what extent they felt the UK and Scottish governments could be trusted.
- Just under a third of respondents (28.9%) said that they felt the UK government could be trusted to some extent while 60.8% said they did not trust it at all or did not trust it very much.
- Over half of all respondents (56.9%) said that they felt the Scottish government could be trusted to some extent while a third (34.0%) said they did not trust it at all or did not trust it very much.
Contact
Email: socialresearch@gov.scot