Scottish COVID-19 Mental Health Tracker Study: Wave 4 Report
Wave 4 findings (data collected between 4 February and 9 March 2021.) indicate that young adults, women, people with physical and/or mental health conditions, and people in a lower socio-economic group are more likely to report experiencing poor mental health.
1. Background
1.1 Study overview and aims
The Scottish COVID-19 (SCOVID) Mental Health Tracker Study helps us to understand the impacts of the coronavirus pandemic on people's mental health and wellbeing in Scotland[10], particularly the differential impacts on sub-groups of the population. The study surveys a sample of adults (18 and over) in Scotland at five points in time (waves) over a 12 month period, starting in May 2020. This report presents findings from Wave 4, which took place in February and early March 2021. The Wave 4 findings will aid with the tracking of mental health outcomes in the population as we navigate different levels of restrictions.
At each wave of the study, respondents were asked to complete questions on mental health and wellbeing including measures of anxiety, depression, psychological distress, mental wellbeing, loneliness, defeat, entrapment, and life satisfaction. A range of questions were included exploring contextual factors, such as emotional and social support, lifestyle factors, and COVID-19 related questions.
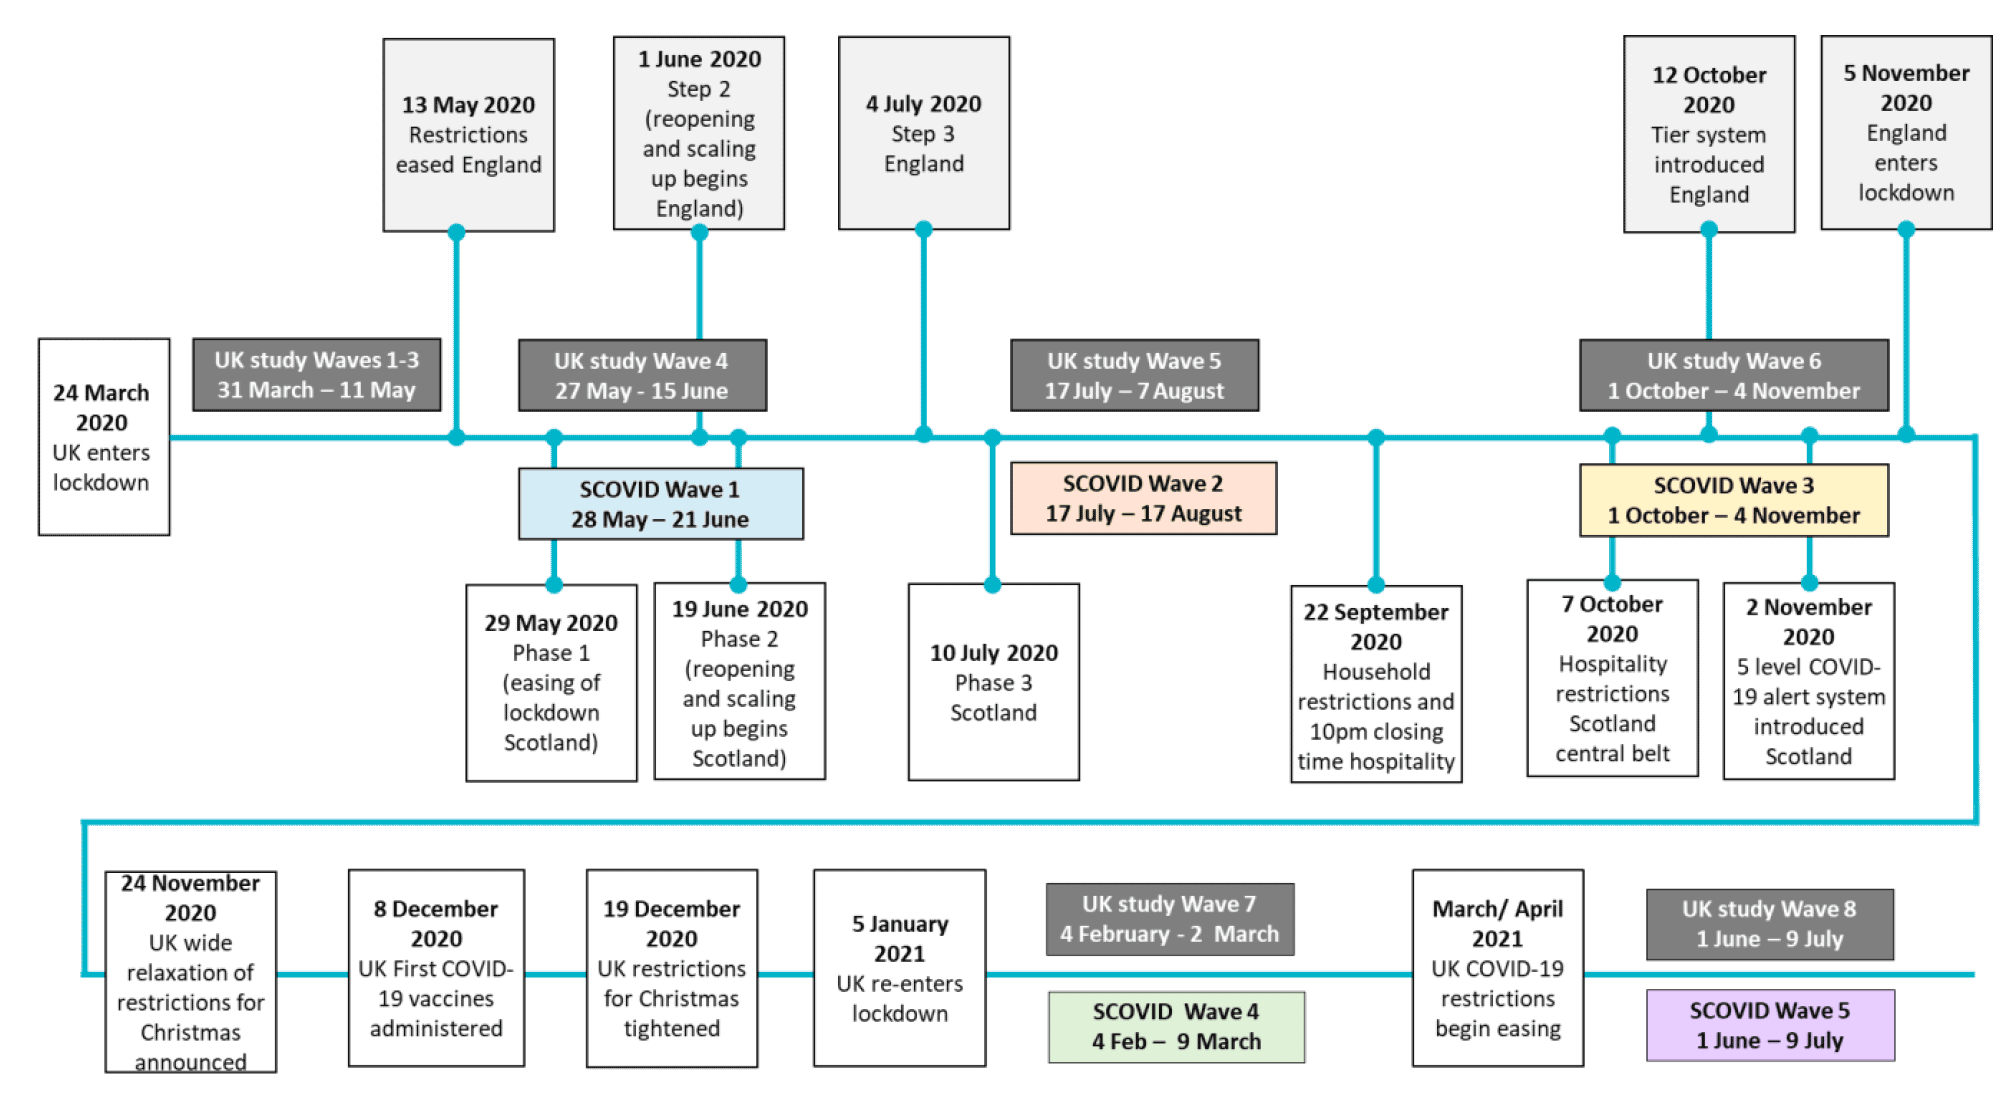
The Scottish survey measures are aligned with the UK COVID-MH study to allow direct comparisons with other regions of the UK[11]. Figure 1.1 below provides an overview of key events/policy decisions for Scotland in relation to the COVID-19 tracker studies.
The Wave 1 survey ran from 28th May to 21st June 2020 which coincided with the Phase 1 easing of lockdown measures in Scotland[12]. Findings from the Wave 1 survey are reported in the Scottish COVID-19 (SCOVID) Mental Health Tracker Study: Wave 1 Report.
The Wave 2 survey ran between 17th July and 17th August 2020, which coincided with the Scottish Government's introduction of Phase 3 of the easing out of lockdown. Phase 3 included an increase in the number of households that could meet indoors and outdoors, and the opening of indoor hospitality. Findings from the Wave 2 survey are reported in the Scottish COVID-19 (SCOVID) Mental Health Tracker Study: Wave 2 Report.
The Wave 3 survey ran from 1st October 2020 and 4th November 2020, which roughly coincided with the increasing of COVID-19 restrictions in Scotland[13]. Specifically, on 1st October people could no longer meet inside people's homes unless they were part of a bubble, and on 7th October restrictions on hospitality were announced. Findings from the Wave 3 survey are reported in the Scottish COVID-19 (SCOVID) Mental Health Tracker Study: Wave 3 Report.
The Wave 4 survey ran from 4th February and 9th March 2021, which coincided with a UK-wide lockdown that had been announced on 4th January 2021. At this point lockdown restrictions included a strict stay at home message, with all non-essential retail and services closing, including hospitality, and stringent restrictions on meeting friends and family indoors and outdoors.
Wave 5 (which took place between 1 June 2021 and 9 July 2021) will be the final wave of the SCOVID study.
Key research aims for Wave 4 of the SCOVID study
1. To track changes in people's mental health and wellbeing in Scotland during the COVID-19 pandemic and changing of government restrictions. Specifically, changes in mental health and wellbeing from the easing of restrictions (Wave 2: 17th July and 17th August 2020) to the increasing of restrictions (Wave 3: 1st October 2020 and 4th November 2020), to the introduction of a UK-wide lockdown (Wave 4: 4th February and 9th March 2021).
2. To provide an overview of people's mental health and wellbeing during this point in the COVID-19 pandemic that included an increase of government restrictions using a cross-section of the Scottish population.
3. To provide an overview of contextual factors during the COVID-19 pandemic and increasing of government restrictions.
1.2 Sampling and methodology
At Wave 1, members of an existing online UK panel (Panelbase.net) were invited to take part in an online survey on health and wellbeing. These respondents also agreed to be followed up over subsequent waves. A total of 2594 people participated at Wave 1, with quotas for specified population sub-groups (see Tables A-C in the Annex for details). All the respondents who had taken part in Wave 1 of the Scottish COVID-19 Mental Health Tracker study were invited to take part in the Wave 4 survey.
Due to a lower response rate at Wave 2 and Wave 3, particularly among young adults (18-29 years), a booster sample of new participants were recruited at Wave 3 (n=327), and these respondents were also invited to take part in Wave 4.
As with the Wave 3 report, analysis from two samples are reported within this report:
- a cross-sectional sample (n=1288) of all those who completed the Wave 4 survey (including respondents from the booster sample). This is used to report findings from the time of the survey (4th February to 9th March 2021) and for exploring sub-group differences.
- a longitudinal sample (n=1022) of those who have completed the survey at every wave. This is used to show how that particular group of respondents have changed in their mental health over time.
Both the longitudinal and cross-sectional data are not entirely representative of the Scottish population, as there has been a loss of participants to follow-up. This has particularly impacted the longitudinal data, and therefore the cross-sectional findings are more representative of the Scottish population at each time point.
Cross-sectional Wave 4 sample
Of the 1288 people that took part in the Wave 4 survey, 90.8% (n= 1169) were from the original Wave 1 survey (44.8% of the original Wave 1 sample) and 9.2% (n=119) were from the Wave 3 booster sample (see Figure 1.2). Only 36.5% of the Wave 3 booster sample took part in the Wave 4 survey, meaning that younger adults were still under-represented within this sample.
The age and sex profile of the Wave 4 sample compared to the Wave 1 sample is outlined in Table D1, Annex 1. The Wave 4 sample contained similar proportions of men and women as at Wave 1. However, the proportion of younger adults decreased (from 22.4% at Wave 1 to 14.0% at Wave 4), with young men having the highest loss at follow-up. Adults aged 30-59 years made up the same proportion at Wave 4 and Wave 1 (46.4%), and adults aged 60+ years made up a larger proportion of the sample at Wave 4 (39.5%) compared to Wave 1 (31.2%). This suggests that older adults were more likely to remain a part of the study than young adults and may be over-represented in the data.
As several demographic groups were underrepresented in the initial Wave 4 sample, results were weighted to reflect the Scottish population. This allows for the shortfall in particular groups to be adjusted, so that the findings are more representative of the original quota sample. The weighting is based upon age, sex, and socio-economic group (SEG) (as detailed in Table E, Annex 1; also see Tables A-C for details of the original quotas). Consequently, although 1288 people took part, the results are adjusted such that the sample reports on 2500 respondents. The weighting methodology is identical to that employed in the previous two waves for consistency.
Although weighting is widely used there is always risk of bias as the weights may inflate or suppress the data from subgroups in the sample and is dependent upon the representativeness of the data collected. The weighted sample is used in all analysis in this report, although non-weighted data is reported in the annex for comparability.
Longitudinal sample
The longitudinal sample includes those who have completed all four waves of the SCOVID study (n=1022, 39.2% of the original Wave 1 sample), and this sample is used to report changes across the waves. Respondents from the booster sample are not included in the longitudinal analysis as they have no previous measures for comparison before Wave 3.
Due to the attrition rate (i.e., loss to follow-up) of the longitudinal sample, a number of demographic groups are under-represented in the findings reporting changes across waves, specifically young adults (aged 18-29 years). Table F in the Annex reports the attrition rates for each of the main subgroups reported on for this study.
As only 56 (5.5%) young adults (aged 18-29 years) from Wave 1 remained in the Wave 4 sample, it was decided that it was not possible to include young adults in the analysis of changes over the waves. This age group will only be reported within the Wave 4 cross-sectional analysis. The 'Change of working status' subgroup was not included in the longitudinal analysis, as this group was based upon responses at the Wave 1 survey (for comparison across waves). As respondents' working status may have changed over time, only the cross-sectional findings for this group are reported here to ensure it is current.
As with the previous waves and the cross-sectional sample, the longitudinal data was weighted to reflect the Scottish population (based upon age, sex, and socio-economic group), and this helped to adjust for the loss of respondents at follow-up. Table G in the Annex displays the unweighted and weighted sample characteristics for those who took part in all waves of the study and are therefore included in the longitudinal analysis. Among the weighted sample:
- 51.8% were women (sex assigned at birth) and 48.2% were men
- 21.4% were aged 18–29 years, with 47.6% aged 30-59 years, and 31.1% aged 60+ years
- The majority was White (97.9%)
- Over half of the respondents (60.8%) were married or living with a partner, and the majority were heterosexual (91.3%)
- Around half had a HNC/D or degree level education (49.4%), and over half of was in the higher (A, B, C1) socioeconomic groups (SEG) (66.1%)
As noted above, there is a risk of bias when weighting data, as the weights may inflate or suppress the data from subgroups in the sample, and is dependent upon the representativeness of the data collected. (Although it should be noted that unweighted data is also biased as those who dropped out make the findings unrepresentative). The weight adjusts by inflating the findings of those that have remained in the sample, and as the young adult subgroup in particular are underrepresented this may skew some of the findings. Therefore we have not reported findings for young adults (18-29 years) from the longitudinal sample (i.e., for changes over time).
Table G in the annex displays the unweighted and weighted sample characteristics for those who took part in all waves of the study and are included in the longitudinal analysis. Both weighted and unweighted data are provided in the study Annex 2 (Tables H and I). Although overall trends were similar with or without weighting applied, we do note that some findings should be interpreted with caution.
Layout, analysis and terminology
The main body of the report focuses on the core mental health outcomes (suicidal thoughts, depressive symptoms, anxiety, psychological distress, and mental wellbeing), with other indicators (loneliness, defeat and entrapment, resilience, social support, distress, and life satisfaction) reported more briefly. Information on contextual factors is also provided in the main report and Annexes 3 and 4.
As outlined above, this report presents both longitudinal findings (i.e., changes across the waves) and Wave 4 cross-sectional findings (including the Wave 3 booster sample). Therefore, it should be noted that the samples reported changes depending on the type of analysis conducted. The longitudinal sample for each wave changes slightly at each wave report, as the sample is comprised of only those participants which completed the most recent wave. For example, in this Wave 4 report, the Waves 1, 2, and 3 samples are comprised of only those participants who went on to complete the Wave 4 survey.
Inferential statistical[14] tests were used to investigate differences between key subgroups (see Table E in the Annex for sample breakdown). When the report refers to comparison with subgroup counterpoints, it is the subgroups as listed within Table F in the Annex (i.e., men compared to women, young adults compared to middle and older aged adults). The subgroups are:
- age,
- sex,
- socio-economic grouping,
- a pre-existing mental health condition,
- a pre-existing physical health condition,
- additional responsibilities (dependents, carers),
- and occupational circumstances (key worker, change in working status).
Inferential statistical tests[15] were used to investigate changes in mental health and wellbeing from Wave 1, Wave 2, Wave 3 to Wave 4, with a focus on changes from Wave 3 to Wave 4 in this report.
The report focusses on the statistically significant differences across waves (Wave 3 to Wave 4 in particular) and the differences between key subgroups at Wave 4, rather than discussing findings for each of these subgroups according to each study measure. Subgroups in the longitudinal analysis were based upon responses to the Wave 1 survey (for comparability across the waves), and for the cross-sectional findings were based upon responses to the Wave 4 survey. Therefore, group membership for Wave 4 may differ slightly from previous waves, as people's circumstances may change over time.
This report uses particular terms to describe the mental health outcomes reported by subgroups in the overall sample. The term 'rate' refers to the proportion of respondents within a named subgroup who have reported a particular outcome; it does not describe the degree of a particular outcome. For example, an increased rate of men reporting moderate to severe depressive symptoms means that a higher proportion of men have reported these symptoms; it does not mean that men as a subgroup are experiencing more severe depressive symptoms. The term 'level' refers to the degree to which a particular mental health or wellbeing measure is being experienced. For example, stating that older adults reported higher levels of mental wellbeing than younger age groups means that the average mental wellbeing score for older adults was higher than the average score for younger groups.
Contact
Email: socialresearch@gov.scot