Scottish COVID-19 Mental Health Tracker Study: Wave 3 Report
Wave 3 findings (data collected between 1 October and 4 November 2020) indicate that young adults, women, people with physical and/or mental health conditions, and people in a lower socio-economic group are more likely to report experiencing poor mental health.
1. Background
1.1 Study overview and aims
In December 2019, a novel coronavirus was identified in Wuhan, China. Since then the associated disease COVID-19 has affected millions of people worldwide.
In addition to the physical health impact, there is growing evidence of the effects of the COVID-19 pandemic on mental health and wellbeing that will extend beyond those who have been directly affected by the virus (Holmes, O'Connor et al., 2020: O'Connor et al., 2020). As a result, it is important to continue to monitor population-based health and mental health outcomes to detect groups who may be most affected by the COVID-19 pandemic and associated restrictions. We know from the SARS outbreak in 2003 that anxiety increased, suicide rates also increased in some groups (e.g. Yip et al., 2010; Gunnell et al., 2020; Tsang et al., 2004), and that suicidal thoughts increased in the early phase of the pandemic in the UK (O'Connor et al., 2020). Findings on the initial impact of the COVID-19 pandemic on suicide rates globally have been reassuring, as evidence thus far suggests that suicide rates have not increased during this period (Perkis et al., 2021). However, recent data highlight the need for vigilance, in particular as trends in particular groups may be hidden by these overall figures (John et al., 2020). We need to act now, therefore, to understand and mitigate the mental health risk in Scotland as we continue to respond to the COVID-19 pandemic.
The Scottish COVID-19 (SCOVID) Mental Health Tracker Study is part of a UK-wide study ('Tracking the impact of the COVID-19 pandemic on mental health and wellbeing (COVID-MH) study') which started on 31st March 2020 just after lockdown measures were imposed. Adults aged 18 years and older took part in this survey. In May 2020 the Scottish Government commissioned an additional Scottish sample to allow the tracking of the mental health and wellbeing of the Scottish population over a 12-month period.
The Wave 1 survey ran from 28th May to 21st June 2020 which coincided with the Phase 1 easing of lockdown measures in Scotland[10]. Findings from the Wave 1 survey were reported in the Scottish COVID-19 (SCOVID) Mental Health Tracker Study: Wave 1 Report. The Wave 2 survey ran between 17th July and 17th August 2020, which coincided with the Scottish Government's introduction of Phase 3 of the easing out of lockdown. Phase 3 included an increase in the number of households that could meet indoors and outdoors, and the opening of indoor hospitality. Findings from the Wave 2 survey were reported in the Scottish COVID-19 (SCOVID) Mental Health Tracker Study: Wave 2 Report.
Wave 3 of the SCOVID Study ran from 1st October 2020 to 4th November 2020, which roughly coincided with the increasing of COVID-19 restrictions in Scotland[11]. Specifically, on 1st October people could no longer meet inside people's homes unless they were part of a bubble, and only two households could meet outdoors. Further, on 7th October it was announced that there were restrictions on hospitality, in particular across the central belt, with the closure of licensed premises.
The Scottish survey measures are aligned with the COVID-MH study to allow direct comparisons with other regions of the UK. Findings[12] have been published from the UK COVID-MH study covering 3 waves of data from the start of the first lockdown (Wave 1: 31st March to 9th April 2020, Wave 2: 10th April to 27th April 2020, and Wave 3: 28th April to 11th May 2020). The results suggest that rates of suicidal thoughts increased over the waves, whereas rates of anxiety symptoms and levels of defeat and entrapment decreased across waves, and rates of depressive symptoms did not change significantly. Additionally, positive mental well-being increased (O'Connor et al., 2020).
The findings from the SCOVID study will help us to understand the impacts of the pandemic on the Scottish population's mental health and wellbeing, particularly the differential impacts on sub-groups of the population. The Wave 3 survey will aid with the tracking of these mental health outcomes as we navigate different levels of restrictions.
Key research aims for Wave 3 of the SCOVID study
1. To track changes in people's mental health and wellbeing in Scotland during the COVID-19 pandemic and changing of government restrictions. Specifically, changes in mental health and wellbeing from the easing of restrictions (Wave 2: 17th July and 17th August 2020) to the increasing of restrictions (Wave 3: 1st October 2020 and 4th November 2020).
2. To provide an overview of people's mental health and wellbeing during this point in the COVID-19 pandemic that included an increase of government restrictions using a cross-section of the Scottish population.
3. To provide an overview of contextual factors during the COVID-19 pandemic and increasing of government restrictions.
1.2 Methodology
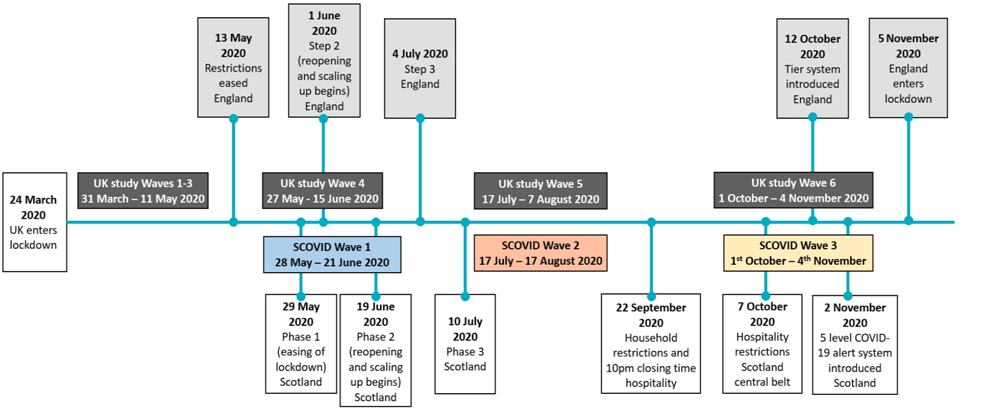
Wave 3 recruitment for the SCOVID study occurred between 1st October 2020 and 4th November 2020. Figure 1.1 provides an overview of key events/policy decisions for Scotland in relation to the COVID-19 tracker studies.
Recruitment was conducted by Taylor McKenzie, a social research company. At Wave 1, members of an existing online UK panel (Panelbase.net) were invited by email to take part in an online survey on health and wellbeing. These respondents also agreed to be followed up over subsequent waves. All the respondents who had taken part in Wave 1 of the SCOVID Study were invited to take part in Wave 3.
Due to a lower response rate than anticipated (51.7% of the original Wave 1 survey completed the Wave 3 survey), particularly among young adults (18-29 years), a booster sample of new participants aged 35 years old and below was recruited using the online UK panel (see Figure 1.3 below for further breakdown of booster sample). As these respondents have no previous measures for comparison, it was not possible to include this booster sample in the longitudinal analysis (i.e., analysis of change across the waves), instead the booster allows for more robust cross-sectional subgroup analysis within this report. This means that there will be two samples reported within this report: the longitudinal sample looking at changes across the waves (n=1298), and the Wave 3 sample for a cross-section of society at Wave 3 (n=1625).
Longitudinal sample
The longitudinal sample includes those who have completed all 3 waves of the SCOVID study (46.8%; n=1219). Due to the attrition rate (i.e., loss to follow-up) of the longitudinal sample, a number of demographic groups are under-represented in the findings reporting changes across waves, specifically young adults (aged 18-29 years). Table 1.1 reports the overview of the attrition rates for each of the main subgroups reported on for this study, drawing on those reported within the Wave 2 report. As only 73 (12.5%) young adults (aged 18-29 years) remained in the sample, it was decided that it was not possible to include young adults in the analysis of changes over the waves, and this age group will only be reported within the Wave 3 cross section analysis. The 'Change of working status' subgroup was also removed from the longitudinal analysis, as this group was based upon responses at the Wave 1 survey (for comparison across waves). As respondents working status may have changed over time, only the cross-sectional findings for this group are reported here to ensure it is current.
| Group | Wave 1 sample (n= 2604), n (%) | Wave 3 sample (n= 1219), n (%) | % of original sample who completed Wave 3 |
|---|---|---|---|
| Age group | |||
| 18-29 | 586 (22.5%) | 73 (6.0%) | 12.5% |
| 30-59 | 1206 (46.3%) | 619 (50.8%) | 51.3% |
| 60+ | 812 (31.2%) | 527 (43.2%) | 64.9% |
| Sex a | |||
| Women | 1329 (51.2%) | 585 (48.0%) | 44.0% |
| Men | 1265 (48.8%) | 633 (51.9%) | 50.0% |
| Ethnicity b | |||
| White | 2483 (95.4%) | 1194 (97.9%) | 48.1% |
| Ethnic minorityc | 121 (4.6%) | 25 (2.1%) | 20.7% |
| Socioeconomic grouping | |||
| Higher half | 1673 (64.2%) | 835 (68.5%) | 49.9% |
| Lower half | 931 (35.8%) | 384 (31.5%) | 41.2% |
| Pre-existing mental health condition | |||
| No | 2281 (87.6%) | 1084 (88.9%) | 47.5% |
| Yes | 323 (12.4%) | 135 (11.1%) | 41.8% |
| Rural vs. Urban | |||
| Rural | 562 (21.6%) | 298 (24.4%) | 53.0% |
| Urban | 2042 (78.4%) | 921 (75.6%) | 45.1% |
| Unpaid carer: any | |||
| No | 2140 (82.2) | 1009 (82.8%) | 47.1% |
| Yes | 448 (17.2) | 200 (16.4%) | 44.6% |
| Key worker | |||
| No | 2084 (80.0%) | 999 (82.0%) | 47.9% |
| Yes | 520 (20.0%) | 220 (18.0%) | 42.3% |
| Dependents under 16 years | |||
| No | 1978 (76.0%) | 982 (80.6%) | 49.6% |
| Yes | 626 (24.0%) | 237 (19.4%) | 37.9% |
| Pre-existing physical health condition | |||
| No | 2088 (80.2%) | 939 (77.0%) | 45.0% |
| Yes | 516 (19.8%) | 280 (23.0%) | 54.3% |
a At Wave 1 n=10 respondents did not indicate their sex; b Ethnicity was dropped from the Wave 2 and Wave 3 longitudinal analysis due to attrition and Wave 3 cross-sectional findings are report in Annex 1 c In the Wave 1 and Wave 2 reports, the term BAME was previously used, however this terminology has been changed in this report to reflect current Scottish Government guidelines.
As with the Wave 1 and Wave 2 data, the Wave 3 data was weighted to reflect the Scottish population (based upon age, sex and socio-economic group), and this helped to adjust for the loss of respondents at follow-up. Unweighted data is provided in the study Annex 2 (Tables C2 and D2). Although overall trends were similar with or without weighting applied, we do note that some findings should be interpreted with caution; when weighting data there is a risk of bias as the weights may inflate or suppress the data from subgroups in the sample and is dependent upon the representativeness of the data collected. The weight adjusts by inflating the findings of those that have remained in the sample, and as the young adult subgroup in particular are underrepresented this may skew some of the findings, therefore we have not reported findings for young adults (18-29 years). On balance, unweighted data is also biased as those who dropped out make the findings unrepresentative, therefore weighted and unweighted data are both subject to biases.
Within the Wave 3 survey, respondents were asked to complete questions on mental health and wellbeing including measures of anxiety, depression, psychological distress (as measured by the GHQ-12 and another single item), mental wellbeing, loneliness, defeat, entrapment, life satisfaction, as well as social support. A range of questions exploring contextual factors such as sources of emotional and social support, and lifestyle factors were included along with perceptions, experiences of, and the impact of COVID-19 related restrictions. Inferential statistical tests[13] were used to investigate changes in mental health and wellbeing from Wave 1 to Wave 2 to Wave 3, with a focus on changes from Wave 2 to Wave 3 in this report.
Booster sample
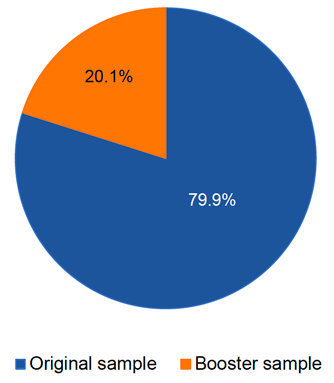
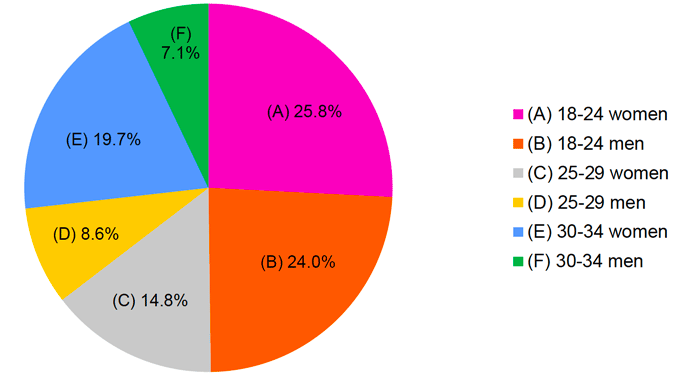
Of the 1625 people that took part in the Wave 3 survey, 1298 (79.9%) were from the original Wave 1 survey, and 327 (20.1%) were the new top up sample. The new sample was 73.1% (n=239) young adults (18-29 years), as this was the group that had been lost most at follow-up, and the rest (n=87, 26.8%) were aged 30-34 years (see Figure 1.3).
The age and sex of the final Wave 3 sample is outlined in Table 1.2, and includes a comparison with the original Wave 1 sample. The Wave 3 sample was made up of 48.8% men and 51.2% women, which is the same as the original sample. The young adults made up 20.1% of the Wave 3 sample, and they had made up 22.4% of the original sample. Young men, who had the highest loss at follow-up, made up 8.0% of the Wave 3 sample, compared to 10.2% of the original sample. Therefore, this boost will allow for more robust age subgroup analysis within this report.
| Age group | Wave 3a sample: Men (n, %) | Wave 3a sample: Women (n, %) | Wave 3a sample: All adults (n, %) | Wave 1 sample: Men (n, %) | Wave 1 sample: Women (n, %) | Wave 1 sample: All adults (n, %) |
|---|---|---|---|---|---|---|
| 18-29 years | 129 (8.0%) | 197 (12.1%) | 326 (20.1%) | 264 (10.2%) | 316 (12.2%) | 580 (22.4%) |
| 30-59 years | 333 (20.5%) | 417 (25.7%) | 750 (46.2%) | 553 (21.3%) | 615 (25.1%) | 1204 (46.4%) |
| 60+ years | 329 (20.2%) | 217 (13.4%) | 546 (33.7%) | 448 (17.3%) | 362 (14.0%) | 810 (31.2%) |
| All adults | 791 (48.8%) | 831 (51.2%) | 1622a (100%) | 1265 (48.8%) | 1329 (51.2%) | 2594 (100%) |
a In the Wave 3 survey, n=3 people did not indicate their sex assigned at birth
As with the longitudinal data, this report presents weighted cross-sectional Wave 3 data, reflective of the Scottish population (based upon age, sex and socio-economic group). Consequently, although 1625 people took part, the Wave 3 results are adjusted such that the sample reports on 2500 respondents. This will allow for the shortfall in particular groups to be adjusted so that the findings are more representative of the original quota sample. Although this approach is widely used there is always risk of bias as the weights may inflate or suppress the data from subgroups in the sample and is dependent upon the representativeness of the data collected. Within the report, inferential statistical tests[14] were used to investigate differences between key subgroups (see Table 1.3 for breakdown). When the report refers to comparison with subgroup counterpoints, it is the subgroups as listed within Table 1.3 (i.e., men compared to women, young adults compared to middle and older aged adults). As with Wave 2, Black and Minority Ethnic (BAME) were underrepresented (3.1% of the sample), and some brief findings for ethnicity are reported in Annex 1. The subgroups were:
- age,
- sex,
- socio-economic grouping,
- a pre-existing mental health condition,
- a pre-existing physical health condition,
- additional responsibilities (dependents, carers),
- and occupational circumstances (key worker, change in working status).
| Grouping variable | Weighted* (n=2500) % | Unweighted (n=1625) % |
|---|---|---|
| Sexa | ||
| Men | 48.1 | 48.8 |
| Women | 51.9 | 51.2 |
| Age | ||
| 18-29 years | 22.7 | 20.1 |
| 30-59 years | 46.7 | 46.2 |
| 60+ years | 30.6 | 33.7 |
| Socioeconomic groupb | ||
| Lower half | 36.8 | 33.3 |
| Higher half | 63.2 | 66.7 |
| Pre-existing mental health conditionc | ||
| No | 86.9 | 87.6 |
| Yes | 13.1 | 12.4 |
| Pre-existing physical health conditiond | ||
| No | 81.2 | 80.6 |
| Yes | 18.8 | 19.4 |
| Access to outside space | ||
| No access | 7.6 | 7.3 |
| Access | 72.4 | 92.7 |
| Unpaid carere | ||
| No | 82.0 | 81.6 |
| Yes | 18.0 | 18.4 |
| Key worker | ||
| No | 76.6 | 77.5 |
| Yes | 23.4 | 22.5 |
| Change of working statusf | ||
| No | 56.7 | 57.0 |
| Yes | 43.3 | 43.0 |
| Dependents under 5 years | ||
| No | 90.3 | 89.1 |
| Yes | 9.7 | 10.9 |
Note:*data are weighted to more accurately reflect the Scottish population a Sex assigned at birth, b SEG categories A, B, C1= higher SEG; categories C2, D, E= lower SEG, c No MH = no pre-existing long-standing (>12 months) mental health condition; Yes MH = pre-existing long-standing (>12 months) mental health condition, d No PH = no pre-existing long-standing (>12 months) physical health condition; Yes PH = pre-existing long-standing (>12 months) physical health condition, e Unpaid caring responsibilities, f working from home, furloughed, reduction in paid employment
Layout and terminology
As outlined, this report presents both longitudinal findings (i.e., changes across the waves) and Wave 3 cross-section findings (including the new booster sample). Therefore, it should be noted the samples reported change depending on the analysis conducted.
The report focusses on the statistically significant differences across waves (Wave 2 to Wave 3 in particular) and the differences between key subgroups at Wave 3, rather than discussing findings for each of these subgroups according to each study measure. Subgroups in the longitudinal analysis were based upon responses to the Wave 1 survey (for comparability across the waves), and for the cross-sectional findings were based upon responses to the Wave 3 survey. Therefore, group membership for Wave 3 may differ slightly from the Wave 1 and Wave 2 analysis, as people's circumstances may change over time.
In addition, this report uses particular terms to describe the rates of the mental health outcomes reported by subgroups within the overall sample, and the degree to which an outcome is being experienced. The term 'rates' refers to the proportion of respondents within a named subgroup who have reported a particular outcome; it does not describe the degree of a particular outcome. For example, an increased rate of men reporting moderate to severe depressive symptoms means that a higher proportion of men have reported these symptoms; it does not mean that men as a subgroup are experiencing more severe depressive symptoms. The term 'level' refers to the degree to which a particular mental health or wellbeing measure is being experienced. For example, stating that older adults reported higher levels of mental wellbeing than younger age groups means that the average mental wellbeing score for older adults was higher than the average score for younger groups.
The main body of the report focuses on the core mental health outcomes of depressive symptoms, anxiety symptoms, suicidal thoughts, psychological distress (as measured by the GHQ-12 and another single item), and mental wellbeing for the subgroups outlined above. Additionally, a number of other indicators if mental health are reported more briefly, including loneliness, social support, defeat, entrapment, distress (as measured by a single item) and life satisfaction. Contextual measures, such as lifestyle factors and employment status, are also reported briefly. However, as they are not main outcomes only a selection of subgroup analyses are reported. Annex 3 to Annex 7 contain more detailed information on contextual factors.
Ethical approval was obtained on 21st May 2020 from the University of Glasgow's Medical, Veterinary and Life Sciences ethics committee to add a Scottish only sample to the existing UK study being led by the University of Glasgow (UK COVID-MH Ethics approval: 200190146).
Contact
Email: socialresearch@gov.scot