Scottish Budget 2026 to 2027: distributional analysis
Analysis of the estimated impact on household incomes resulting from tax, social security and public spending decisions made in the 2026-27 Scottish Budget and the 2026 Spending Review.
Part Three: Public spending
This section explores how public spending is distributed across households, focusing on resource spending for Health, Schools, Further and Higher Education, Early Learning and Childcare, and Transport. It offers a more comprehensive evaluation of the distributional effects of the 2026-27 Scottish Budget and the 2026 Scottish Spending Review.[9] The areas covered together represent approximately 70% of total resource spending, when the spending on Social Security is excluded, which is analysed in the earlier parts of this publication.[10]
Unlike taxes and social security, spending on public services does not directly affect household incomes. Instead, the average amount the government spends on different household types is estimated as a way to show the benefit they receive. In reality, the value of a service may be higher or lower than its cost and this can vary between groups and households.
As such, these estimates are not directly comparable to the tax and social security figures presented in parts one and two. The methods will continue to be tested and improved for future reports as the analysis expands to other areas. For details, see the methodology in the annex. As with previous sections, all figures represent the annual average spending across all households within in each quintile or type, not just those estimated to use these services. This approach ensures that amounts are comparable across different areas.
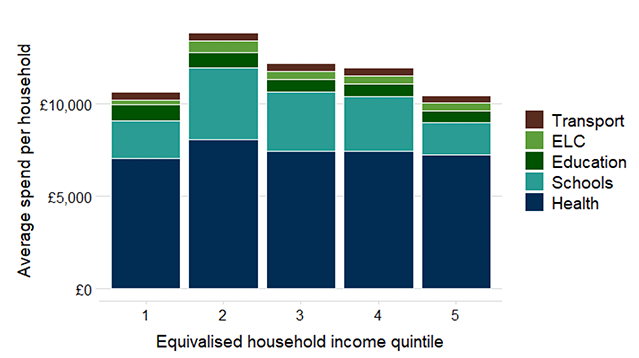
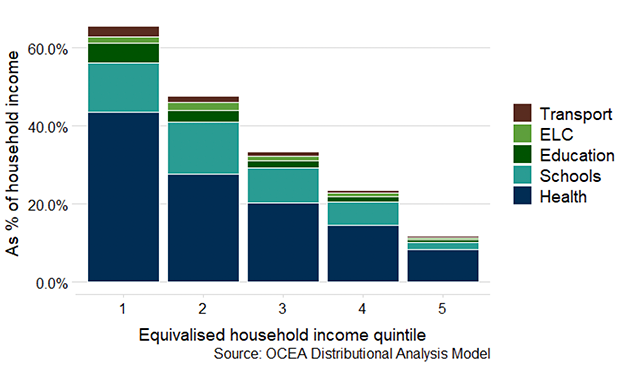
Figure 10 shows that most income quintiles receive similar average spending from public services considered, with the second quintile receiving the highest spending.
However, when combined with the progressivity of the tax-benefit system as presented in part 1, this results in a redistributive effect. Across all areas, spending represents a higher share of income for lower-income households.
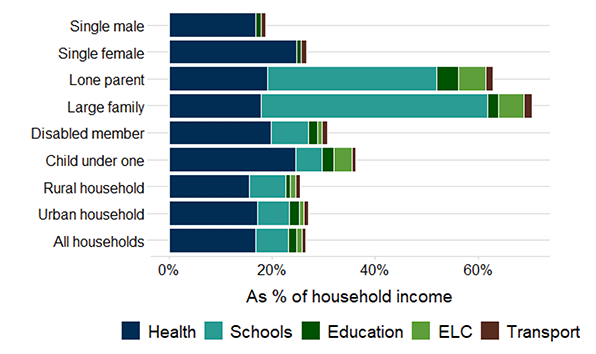
Figure 11 shows the impact of public spending on household types. It indicates that large families and lone parent households benefit the most from public spending considered in this section, primarily due to higher spending on Schools.
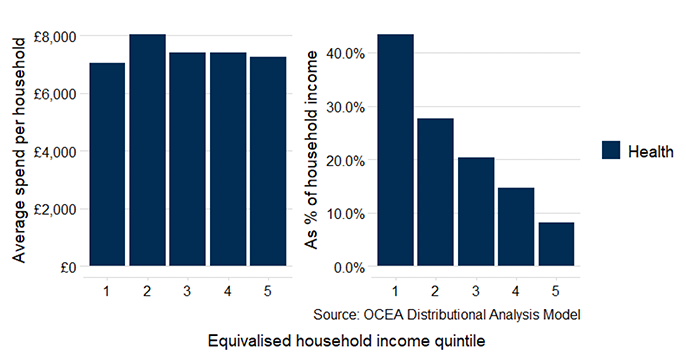
Health
Health resource spending covers NHS board, community health and mental health services. In this analysis, use of services is primarily modelled based on age and sex.[11] The impact is largely shaped by where households with older people fall within the income distribution. Whilst average cash spending is relatively similar, it is slightly lower in the bottom quintile, which includes fewer older people and more younger people. As a share of income, health spending has a greater impact on lower-income quintiles.
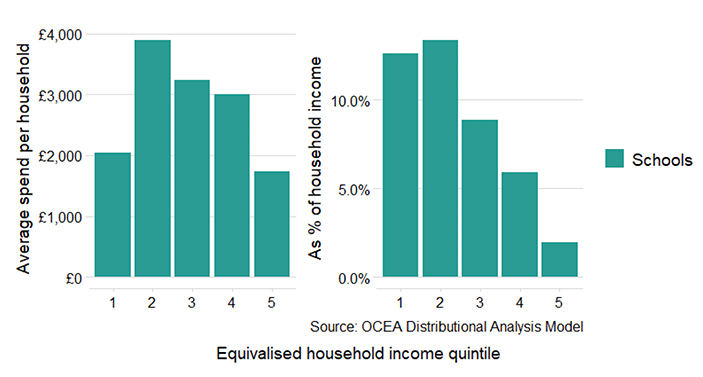
Schools
Schools resource spending covers primary, secondary and special schools. Spending is estimated to peak in the second income quintile, reflecting where households with children sit in the income distribution. Average spending is somewhat lower in the first quintile as it is estimated to have less households with children. Wider changes in the tax-benefit system, such as the removal of two child limit as covered in Box A, shifts some households with children from the first to the second quintile.
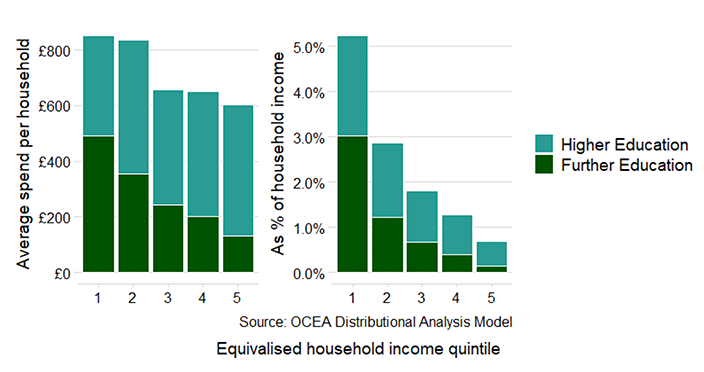
Education
Overall, spending on further and higher education is progressive both in cash terms and as a proportion of household income. Lower-income households receive more in cash terms (and as a share of income) from spending on further education than higher-income households. Higher-income households receive more resource spending on higher education than lower-income households in cash terms, although the gap is smaller than for further education.
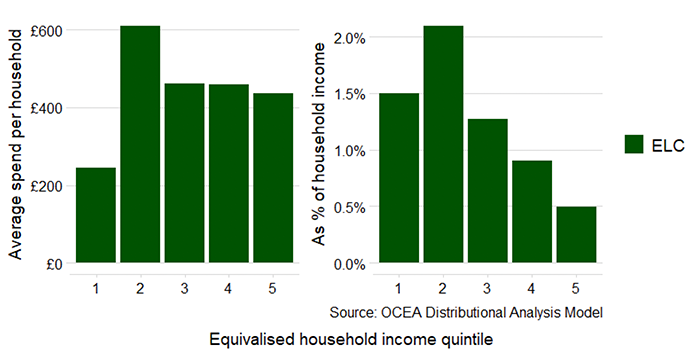
Early Learning and Childcare
The pattern of ELC spending is driven by the position of households with 3 and 4 year olds and eligible 2 year olds in the income distribution. The lifting of the two child limit under Universal Credit means that fewer households with eligible children sit in the lowest income quintile. This results in households in the second quintile benefiting the most in cash terms and as a share of income. Compared to the 2025-26 publication, there has also been a change in methodology – this moves some households with children higher in the income distribution.
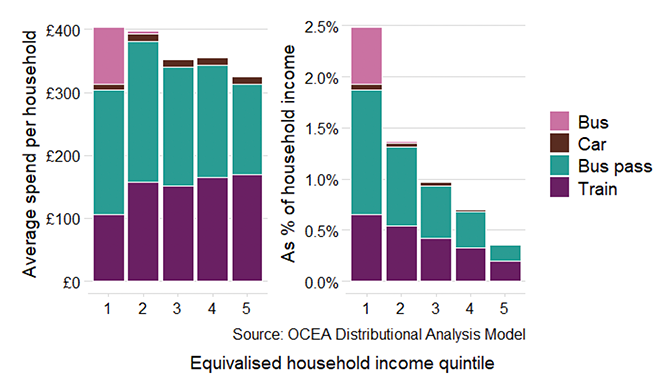
Transport
Total spending on Transport is somewhat progressive, both in cash terms and when measured as a share of income. Larger amounts are spent on road (cars) and rail which tend to be used more by higher-income households. In contrast, spending on bus services and concessionary travel is more focussed on lower-income households, making overall transport spending more progressive.
Box B: Distributional impact of the 2026 Scottish Spending Review at the end of the spending review period
The 2026 Scottish Spending Review (SSR), published with the 2026-27 Scottish budget, sets out spending plans from 2026-27 to 2028-29. Earlier analysis in this section shows the modelled distributional impact of 2026-27 public spending across the income distribution and household characteristics. This box explores the distributional impact of the SSR in 2028-29 based on areas covered by the distributional model. Public spending analysis models household-level use of public services with aggregated spending data. Although modelling multi-year spending decisions by individual spending lines is not feasible in the current model, assessing how spending changes (growth rate and allocation) offers insights into the distributional impact of the SSR.
The SSR shows aggregate spending is 10% (or 4% in real terms) higher by 2028-29 compared to 2025-26. Distributional impact of the SSR is shown by household quintile (from the poorest to the richest households) and household type, both in cash terms and as a share of household income. The estimated impact is not a direct cash transfer or income increase – it shows which groups benefit most from SSR spending changes. The impact is presented for the final year of the SSR period against the 2025-26 spending levels in each area, which are assumed to at least keep pace with inflation in future years in the absence of SSR. In other words, this analysis shows that households would benefit from spending that grows in real terms (i.e. grows above inflation).
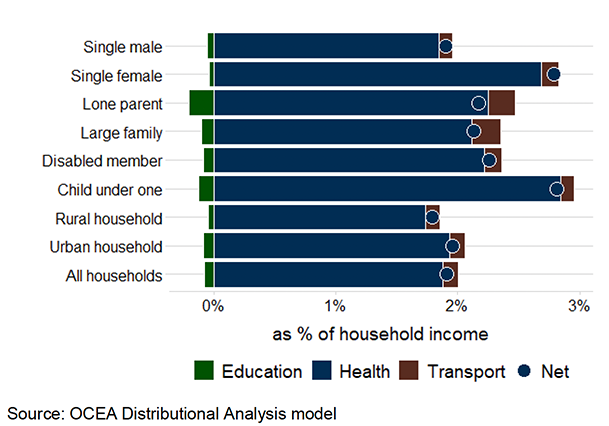
Figure B1 shows that the impact of the SSR decisions, measured as a share of household income, is progressive – lower-income households gain more (4.5% for the bottom quintile) than higher-income households (0.9% for the top quintile).
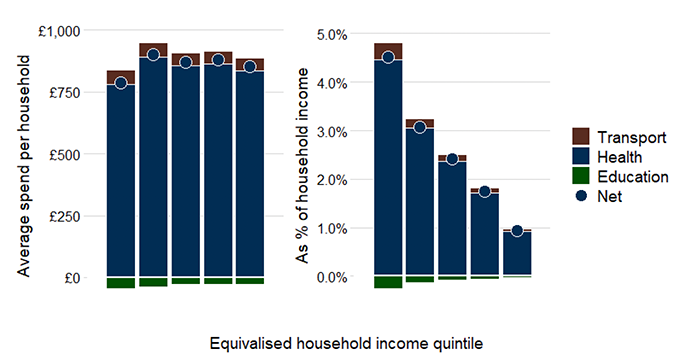
However, spending is somewhat similar across the distribution in cash terms, with the second quintile seeing the largest benefit in cash terms. This largely reflects relatively flat Health spending across all income quintiles and that this spending grows above inflation compared to the baseline. Spending on Further and Higher Education does not keep pace with inflation and creates small losses across all income groups, but the overall impact remains positive.
Social security spending is part of the SSR decisions and is likely to make the overall spending more progressive, both in cash terms and as a share of income. The progressive impact of Social Security spending is presented in Figure 1 in the first part of this publication whereas it is excluded from the public spending analysis as it does not represent an in-kind benefit like other areas of spending but a direct cash transfer to households.
As shown in Figure B2, families with children under one and single female households benefit the most from the SSR decisions through above-inflation spending on Health when the benefit is shown as a share of income. In cash terms, families with children under one and large families benefit the most.