Scottish Budget 2026 to 2027: distributional analysis
Analysis of the estimated impact on household incomes resulting from tax, social security and public spending decisions made in the 2026-27 Scottish Budget and the 2026 Spending Review.
Part One: Overall impact of the tax and social security system
Scotland’s tax and social security system is progressive: households with higher incomes contribute a larger share through income tax. This structure enables redistribution from higher-income to lower-income households, both through direct payments – covered in this section – and through funding for public services, which is analysed in part three of this report.
Figure 1 illustrates this by showing the combined effect of personal taxes and social security payments on household incomes in 2026-27 by income decile.[1] It includes devolved or local taxes (Scottish Income Tax and Council Tax), reserved taxes (including Employee National Insurance Contributions and Income Tax on savings and dividends), as well as both devolved and reserved social security payments.[2]

Scottish Income Tax has a greater impact on higher-income households, whereas social security payments primarily benefit those on the lowest incomes. However, the main social security components, including Universal Credit (UC) and the State Pension, remain reserved to the UK Government. Council Tax – net of reductions and discounts – has a greater relative impact on households with lower incomes whereas higher-income households pay a smaller proportion of their income. The net impact for Decile 1 is slightly lower than for Decile 2, primarily due to a higher Council Tax burden following recent increases by Local Authorities, despite Decile 1 paying less Scottish Income Tax and receiving a similar gain through the devolved and reserved Social Security support.
Taken together, taxes and social security redistribute income away from higher-income households toward those with middle and lower incomes. As Figure 1 shows, it is estimated that households in the first six deciles are net beneficiaries of the system, on average.
This analysis does not include indirect taxes or other reserved taxes that affect household finances, nor does it account for several significant measures announced in the recent UK budget, such as support for household energy bills through the Renewables Obligation. Distributional analysis of devolved benefits-in-kind is provided in part 3 of this publication.
Differences between Scotland and the rest of the UK
Since additional powers over certain taxes and social security payments were devolved to the Scottish Parliament in 2016, the tax and social security systems in Scotland have increasingly diverged from those in the rest of the UK.
Figures 2 and 3 illustrate how Scotland’s system compares with the rest of the UK system, incorporating the effects of policy changes announced in the 2026-27 Scottish and UK Government budgets. Figure 2 presents the annual impact as a proportion of household income, while Figure 3 shows the impact in cash terms.

Due to policy differences between the Scottish and UK governments on Income Tax and Social Security, households in the lowest five income deciles are, on average, better off in Scotland than in the rest of the UK. 62% of households are either better off or unaffected under Scotland’s system compared with the rest of the UK, with most of these households falling within the lower half of the income distribution. On average, households in the lower half of the income distribution are around £480 better off a year than they would be under UK Government tax and social security policies. An estimated 53% of households are better off.[3]
The Scottish Child Payment (SCP) is the primary driver behind better outcomes for low-income households compared to the rest of the UK system, while the impact on higher-income households is primarily shaped by Scotland’s Income Tax system.[4]

Impact by Household Type
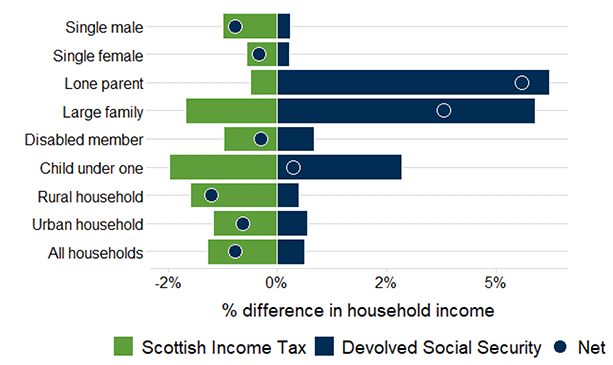
Along with examining impacts across income levels, it is useful to assess how policies affect different household types. Figure 4 compares Scotland’s tax and social security policies with those in the rest of the UK across eight household groups. These household types have been selected with reference to protected characteristics as defined in the Equalities Act 2010 and the priority household types used in Scottish child poverty analysis.
While 62% of households benefit or are not affected in the Scottish system compared to the rest of the UK, Figure 4 also indicates that households, on average, pay more in Income Tax in Scotland. Households with children are generally net beneficiaries, primarily due to support from the SCP. The impact of the removal of the two-child limit on Scottish households is explored in Box A.
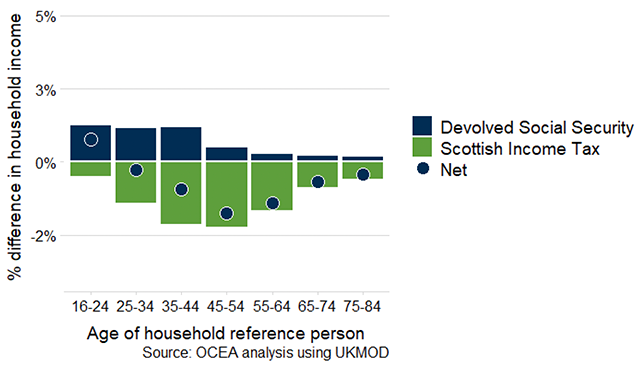
Figure 5 illustrates how differences in tax and social security systems vary according to the age of the household reference person. It shows that the impact is greater on middle-aged individuals (those aged 35 to 54), where average incomes peak.
For older households this effect is smaller as retirement or reduced working hours lowers incomes. In contrast, differences in social security payments are most significant for younger households, who are more likely to have children, largely due to the SCP.
Box A: Impact of removing the two-child limit and interactions with the wider Social Security system in 2026-27
This publication focuses on devolved taxes and social security, where the Scottish Government has power to set policy. However, household incomes are also affected by recent changes in UK Government policy over reserved taxes and social security payments, which affect the Scottish Government social security expenditure.
One significant UK Government change announced in the Autumn Budget 2025 was the removal of the two child limit which restricts Universal Credit (UC) to the first two children in most households. This policy affects those born from 6 April 2017. The Scottish Government planned to mitigate this policy through a new Two-Child Limit Payment (TCLP), which was expected to lift 20,000 children in Scotland out of relative poverty.[5] With the UK Government’s decision to remove the limit, this intervention is no longer required.
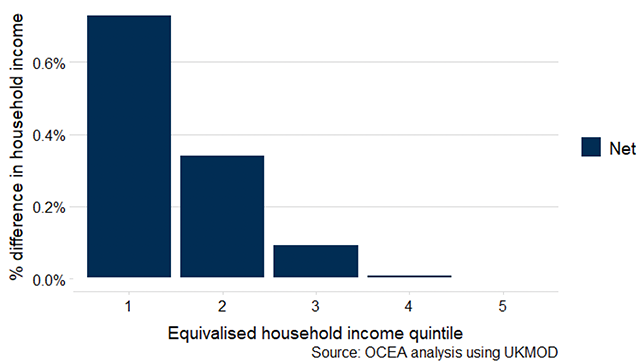
The analysis presented below explores the impact of the UK government’s removal of the two child limit on households in Scotland in 2026-27.[6] Figure A1 shows that households who benefit are mostly in the lowest three quintiles of the income distribution, with 60% of households benefiting in the lowest income quintile. This shows the net impact on household incomes, after considering interactions with the wider benefit system. Across all households in the lowest quintile, household incomes increase by 0.73% on average, compared to no change in the top quintile.
Households could benefit by an extra £303.61 a month per child and the average gain to households who benefit is around £4,434 a year. A small proportion of households whose UC increases after lifting the two child limit will still be restricted by the benefit cap, which gives an upper limit to the total amount of UC a household can receive. In May 2025, 0.6% of households receiving UC in Scotland had their benefit capped.[7] Some households will be exempt from the cap if they receive certain benefits.
In Scotland, households affected by the benefit cap can apply for a Discretionary Housing Payment (DHP). The amount that can be mitigated is at most their housing costs, which may not fully cover the amount they are capped by. The Scottish Government’s total spending on DHPs for benefit cap mitigation is forecast to be £15.5 million in 2026-27, up from £6.1 million in 2025-26..
Some households, whose income is high enough for their UC payment to be fully tapered away, would start to receive a UC payment when the two child limit is lifted. These households would in turn become eligible for devolved benefits that are linked to receipt of UC, including Scottish Child Payment, Best Start Grant, Best Start Foods, Free School Meals and School Clothing Grant.
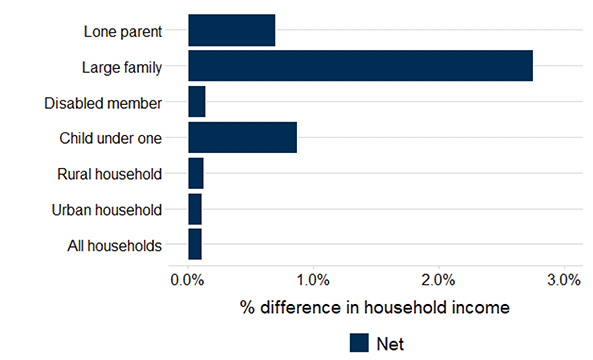
Removing the two-child limit benefits larger families with three or more children. These families are identified as one of the six priority family types most at risk of poverty under the Scottish Government’s Tackling Child Poverty approach. Figure A2 shows that across all large families, households see an increase of over 2.5% in income, though the impact varies within this group. Families with more than three children gain the most, while some larger families will not benefit at all if they are not eligible for Universal Credit. Lone parent families and those with a child under one experience above average gains, reflecting their higher likelihood of being affected by the policy change.
Source: OCEA Distributional Analysis model