Scottish Budget 2026 to 2027: distributional analysis
Analysis of the estimated impact on household incomes resulting from tax, social security and public spending decisions made in the 2026-27 Scottish Budget and the 2026 Spending Review.
Part Two: Analysis of 2026-27 Budget decisions
This section analyses the impact of the tax and social security policy decisions made or confirmed in the 2026-27 Scottish Budget:
- An increase in the Basic and Intermediate rate thresholds by 7.4%.
- Freezing the Higher rate, Advanced rate and Top rate thresholds at £43,662, £75,000 and £125,140 respectively.
- A change to the Pension Age Winter Heating Payment (PAWHP) compared to the version announced in 2025-26 Scottish Budget, so that it is paid to all pensioners and the payment is recovered through taxation from those pensioners with a personal income of over £35,000 per year.
These are assessed against an assumed ‘no policy change’ counterfactual. This consists of:
- Uprating most social security payments and Scottish Income Tax bands (excluding the Personal Allowance) with inflation – including the Top rate thresholds given the SFC’s approach to baselines.[8]
- A PAWHP as announced at the 2025-26 Scottish Budget, which restricts eligibility for full payments to households receiving a qualifying benefit and pays a lower payment of £100 to all other pensioner households.
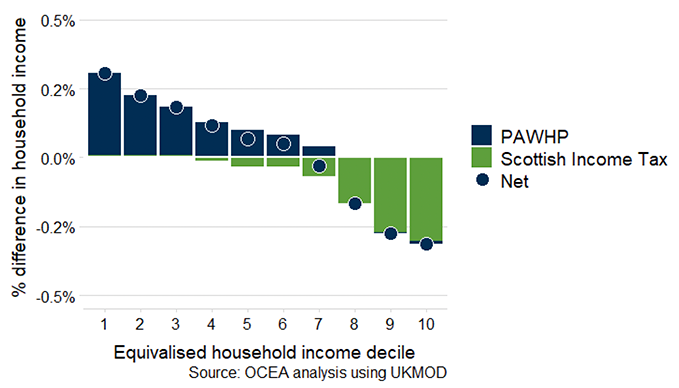
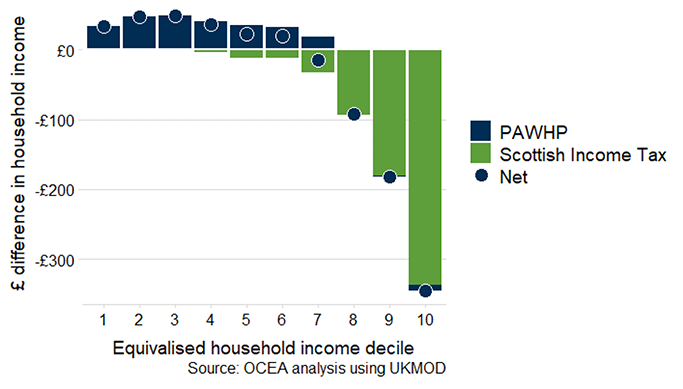
Council Tax is assumed to rise in line with the September 2025 CPI, though local authorities will set their own rates after the Scottish Budget. In addition, the Cabinet Secretary announced the introduction of two new bands for high-value properties in this budget, which is not included in this analysis as the policy will be developed further and will take effect from April 2028. Since social security payments have also been uprated for inflation and no major policy changes were introduced beyond those already noted for 2026-27, the following charts focus on the impact of changes to Income Tax and PAWHP. Figures 6 and 7 show how Budget decisions affect household incomes, both as a share of income and cash terms.
The change to PAWHP, which extends payments to all pensioners earning less than £35,000 a year, is estimated to have a progressive impact, with households in the second and third deciles benefitting the most. Compared to the policy announced in the 2025-26 Scottish Budget, the new approach provides a higher payment to all pensioners, while recovery of payment only affects those in higher-income households with earnings above the £35,000 threshold.
The Income Tax policy further increases the progressivity of the tax-benefit system in 2026-27, with lower-income households benefitting slightly from increases to the Basic and Intermediate rate thresholds, while higher-income households experience a reduction in income due to the freeze on higher income tax thresholds.
There are also indirect effects arising from these tax changes. Universal Credit entitlement is assessed on post-tax income, so reductions in net income for some households may lead to new eligibility for UC. This then leads to entitlement to passported benefits such as SCP. Conversely, some households already receiving UC who pay less tax as a result of the changes may see an increase in post-tax income, which could lead to a reduction in their UC award as more of their entitlement could be tapered away.
As Figure 8 shows, the Budget decisions on Income Tax mainly have a negative impact on households with working age members, who are more likely to pay tax, whereas pensioner households tend to benefit from the increased PAWHP award.
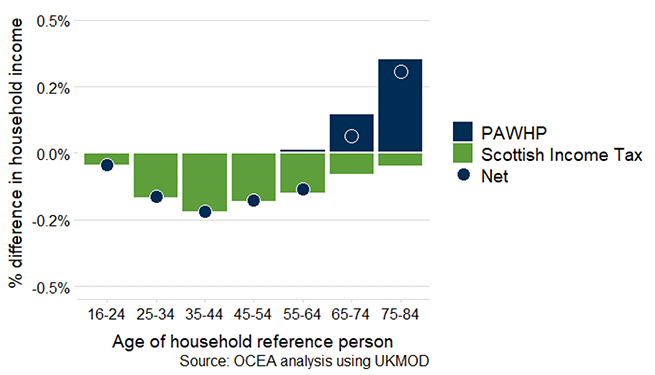
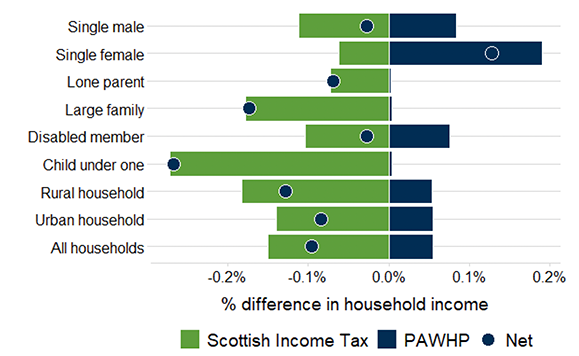
Figure 9 also analyses the impact by the same household types as used in Figure 4. Whilst all household types are estimated to see a reduction in income due to higher Income Tax payments, some households benefit from increased support through PAWHP. Single female households are net beneficiaries because of their lower incomes – they are less likely to be impacted by tax freezes.