Scotland's Climate Change Plan: 2026–2040
This Climate Change Plan (CCP) sets out the policies and proposals we will take forward to enable our carbon budgets to be met between 2026 and 2040.
Annex 3 – Monitoring and Analytical Annex
Contents
Monitoring and Evaluation of the Climate Change Plan
Analytical Annex
- Section Overview
- Buildings (Residential and Public)
- Transport
- Waste Management
- Energy Supply
- Business and Industrial Process
- Negative Emissions Technologies
- Agriculture
- Land Use, Land Use Change, Forestry
CCP Policy List
- Buildings (Residential and Public)
- Transport
- Waste
- Energy Supply
- Business and Industrial Process (including NETs)
- Agriculture
- LULUCF
Monitoring and Evaluation of the Climate Change Plan
Background and Structure
Introduction
The Monitoring and Evaluation (M&E) framework presented below will be used to assess whether the policies and proposals within the Climate Change Plan (CCP) are being implemented as intended and whether the required emissions reduction and just transition outcomes are being realised in delivery. It provides the primary evidence base through which Ministers assess progress and fulfil their statutory duties to report to Parliament on whether Scotland is on track to meet its emissions-reduction targets.
The framework combines greenhouse gas emissions statistics with quantitative indicators of progress towards policy outcomes and qualitative commentary on policy implementation, to provide a comprehensive picture of progress. This reflects the understanding that emissions reductions depend on a combination of effective policy delivery, technological and behavioural change, and positive enabling conditions. Monitoring therefore extends beyond emissions data to capture evidence of the broader drivers of change.
Delivering net zero in a way that is fair and inclusive is a core commitment of the Scottish Government. A set of cross-sectoral just transition indicators is included within the framework to help assess whether the transition to net zero is supporting good jobs, reducing inequalities, and avoiding disproportionate impacts on particular groups or places. We are grateful to the Just Transition Commission, whose commissioned research and constructive advice has informed the development of these indicators.
The framework is grounded in the best available evidence and is designed to evolve over time as our understanding of delivery improves. As new data sources and analytical approaches emerge, including potential enhancements proposed by the Scottish Science Advisory Council, we will consider these alongside the application of the framework in producing the first annual progress report under the new CCP in 2027. This will provide an early opportunity to refine or expand the indicator set where supported by robust evidence.
Together, the approach to monitoring and evaluation as outlined below is designed to support ongoing scrutiny of the CCP, inform future policy development, and provide stakeholders and the public with a clear and accessible account of progress towards Scotland’s climate and just transition ambitions.
Principles of the monitoring framework
The development of the M&E framework has been guided by the following set of principles to ensure that monitoring and evaluation is robust, transparent, and proportionate, supporting effective delivery of the Plan over time.
1. Monitoring will focus on the most material sources of emissions and the key actions required to deliver emissions reduction in line with just transition principles, avoiding unnecessary complexity while providing sufficient detail to support meaningful assessment.
2. Where possible, indicators and target metrics are defined and evaluated consistently over time, in line with SMART principles (Specific, Measurable, Achievable, Realistic and Time-bound), to support the identification of trends and enable comparison across reporting periods.
3. The information required to evidence outcome attainment is publicly available, published regularly and presented in a clear and accessible way to support scrutiny by stakeholders and the public.
4. The framework is designed to provide timely insight into delivery and emerging risks. It will serve as the primary means with which to assess any risk to achieving our carbon budgets and meeting our just transition commitments. Where risks to budget attainment arise, we will adjust delivery and broaden the ambition of the policy response as needed.
5. Monitoring and evaluation makes use of the best available evidence and is used to inform learning over time. The framework will continue to evolve in response to improvements in data availability, analytical methods, and experience of policy delivery.
6. Monitoring is undertaken in a way that supports consideration of fairness and inclusivity, including through the use of just transition indicators alongside emissions-focused metrics.
What’s changed in this Climate Change Plan
As part of the development of this Climate Change Plan, emissions pathways have been produced for each major sub-sectoral source of greenhouse gas emissions. These pathways set out the expected rate and scale of emissions reduction for individual emissions sources over each Carbon Budget. When sub-sectoral pathways are combined, they form sectoral emissions envelopes, and when aggregated across sectors, as defined in the Climate Change Act, align with Scotland’s overall carbon budget.
Sectoral outcomes have been revised to reflect this approach. Each major sub-sectoral source of emissions now has a quantified outcome formulated around emissions pathways.
Example formulation of a sub-sectoral outcome: 'Emissions from cars should total less than 18 MtCO2e between 2026-2030'.
In this way, outcomes provide a clear means of articulating what success looks like and enables progress to be statistically evaluated consistently over time.
Indicators have been identified to align with these sub-sectoral emissions sources. This helps ensure that monitoring focuses on the key activities, behaviours, and system changes that are expected to deliver the emissions pathways, strengthening the link between policy delivery, outcomes, and emissions reduction.
The monitoring framework also incorporates an expanded set of just transition indicators. These indicators support consideration of whether the transition to net zero is being delivered in a way that is fair and inclusive and provide additional transparency on distributional and socioeconomic impacts.
Components of the monitoring framework
The updated monitoring framework for the Climate Change Plan is built around four complementary elements that, together, provide a comprehensive view of progress in delivering emissions reductions and supporting a just transition:
- Greenhouse gas inventory emissions statistics;
- Emissions-reduction indicators;
- Just transition indicators; and
- The policy tracker.
Greenhouse Gas Emissions Inventory Statistics
Greenhouse gas (GHG) emissions statistics allow progress in reducing emissions to be assessed at national, sectoral, and sub-sectoral levels. These statistics provide the authoritative measure of emissions performance against statutory targets and carbon budgets for all governments across the UK.
Statistics are published annually, typically in June, and two years in arrears. For example, the most recent figures, published in June 2025, cover emissions up to and including 2023. Monitoring reports used to assess the previous Climate Change Plan update were published in May, using GHG data that was effectively lagged by 3 years.
To support more timely and effective monitoring of progress against statutory climate targets, the publication timetable for the CCP monitoring reports has been revised and, going forward, will be published after release of the latest GHG Inventory data. This should strengthen the evidence base available to Ministers, support earlier identification of delivery risks or underperformance, and improve transparency around progress towards targets. It will also benefit stakeholders by bringing together the most up-to-date emissions data, indicator trends and policy delivery information within a single report, while recognising that a structural time lag which is out with the Scottish Government’s control in GHG reporting remains and must continue to be addressed through complementary indicators and analysis.
GHG emissions statistics will be used to assess progress against the sub-sectoral emissions outcomes set out in the Climate Change Plan and to inform judgements about the likelihood of achieving Scotland’s national emissions targets. Emissions data will continue to provide the definitive measure of progress, complemented by indicators and other monitoring evidence described elsewhere in this chapter.
Emissions-reduction indicators
Emissions-reduction indicators complement GHG emissions data. There are two types of emissions-reduction indicators: outcome indicators and enabling indicators. Emissions-reduction outcome indicators track progress in delivering the key actions and changes expected to contribute to emissions reduction (for example, hectares of new woodlands planted). Emissions-reduction enabling indicators provide contextual evidence on the conditions that influence effective policy delivery (for example, the share of short journeys under 5kms made via walking or cycling).
For this Climate Change Plan, the set of outcome indicators used to evidence the 2020 Climate Change Plan update (CCPu) monitoring reports were reviewed to ensure that they reflect revised policy commitments and to improve the quality and clarity of indicators. This has led to new outcome and enabling indicators being identified, others being revised, and several being removed where issues with timeliness of data availability, relevance to the policy package, or ease of interpretation were identified. The overall set of indicators is now 36 including the new Just Transition specific indicators, relative to the 43 previously used for the CCPu.
1. Emissions-reduction outcome indicators
Emissions-reduction outcome indicators are specific, objective measures closely aligned with achieving the sub sectoral outcome. Where possible, these directly capture the key actions required to deliver the level of emissions abatement consistent with the emissions pathways; for example, hectares of new woodland required to be planted.
In some cases, data limitations mean it has not been possible to identify indicators that directly measure these actions. In such instances, emissions-reduction indicators reflect the changes in the policy environment that are expected to arise from the policies and proposals set out in the Climate Change Plan; for example, measuring emissions from industrial emitters captured within the traded sector of the Emissions Trading Scheme (ETS).
Emissions-reduction indicators underpin monitoring of progress towards sub-sectoral outcomes and are designed to be sensitive to change in the near term. This allows them to complement time-lagged greenhouse gas emissions data, providing earlier insight into whether delivery is progressing at a pace and scale consistent with expectation. Specific milestones are set for indicators, where appropriate, setting out the level of ambition consistent with achieving the sub sectoral outcome.
2. Emissions-reduction enabling Indicators
Enabling indicators track the wider system conditions that support or constrain progress towards emissions-reduction outcomes. They capture behavioural, market, infrastructure and system-readiness factors that influence whether policies can be delivered effectively and at the pace assumed in the emissions pathways.
In transport, enabling indicators focus on modal shift; including the proportion of short journeys made by walking or cycling, the proportion of longer journeys made by bus or rail, and household access to a bicycle. These indicators provide insight into behavioural change and the practical conditions required to reduce car dependency over time.
In energy supply, enabling indicators track renewable generation capacity (both installed and at planning stages) and system reliability through Loss of Load Expectation. Together, these provide a forward-looking view of deployment momentum and energy security as the electricity system decarbonises.
In waste, total waste generation (excluding soils and mineral waste from construction and demolition) is monitored as a directional indicator of resource efficiency and upstream prevention - a key condition for reducing emissions from the sector.
Enabling indicators are assessed on a directional or year-on-year change basis, depending on the metric, and are considered alongside outcome indicators, emissions data and policy implementation evidence. They provide insight into whether the conditions necessary for sustained emissions reduction are strengthening and help identify emerging constraints or delivery risks.
Just transition indicators
Our commitment to a just transition to net zero remains unwavering and, as such, this underpins Scotland’s carbon budget targets. The inclusion of just transition indicators in the CCP M&E framework represents a significant milestone in our commitment to embed the just transition principles across all aspects of climate policy. To our knowledge, Scotland is the first country to include a dedicated set of just transition indicators within annual statutory reporting.
Unlike the emissions-reduction indicators outlined above, just transition indicators are cross-cutting and apply to the Plan as a whole, rather than aligned with specific emissions sources. This reflects the cross-sectoral nature of just transition, which requires a coordinated economy- and society-wide response. Whilst it may be possible to make links between some indicators and specific sectors (e.g. Fuel Poverty with Buildings, or Community Benefits with Energy Supply), the indicators are intended to be considered together to give a holistic assessment of the extent to which the CCP is supporting progress towards a just transition.
Key to monitoring the delivery of a just transition to net zero[272] is understanding how our policies and proposals affect different societal groups and geographic regions across Scotland. The indicators aim to address this need by combining metrics that provide a single whole-of-Scotland measure with those that focus on specific sub-groups of the population, including:
- Communities and workers facing significant impacts as a result of their close connections with particular carbon intensive industries.
- Places with significant local net zero infrastructure and land use change
- Differentiated rural, urban and island community impacts
- Businesses
The indicators draw on an extensive evidence base, developed with key stakeholders, particularly the Just Transition Commission. By reporting on them as part of the CCP monitoring and evaluation, we intend to provide an overview of progress on delivering our emissions reduction ambitions in a way that is fair and just.
The draft Climate Change Plan proposed and sought views on 14 just transition indicators. The most common theme emerging from consultation responses related to the transport affordability indicator, which some respondents suggested should be disaggregated by income level or mode of transport, to give a more meaningful measure of transport poverty. Based on these responses and given the data source does not allow for a breakdown by mode, we have altered the indicator to include a breakdown by household income. In addition, we have re-categorised two of the other draft just transition indicators – covering woodland creation and peatland restoration – as emissions reduction outcome indicators, given this is their primary focus.
There will be room for improvement on the indicators, given this is the first time they will be used. There are gaps in the data required to directly measure key aspects of a just transition and, in several instances, we rely on proxy metrics to provide a best estimate of progress. We have been working to improve data availability, including through the development of the Scottish Climate Survey. This work will continue after publication of the CCP and, as new data sources emerge, we will seek to update and improve these indicators.
We know that it is not possible for a small set of metrics to provide a complete assessment of whether we are delivering a just transition for Scotland. The complex, dynamic and multi-layered range of outcomes that the Scottish Government has identified for Scotland’s wider just transition extend beyond the CCP and the CCP monitoring process. We are therefore developing a dedicated just transition M&E framework, which will incorporate an expanded suite of measures of justice relating to both climate change mitigation and adaptation. We aim to set out proposals for this framework within the next 12 months.
Policy Tracker
The Climate Change Plan sets out a package of specific policies and proposals across sectors to deliver the policy outcomes and emissions reductions required to meet Scotland’s climate targets. As was the case with CCPu M&E, progress in implementing these policies and in developing proposals will be monitored through a policy tracker.
The policy tracker provides a structured overview of delivery status, capturing key milestones such as policy development, consultation, implementation, and ongoing delivery. It supports transparency around progress and helps signal where policies are on track, where delivery is at risk, and where further action or intervention may be required.
As part of annual monitoring reports each of the 163 policies and commitments set out in the CCP will be qualitatively assessed, with progress addressed relative to expectation and specific implementation milestones.
Summary of indicators
The following tables summarise the suite of indicators that will be used to monitor and evaluate progress in delivering the policies and proposals set out in the Climate Change Plan.
Emissions-reduction indicators are aligned to sub-sectoral sources of emissions. This reflects the structure of the annual CCP monitoring reports and is intended to clearly demonstrate the relationship between policy delivery, changes captured by indicators, and progress towards the sub-sectoral emissions outcomes. As discussed above, just transition indicators are applied to the delivery of the Plan as a whole, rather than aligned to specific sources of emissions.
The following information is provided for every indicator in the framework:
- Indicator – a short description of the metric used to track progress.
- Expected trend – an explanation of how trends in the indicator will be interpreted (for example, against a defined target, a pathway-based trajectory, or a basic directional change).
For emissions-reduction indicators, the following additional information is provided:
- Emissions Source – the sub-sectoral source of emissions the indicator is linked to.
- Type – whether the indicator is an outcome indicator (directly linked to achieving emissions reductions) or an enabling indicator (capturing supporting conditions or contextual factors).
Alongside this M&E process, the Scottish Government keeps track of a broad range of other indicators and data to ensure that there is coherence and responsiveness between our climate goals and other priorities such as growing the economy and eradicating child poverty.
Emissions-reduction indicators
Transport
| Indicator | Emissions source | Type | Expected trend |
|---|---|---|---|
| Percentage of new car registrations that are Zero Emissions Vehicles | Cars | Outcome | Increase in new EV sales in line with CCC advice, 90% of new car sales to be zero emission by 2030. |
| Percentage reduction in car kilometres | Cars | Outcome | In line with CCC advice, progress towards target of reducing kilometres driven by 4%, relative to the business as usual baseline for car demand |
| Percentage of short journeys (under 2/5km) made via walking or cycling | Multiple | Enabling | Increasing over time |
| Percentage of households with access to a bike | Multiple | Enabling | Increasing over time |
| Percentage of longer journeys (over 5km) made via bus or rail | Multiple | Enabling | Increasing over time |
| Percentage of new van registrations that are Zero Emissions Vehicles | LGVs | Outcome | Increase in new EV sales in line with CCC advice.100% of new van sales to be zero emission by 2030. |
| Percentage of new bus registrations that are Zero Emissions Vehicles | Buses | Outcome | Increasing over time |
| Percentage of new HGV registrations that are Zero Emissions Vehicles | HGVs | Outcome | Increase in new zero-emission vehicle sales in line with CCC advice. 23% of new HGV sales to be zero emission by 2030. |
Business and industrial processes
| Indicator | Emissions source | Type | Expected trend |
|---|---|---|---|
| Emissions from industry ETS traded sector (industrial sites only) | Industrial processes | Outcome | Emissions to fall by 24% between 2026–2030 |
Energy Supply
| Indicator | Emissions source | Type | Expected trend |
|---|---|---|---|
| Electricity grid intensity (CO2e per kWh) | Power stations | Outcome | Maintain below 40 g CO2e per kilowatt hour |
| Installed capacity of renewable generation (GW) | Power stations | Enabling | Increasing over time |
| Renewable capacity at planning stages (GW, 3 categories) | Power stations | Enabling | Increasing over time |
| Loss of Load Expectation (hours per year) | Power stations | Enabling | Maintain GB standard below 3 hours per year |
| Household waste incinerated | Energy from Waste | Outcome | Projected to increase until 2028 then gradually reduce[273] |
Land Use, Land Use Change and Forestry (LULUCF)[274]
| Indicator | Emissions source | Type | Expected trend |
|---|---|---|---|
| Hectares of woodland created | Forestry | Outcome | Progress towards target of planting approximately 78,000 hectares between 2026–2030 |
| Hectares of peatland restored | Peatland | Outcome | Progress towards target of restoring 400,000 hectares by 2040 |
Buildings (Residential and Public)
| Indicator | Emissions source | Type | Expected trend |
|---|---|---|---|
| Number of buildings using low and zero direct emissions heating (LZDEH) systems | Buildings | Outcome | 35,000 additional buildings convert to LZDEH over 2026-2030 |
| Number of homes with EPC C or above (or equivalent) | Buildings | Outcome | 134,900 domestic properties in total to achieve EPC C+ (or equivalent) over 2026-2030 |
Waste Management
| Indicator | Emissions source | Type | Expected trend |
|---|---|---|---|
| Tonnage of biodegradable municipal waste (BMW) landfilled | Landfill | Outcome | Progress towards zero biodegradable municipal waste being landfilled in 2028 |
| Waste tonnage generated (excluding soils and mineral waste from construction & demolition) | Waste generation | Enabling | Decreasing over time |
Agriculture[275]
| Indicator | Emissions source | Type | Expected trend |
|---|---|---|---|
| Engagement with Farm Advisory Services on environmental issues and climate change | All Sources | Enabling | Increasing over time |
| Use of nitrogen fertilisers | Cropland / soils | Outcome | Decreasing over time |
| Total overall nitrogen application rates | Cropland / soils | Outcome | Decreasing over time |
| Average age at slaughter of prime animal | Livestock | Outcome | Decreasing over time |
| Woodland area on agricultural land | Cropland / soils | Outcome | Increasing over time |
Just Transition indicators
| Indicator | Expected trend |
|---|---|
| Percentage of people satisfied with participation in net zero decision making | Increasing over time |
| Operational capacity of community energy | Increasing over time |
| Average value of community benefits | Meet or exceed the Scottish Government Good Practice Principles for community benefits |
| Percentage of people reporting improvements to their local area as a result of net zero infrastructure or land use change | Maintaining or increasing over time |
| Percentage of dwellings in fuel poverty | Statutory Fuel Poverty targets: ≤5% fuel poverty and ≤1% extreme fuel poverty by 2040 |
| Percentage of people that can afford their transport costs | Increasing over time |
| Employment rate in oil and gas communities | Maintaining or increasing over time |
| Proportion of households managing well financially in oil and gas communities. | Maintaining or increasing over time |
| Number of recipients of the Oil and Gas Transition Training Fund | Fund sufficient to meet demand |
| Number of people employed in low carbon and renewable energy economy | Increasing over time |
| Proportion of small businesses reporting energy prices as an obstacle | Decreasing over time |
| Emissions of the eight priority Air Quality pollutants | Decreasing over time |
Indicator evaluation
The following section provides a detailed assessment of each indicator included in the monitoring framework, using the evaluation criteria set out in Table 9. Applying these criteria to each indicator in turn provides a consistent and transparent basis for assessing the strength and limitations of the monitoring framework. It also helps identify where indicators provide high evidential value, where interpretation should be cautious, and where further development or data improvement may be required.
| Criterion | Description | Low | Moderate | High |
|---|---|---|---|---|
| Relevance | The indicator should relate clearly to the emissions source, pathway or just transition outcome it is designed to monitor | Minimal or indirect relationship to emissions reduction or just transition | Some relationship to emissions reduction or just transition but indirect or partial | Clear and direct relationship to the emissions pathway or just transition outcome |
| Representative-ness | The indicator should capture the key drivers or system changes required to deliver the emissions pathway or just transition outcome | The indicator doesn’t capture the key drivers of the expected emissions reduction or just transition outcome | Represents some important drivers but not the full picture | Represents the key drivers of just transition or emissions change within the sub-sector |
| Data availability | Data should be regularly published, accessible and sufficiently robust | Data unavailable, restricted, irregular or highly uncertain | Data available but with limitations (lag, infrequent updates, quality caveats) | Data regularly published, accessible, and statistically robust |
| Sensitivity to change | The indicator data must be capable of detecting meaningful change relative to expected delivery within a carbon budget period | Changes cannot be reliably detected due to sample size, variability, or infrequent data collection | Some change detectable but small deviations from expectation may not be statistically distinguishable | Data precise and frequent enough to detect small but meaningful changes against expected trajectory |
| Interpretability | The indicator should be understandable to non-expert stakeholders and allow clear interpretation of direction of travel | Difficult to interpret; direction of success ambiguous | Some technical interpretation required | Direction of success clear and easily understood |
| Practicality | Indicator should be cost-effective to use and have low resource requirements for data collection and analysis | Prohibitively expensive and/or impractical to use indicator data | Moderate resource requirements | Cost-effective and low-resource to use indicator data |
Transport
TRANSPORT 1 - Zero Emission Vehicle (ZEV) car registration
| Indicator Title | % of new car registrations that are Zero Emission Vehicles |
|---|---|
| Description | Proportion of newly registered cars in Scotland each year that are zero emission vehicles (battery electric or hydrogen fuel cell), indicating the rate of fleet decarbonisation. |
| Data Source | Department for Transport (DfT) and Driver and Vehicle Licencing Agency (DVLA) |
| Expected trend | Following CCC advice, progress towards achieving 90% of new car registrations being zero emission vehicles by 2030, assessed annually against the expected uptake trajectory consistent with the car emissions pathway. |
| Unit | Percentage (%) of new car registrations. |
| Limitations and data development | Indicator reflects new registrations only and does not capture the emissions performance of the existing fleet or total vehicle kilometres travelled. Emissions impacts materialise over time as fleet turnover occurs. Data is robust and population-based, though classification of vehicle types may evolve as technologies develop. |
| Criterion | Assessment | Rationale |
|---|---|---|
| Relevance | High | Fleet turnover is a primary driver of long-term emissions reductions from cars. Increasing ZEV share directly supports the car emissions pathway. |
| Representativeness | Moderate | Captures new vehicle uptake but does not reflect the existing fleet, total vehicle kilometres, or modal shift. |
| Data availability | High | Published annually in Scottish Transport Statistics; consistent methodology and good coverage. |
| Sensitivity to change | High | Highly responsive to policy, market and infrastructure changes; year-on-year shifts detectable. |
| Interpretability | High | Simple percentage measure; direction of success (increase) is clear. |
| Practicality | High | Based on existing administrative data; minimal additional resource required. |
TRANSPORT 2 - Reduction in car kilometres
| Indicator Title | % reduction in car kilometres |
|---|---|
| Description | Percentage reduction in total car vehicle kilometres travelled in Scotland relative to the baseline year, reflecting progress in reducing car use consistent with the transport emissions pathway. |
| Data Source | Scottish Transport Statistics (Transport Scotland), based on National Road Traffic Estimates. Published annually. |
| Expected trend | Progress towards achieving a 4% reduction in car kilometres by 2030, relative to the business as usual baseline for car demand; assessed against the expected trajectory consistent with the car emissions pathway. |
| Unit | Percentage (%) reduction relative to baseline year. |
| Limitations and data development | Estimates are derived from traffic count data and modelling that uses UK rather than Scottish specific trends. This may be subject to revision and, should Scottish driving behaviours significantly diverge from UK ones, then the estimates may not properly reflect these differences. Data is published annually, typically with approximately a one-year time lag, which limits real-time assessment. The indicator captures distance travelled but does not reflect vehicle occupancy, vehicle efficiency, or fleet electrification; therefore, it should be interpreted alongside ZEV uptake and modal shift indicators. Short-term volatility (e.g. economic conditions, fuel prices, weather events) may influence year-on-year change. There is uncertainty in baseline forecast demand for car travel, which is influenced by a wide range of factors and may be revised as required across the CCP period. |
| Criterion | Assessment | Rationale |
|---|---|---|
| Relevance | High | Total car kilometres travelled is a primary driver of transport emissions and directly affects fuel consumption and tailpipe emissions. |
| Representativeness | High | Captures behaviour across the entire car fleet and reflects one of the largest structural drivers of transport emissions. |
| Data availability | High | Published annually in Scottish Transport Statistics using established national traffic estimates methodology. |
| Sensitivity to change | Moderate | Large-scale changes are detectable; however, small year-on-year changes may fall within modelling uncertainty or natural traffic variability. |
| Interpretability | High | Direction of success (reduction) is clear and easily understood by stakeholders. |
| Practicality | High | Based on existing national traffic monitoring systems; no additional data collection required. |
TRANSPORT 3 - Mode of travel for short journeys
| Indicator Title | % of short journeys (under 2/5km) made via walking or cycling |
|---|---|
| Description | Proportion of short journeys (under 2km or 5km, depending on survey definition) made by walking or cycling in Scotland, reflecting modal shift away from car use for shorter trips. |
| Data Source | Transport and Travel in Scotland (Scottish Household Survey), |
| Expected trend | Assessed on a directional basis, with success understood as an increasing proportion of short journeys being made by walking or cycling. |
| Unit | Percentage (%) of short journeys. |
| Limitations and data development | Based on survey data and therefore subject to sampling variability and confidence intervals. Small year-on-year changes may not be statistically significant. The indicator captures only short journeys and does not reflect total car kilometres or longer-distance travel, which account for a larger share of transport emissions. It measures self-reported behaviour, which may be subject to recall bias. The relationship with emissions outcomes is indirect and dependent on substitution away from car use. |
| Criterion | Assessment | Rationale |
|---|---|---|
| Relevance | Moderate | Modal shift away from car use reduces emissions; however, short journeys represent only part of total car kilometres and associated emissions. |
| Representativeness | Low –Moderate | Reflects behavioural change for short trips only and does not capture overall car demand, freight, or fleet decarbonisation. |
| Data availability | High | Published annually through Transport and Travel in Scotland. |
| Sensitivity to change | Moderate | Survey-based measure; meaningful changes detectable over time but small annual changes may fall within confidence intervals. |
| Interpretability | High | Direction of success (increase in active travel share) is clear and easily communicated. |
| Practicality | High | Uses established survey data; no additional collection required. |
TRANSPORT 4 – Access to a bicycle
| Indicator Title | Percentage of households with access to a bike |
|---|---|
| Description | Proportion of households in Scotland reporting access to one or more bicycles, indicating the potential capacity for active travel. |
| Data Source | Transport and Travel in Scotland (Scottish Household Survey), published annually. |
| Expected trend | Assessed on a directional basis, with success understood as an increasing proportion of households having access to a bicycle, supporting conditions for modal shift to active travel. |
| Unit | Percentage (%) of households. |
| Limitations and data development | Based on survey data and therefore subject to sampling variability and confidence intervals. The indicator measures access rather than actual use, and does not capture frequency of cycling or substitution away from car travel. Increases in access do not necessarily translate into emissions reductions. The relationship with transport emissions is indirect and dependent on behavioural change. Small year-on-year movements may not be statistically significant. |
| Criterion | Assessment | Rationale |
|---|---|---|
| Relevance | Low –Moderate | Access to a bicycle may enable modal shift, but the link to emissions reduction is indirect and dependent on behavioural change. |
| Representativeness | Low | Captures one enabling condition only and does not reflect actual travel behaviour, car demand, or fleet decarbonisation. |
| Data availability | High | Published annually via Transport and Travel in Scotland. |
| Sensitivity to change | Moderate | Survey-based; broad trends detectable, but small annual changes may fall within confidence intervals. |
| Interpretability | High | Easily understood measure with clear direction of travel. |
| Practicality | High | Uses established survey data; no additional collection required. |
TRANSPORT 5 – Mode of travel for longer journeys
| Indicator Title | % of longer journeys (over 5km) made via bus or rail |
|---|---|
| Description | Proportion of journeys over 5km in Scotland made by bus or rail, indicating modal shift towards lower-emission public transport for longer-distance travel. |
| Data Source | Transport and Travel in Scotland (Scottish Household Survey), published annually. |
| Expected trend | Assessed on a directional basis, with success understood as an increasing proportion of longer journeys being made by bus or rail, consistent with reducing car dependency and supporting the transport emissions pathway. |
| Unit | Percentage (%) of journeys over 5km. |
| Limitations and data development | Based on survey data and therefore subject to sampling variability and confidence intervals. Small year-on-year changes may not be statistically significant. The indicator reflects modal share but does not directly measure total vehicle kilometres, occupancy rates, service frequency, or the emissions intensity of buses and trains. The emissions impact depends on substitution away from private car travel and the decarbonisation of public transport fleets. |
| Criterion | Assessment | Rationale |
|---|---|---|
| Relevance | Moderate –High | Modal shift from car to bus or rail for longer journeys can materially reduce emissions, particularly where substitution is direct. |
| Representativeness | Moderate | Captures behavioural change for longer-distance trips but does not reflect total car demand, freight transport, or fleet electrification. |
| Data availability | High | Published annually via Transport and Travel in Scotland. |
| Sensitivity to change | Moderate | Survey-based measure; broader trends detectable, but small changes may fall within confidence intervals. |
| Interpretability | High | Clear directional interpretation - increasing public transport share is understood as positive. |
| Practicality | High | Uses established survey infrastructure; no additional data collection required. |
TRANSPORT 6 - Zero Emission Vehicle (ZEV) van registration
| Indicator Title | % of new van registrations that are Zero Emission Vehicles |
|---|---|
| Description | Proportion of newly registered light goods vehicles (vans) in Scotland each year that are zero emission vehicles, indicating progress in decarbonising the LGV fleet. |
| Data Source | Department for Transport (DfT) and Driver and Vehicle Licencing Agency (DVLA). |
| Expected trend | Assessed against the expected uptake trajectory consistent with the LGV emissions pathway, with success reflected in increasing uptake of zero emission vans over time. |
| Unit | Percentage (%) of new van registrations. |
| Limitations and data development | The indicator captures new registrations only and does not reflect the emissions performance of the existing van fleet, which may remain in service for extended periods. Emissions reductions materialise gradually through fleet turnover. The measure does not capture changes in total van kilometres travelled, or operational efficiency. Year-on-year fluctuations may reflect market conditions, supply chain constraints, or fiscal incentives rather than sustained structural change. While based on comprehensive administrative data, further development could include monitoring of total fleet composition and van kilometres to strengthen linkage to emissions outcomes. |
| Criterion | Assessment | Rationale |
|---|---|---|
| Relevance | High | Fleet electrification is a primary mechanism for reducing LGV tailpipe emissions over time. |
| Representativeness | Moderate | Reflects new fleet turnover but does not capture total van kilometres or the existing fleet stock. |
| Data availability | High | Based on comprehensive DVLA administrative data, published annually by DfT. |
| Sensitivity to change | High | Full population administrative dataset; capable of detecting small year-on-year changes. |
| Interpretability | High | Clear directional interpretation - increasing ZEV share represents progress. |
| Practicality | High | Based on established administrative data; no additional data collection required. |
TRANSPORT 7 - Zero Emission Vehicle (ZEV) bus registration
| Indicator Title | % of new bus registrations that are Zero Emission Vehicles |
|---|---|
| Description | Proportion of newly registered buses in Scotland each year that are zero emission vehicles, indicating progress in decarbonising the bus fleet. |
| Data Source | Department for Transport (DfT) and Driver and Vehicle Licensing Agency (DVLA). |
| Expected trend | Assessed against the expected uptake trajectory consistent with the bus emissions pathway, with success reflected in increasing uptake of zero emission buses over time. |
| Unit | Percentage (%) of new bus registrations. |
| Limitations and data development | The indicator reflects new registrations only and does not capture the emissions performance of the existing bus fleet. Emissions reductions materialise gradually as fleet turnover occurs. The indicator does not represent total distance travelled by fuel type, and year-on-year movements may be volatile due to the relatively small absolute number of ZEV bus registrations. |
| Criterion | Assessment | Rationale |
|---|---|---|
| Relevance | High | Transition to zero‑emission vehicles is a primary mechanism for reducing bus tailpipe emissions over time. |
| Representativeness | Moderate | Reflects new fleet turnover but does not capture total kilometres travelled or the emissions performance of the existing fleet. |
| Data availability | High | Based on comprehensive DVLA administrative data, published annually by DfT. |
| Sensitivity to change | High | Full population administrative dataset capable of detecting small year on year changes. |
| Interpretability | High | Direction of success (increase in ZEV share) is clear and easily interpreted. |
| Practicality | High | Uses established administrative data; no additional data collection is required. |
TRANSPORT 8 - Zero Emission Vehicle (ZEV) HGV registration
| Indicator Title | % of new HGV registrations that are Zero Emission Vehicles |
|---|---|
| Description | Proportion of newly registered heavy goods vehicles (HGVs) in Scotland each year that are zero emission vehicles, indicating progress in decarbonising the HGV fleet. |
| Data Source | Department for Transport (DfT) and Driver and Vehicle Licencing Agency (DVLA |
| Expected trend | Assessed against the expected uptake trajectory consistent with the HGV emissions pathway, with success reflected in increasing uptake of zero emission HGVs over time. |
| Unit | Percentage (%) of new HGV registrations. |
| Limitations and data development | The indicator reflects new registrations only and does not capture the emissions performance of the existing HGV fleet, which typically has long asset lifetimes. Emissions reductions materialise gradually as fleet turnover occurs. Current uptake of zero emission HGVs is low and may be influenced by technological availability, infrastructure readiness, and commercial viability. The indicator does not reflect total freight demand, vehicle kilometres travelled, load factors, or operational efficiency. Year-on-year movements may be volatile due to small absolute numbers of ZEV registrations |
| Criterion | Assessment | Rationale |
|---|---|---|
| Relevance | High | Transition to zero emission vehicles is a primary mechanism for reducing HGV tailpipe emissions over time. |
| Representativeness | Moderate | Reflects new fleet turnover but does not capture total freight demand, total kilometres, or the emissions performance of the existing fleet. |
| Data availability | High | Based on comprehensive DVLA administrative data, published annually by DfT. |
| Sensitivity to change | Moderate | Full population dataset; however, low uptake and small absolute numbers may result in volatile percentage movements year-on-year. |
| Interpretability | High | Direction of success (increase in ZEV share) is clear and easily interpreted. |
| Practicality | High | Uses established administrative data; no additional data collection required. |
Business and Industrial Processes
BUSINESS & INDUSTRIAL PROCESSES 1 - ETS Traded Sector Emissions
| Indicator Title | Emissions from industry ETS traded sector (industrial sites only) |
|---|---|
| Description | Total verified greenhouse gas emissions from industrial installations in Scotland covered by the UK Emissions Trading Scheme (UK ETS). This includes emissions from energy-intensive industrial sites subject to carbon pricing regulation and does not include emissions from non-ETS (non-traded) industrial sources. |
| Data Source | UK Emissions Trading Scheme (UK ETS) registry data, published annually by the UK ETS Authority, covering the previous calendar year. |
| Expected trend | Assessed against the expected reduction trajectory for industrial ETS emissions, including a 24% reduction between 2026-2030, consistent with the industry emissions pathway. |
| Unit | Million tonnes of carbon dioxide equivalent (MtCO2e). |
| Limitations and data development | The indicator covers only installations participating in the UK ETS and therefore does not represent total emissions from the industry sector in Scotland. Emissions from non-traded industrial sources are excluded. However, the vast majority of emissions reductions are expected to occur in the traded sector. Changes in emissions may reflect variations in production output, energy prices, or structural economic change, as well as decarbonisation activity. Changes to ETS scope or installation coverage could affect comparability over time. Data are published annually and verified retrospectively, resulting in a reporting lag. |
| Criterion | Assessment | Rationale |
|---|---|---|
| Relevance | High | Direct measure of greenhouse gas emissions from a major industrial sub-sector; directly aligned with the emissions pathway. |
| Representativeness | High | Covers the majority of emissions from energy-intensive industrial installations in Scotland under carbon pricing regulation. |
| Data availability | High | Verified administrative emissions data published annually through the UK ETS framework. |
| Sensitivity to change | High | Based on verified installation-level emissions reporting; capable of detecting relatively small changes in emissions levels year-on-year. |
| Interpretability | High | Direct emissions measure (MtCO2e); direction of success (reduction) is clear. |
| Practicality | High | Uses established regulatory reporting; no additional data collection required. |
Energy Supply
ENERGY SUPPLY 1 - Grid Intensity
| Indicator Title | Electricity grid intensity (CO2e per kWh) |
|---|---|
| Description | Average greenhouse gas emissions per unit of electricity generated in Scotland, expressed as grams of CO2 equivalent per kilowatt hour. This reflects the carbon intensity of the electricity system and progress in decarbonising power generation. |
| Data Source | Department for Energy Security and Net Zero (DESNZ) and Scottish Greenhouse Gas Inventory statistics. Published annually. |
| Expected trend | Assessed against the objective of maintaining electricity grid intensity below 40 gCO2e per kilowatt hour. |
| Unit | Grams of CO2 equivalent per kilowatt hour (gCO2e/kWh). |
| Limitations and data development | The indicator reflects territorial electricity generation emissions and does not account for imported electricity or lifecycle emissions associated with infrastructure and fuel production. Annual values may fluctuate due to weather conditions, generation mix variability, plant outages, or interconnector flows. While highly representative of power sector decarbonisation, the measure does not directly capture security of supply, system flexibility, or network constraints. Data is published annually with a reporting lag consistent with the GHG Inventory timetable. |
| Criterion | Assessment | Rationale |
|---|---|---|
| Relevance | High | Direct measure of emissions intensity of electricity generation; central to power sector decarbonisation. |
| Representativeness | High | Captures overall generation mix and reflects structural changes in the electricity system. |
| Data availability | Moderate | Published annually by DESNZ. Though requires reconciliation with GHG statistics which are reported with a two year lag |
| Sensitivity to change | High | Based on verified generation and emissions data; capable of detecting meaningful year-on-year changes. |
| Interpretability | High | Clear metric with unambiguous direction of success (lower intensity). |
| Practicality | High | Uses established Accredited Official Statistics; no additional data collection required. |
ENERGY SUPPLY 2 - installed capacity of renewables
| Indicator Title | Installed capacity of renewable generation (GW) |
|---|---|
| Description | Total installed renewable electricity generation capacity in Scotland, measured in gigawatts (GW). This reflects the scale of renewable infrastructure deployed and the potential for low-carbon electricity generation. |
| Data Source | Department for Energy Security and Net Zero (DESNZ) Energy Trends Electricity generation and supply data. Published quarterly. |
| Expected trend | Evaluated on a year-to-year change basis, with success understood as increasing installed renewable generation capacity consistent with decarbonisation of the electricity system. |
| Unit | Gigawatts (GW) of installed renewable generation capacity. |
| Limitations and data development | Installed capacity reflects potential generation rather than actual output and does not account for variability in renewable generation due to weather conditions. The indicator does not directly measure emissions reductions or electricity grid intensity. Deployment may be affected by planning timelines, grid constraints, supply chain factors, or policy changes. |
| Criterion | Assessment | Rationale |
|---|---|---|
| Relevance | Moderate –High | Expansion of renewable capacity supports decarbonisation of electricity generation and reductions in grid intensity, though capacity alone does not determine emissions. |
| Representativeness | Moderate | Captures a key structural driver of power sector decarbonisation but does not directly reflect dispatch, generation output, fossil backup use, or system integration. |
| Data availability | High | Data published quarterly |
| Sensitivity to change | High | Capacity additions are discrete and measurable; year-on-year increases are clearly observable. |
| Interpretability | High | Direction of success (increase in renewable capacity) is clear and easily understood. |
| Practicality | High | Uses established administrative dataset; no additional data collection required. |
ENERGY SUPPLY 3 - Renewable capacity at planning stages
| Indicator Title | Renewable capacity at planning stages (GW, 3 categories) |
|---|---|
| Description | Total renewable electricity generation capacity in Scotland at different stages of the planning and development process (e.g. in planning, consented, under construction), measured in gigawatts (GW). This reflects the future pipeline of renewable deployment. |
| Data Source | Department for Energy Security and Net Zero (DESNZ) Renewable Energy Planning Database. Published quarterly. |
| Expected trend | Evaluated on a year-to-year change basis, with success understood as maintaining or increasing the volume of renewable capacity progressing through planning and development stages, consistent with future decarbonisation of the electricity system. |
| Unit | Gigawatts (GW) of renewable generation capacity. |
| Limitations and data development | Capacity at planning stages represents potential future generation and does not guarantee project delivery. Projects may be delayed, amended, or cancelled due to financing, grid connection constraints, planning decisions, or market conditions. The indicator does not directly measure emissions reductions or actual generation output. |
| Criterion | Assessment | Rationale |
|---|---|---|
| Relevance | Moderate | Expansion of the renewable pipeline supports future decarbonisation of electricity generation, though it does not directly reduce emissions. |
| Representativeness | Moderate | Reflects the scale of planned system transformation but does not capture generation output, fossil backup, or system integration factors. |
| Data availability | High | Based on administrative planning data, published annually |
| Sensitivity to change | High | Changes in pipeline capacity are discrete and measurable; year-on-year movements are clearly observable. |
| Interpretability | Moderate | Conceptually clear, but interpretation requires understanding that pipeline capacity does not equate to operational generation. |
| Practicality | High | Uses established administrative dataset; no additional data collection required. |
ENERGY SUPPLY 4 - Loss of load expectation
| Indicator Title | Loss of Load Expectation (hours per year) |
|---|---|
| Description | The expected number of hours per year in which electricity demand is forecast to exceed available generation capacity across Great Britain. This indicator reflects system adequacy and security of supply during the transition to a low-carbon electricity system. |
| Data Source | National Energy System Operator (NESO), Winter Outlook Report. Published annually. |
| Expected trend | Assessed against the reliability standard for Great Britain, with success reflected in maintaining Loss of Load Expectation below 3 hours per year. |
| Unit | Hours per year. |
| Limitations and data development | The indicator reflects a modelled expectation rather than observed outages. It applies at a Great Britain level rather than Scotland-specific system adequacy. It does not measure emissions or renewable deployment directly but provides context on the reliability of the electricity system. |
| Criterion | Assessment | Rationale |
|---|---|---|
| Relevance | Low –Moderate | Does not directly measure emissions; indirectly relevant as maintaining security of supply supports sustainable decarbonisation of the electricity system. |
| Representativeness | Moderate | Reflects overall system adequacy across Great Britain but not Scotland-specific emissions or generation mix. |
| Data availability | High | Published annually by NESO in the Winter Outlook Report; accessible and regularly updated. |
| Sensitivity to change | Moderate | Based on modelling assumptions; meaningful changes detectable, but year-on-year movements may reflect scenario updates rather than structural change. |
| Interpretability | Moderate | Concept requires explanation; interpretation depends on understanding the reliability standard (3-hour threshold). |
| Practicality | High | Uses established modelling and reporting processes; no additional data collection required. |
ENERGY SUPPLY 5 - household waste incinerated
| Indicator Title | Household waste incinerated |
|---|---|
| Description | The amount of Scottish household waste incinerated, expressed in tonnes. |
| Data Source | SEPA annual statistics on household waste generated and managed. |
| Expected trend | Assessed against forecast household waste incineration rates, which has been used to provide an estimate of future energy from waste emissions in the CCP. Household waste incinerated is projected to increase until 2028 (when SEPA will commence full enforcement of the biodegradable municipal waste landfill ban) and then gradually reduce from 2028 onwards. |
| Unit | Tonnes of incinerated waste. |
| Limitations and data development | The indicator captures household waste incinerated only and does not account for waste composition change or commercial/industrial waste, which could mask any changes in emissions. Future development could look to take into account the different types of household waste incinerated and their impact on emissions. |
| Criterion | Assessment | Rationale |
|---|---|---|
| Relevance | Moderate | Linked to Energy from Waste (EfW) emissions; higher tonnage of household waste incinerated generally associates with increases to the greenhouse gases released associated with EfW |
| Representativeness | Moderate | Reflects a significant portion of waste being incinerated but excludes commercial/industrial waste, so only partially represents sources of EfW emissions. |
| Data availability | High | Published annually by SEPA. |
| Sensitivity to change | Moderate | Sensitive to changes in tonnes of household waste incinerated, but less able to detect shifts from waste composition, efficiency or changes to the amount of commercial/industrial waste incinerated. |
| Interpretability | Moderate |
Interpretation requires some understanding because, as a result of the biodegradable municipal waste landfill ban, an increase in household waste incinerated is expected in the short term. Direction of success would be lower incineration from 2028 levels in the long term. |
| Practicality | High | Uses established administrative dataset; no additional data collection required. |
Land Use, Land Use Change and Forestry (LULUCF)
LULUCF 1 - woodland creation
| Indicator Title | Hectares of woodland created |
|---|---|
| Description | Total area of new woodland created in Scotland each year, measured in hectares. This reflects progress in expanding forest cover and increasing long-term carbon sequestration consistent with the LULUCF emissions pathway. |
| Data Source | Forestry Statistics (published by Scottish Forestry). Published annually. |
| Expected trend | Assessed against the target of planting approximately 78,000 hectares of new woodland between 2026–2030, consistent with the LULUCF emissions pathway. |
| Unit | Hectares (ha) of new woodland created per year. |
| Limitations and data development | Woodland creation reflects area planted rather than immediate carbon sequestration, as sequestration benefits accrue over time as forests mature. The indicator does not capture woodland quality, species mix, permanence, or management practices, all of which influence long-term carbon outcomes. Delivery may be affected by land availability, supply chain capacity, weather conditions, and funding constraints. While data are robust and administratively recorded, annual planting levels may fluctuate due to project timing. |
| Criterion | Assessment | Rationale |
|---|---|---|
| Relevance | High | Woodland creation increases long-term carbon sequestration and is central to achieving LULUCF emissions removals. |
| Representativeness | High | Directly reflects a primary driver of emissions removals within the LULUCF pathway. |
| Data availability | High | Published annually through official forestry statistics based on administrative records. |
| Sensitivity to change | High | Area planted is directly measured; annual changes clearly observable. |
| Interpretability | High | Clear directional interpretation — higher planting consistent with pathway delivery. |
| Practicality | High | Based on established administrative reporting; no additional data collection required. |
LULUCF 2 - Peatland restoration
| Indicator Title | Hectares of peatland restored |
|---|---|
| Description | Total area of degraded peatland restored in Scotland each year, measured in hectares. This reflects progress in reducing emissions from degraded peatlands and enhancing long-term carbon storage, consistent with the LULUCF emissions pathway. |
| Data Source | Peatland ACTION data produced by NatureScot. Published annually. |
| Expected trend | Assessed progress toward restoring 400,000 hectares of peatland by 2040, in line with the LULUCF emissions pathway. |
| Unit | Hectares (ha) of peatland restored per year. |
| Limitations and data development |
Restoration area reflects activity undertaken rather than immediate emissions reductions, which depend on site condition, hydrology, and restoration effectiveness. Emissions benefits may take time to materialise and vary across sites. The indicator does not capture long-term maintenance, condition monitoring, or potential re-degradation. Delivery may be influenced by weather, contractor capacity, land access, and funding. Data are based on administrative reporting and are subject to annual publication cycles. This data only captures restoration undertaken via Peatland ACTION. While this represents the majority of restoration in Scotland, other restoration efforts take place, whether through alternative grant schemes or privately funded means. Recent evidence suggests that the area of grassland on peat in Scotland has been significantly overestimated in the UK GHG Inventory. Improved mapping is underway which may result in a baseline revision if any future plan if formally ratified by the GHG Inventory. |
| Criterion | Assessment | Rationale |
|---|---|---|
| Relevance | High | Restoration reduces emissions from degraded peatlands and contributes directly to LULUCF emissions reductions. |
| Representativeness | High | Directly reflects a primary driver of emissions reduction within the peatland sub-sector. |
| Data availability | High | Published annually via NatureScot administrative reporting. |
| Sensitivity to change | High | Restoration area is directly measured; year-on-year changes clearly observable. |
| Interpretability | High | Clear directional interpretation - increased restoration consistent with pathway delivery. |
| Practicality | High | Based on established programme reporting; no additional data collection required. |
Buildings (Residential and Public)
BUILDINGS 1 - LZDEH conversions
| Indicator Title | Number of buildings using low and zero direct emissions heating (LZDEH) systems |
|---|---|
| Description | Total number of buildings in Scotland using low and zero direct emissions heating systems (e.g. heat pumps, direct electric heating), reflecting progress in decarbonising heating. |
| Data Source | Scottish House Condition Survey (SHCS), Accredited Official Statistics. Published annually (domestic properties). Non-Domestic Analytics (NDA), dataset maintained by Energy Savings Trust (EST), updated annually (non-domestic properties). |
| Expected trend | Assessed against the target of 35,000 additional building conversions to LZDEH systems over 2026-2030, consistent with the Buildings emissions pathway. |
| Unit | Number of buildings. |
| Limitations and data development |
SCHS estimates are derived from survey data and therefore subject to sampling variability and confidence intervals. Small year-on-year changes may not be statistically distinguishable. The indicator measures heating system type but does not capture actual energy consumption, system efficiency, hybrid systems, or user behaviour. Emissions reductions depend on electricity grid decarbonisation and building fabric performance. Data are published annually but reflect survey-based estimation rather than full administrative coverage. NDA data is maintained by EST and is newer, experimental data which is subject to revision. It uses EPC register data and other sources of data to track the heating system of non-domestic buildings. Modelling is used to fill gaps due to a lack of coverage in key datasets such as the non-domestic EPC register. The dataset is updated annually and is not publicly available. |
| Criterion | Assessment | Rationale |
|---|---|---|
| Relevance | High | Decarbonisation of buildings’ heating systems is a primary driver of emissions reductions within the Buildings sector. |
| Representativeness | High | Directly reflects the primary driver of emissions reduction within the buildings pathway |
| Data availability | Moderate | Domestic data based on Accredited Official Statistics and published annually (Non-domestic data, representing a small share of total buildings, updated annually and not published). Survey-based methodology and sample size constrain timeliness and precision for small changes. |
| Sensitivity to change | Moderate | Broad trends detectable over time, but small annual increases may fall within confidence intervals. |
| Interpretability | High | Direction of success (increase in LZDEH uptake) is clear and easily understood. |
| Practicality | High | Uses established survey infrastructure; no additional data collection required. |
BUILDINGS 2 - EPC C attainment
| Indicator Title | Number of homes with EPC C or above (or equivalent) |
|---|---|
| Description | Total number of domestic properties in Scotland with an Energy Performance Certificate (EPC) rating of C or above (or equivalent), reflecting improvements in energy efficiency and building fabric performance. |
| Data Source | Scottish House Condition Survey (SHCS), Accredited Official Statistics. Published annually. |
| Expected trend | Assessed against the target of 135,000 additional domestic properties achieving EPC C+ (or equivalent) over 2026-2030, consistent with the Buildings emissions pathway. |
| Unit | Number of domestic properties. |
| Limitations and data development | Estimates are derived from survey data and therefore subject to sampling variability and confidence intervals. Small year-on-year changes may not be statistically distinguishable. The indicator reflects theoretical modelled energy performance rather than actual energy consumption or occupant behaviour. EPC ratings may not fully capture building condition, heating system efficiency, or retrofit quality. Data are published annually but are survey-based rather than comprehensive administrative records. |
| Criterion | Assessment | Rationale |
|---|---|---|
| Relevance | Moderate | Improving building fabric efficiency reduces energy demand and is a core driver of emissions reduction in the residential sector. However, the role building fabric efficiency plays is mostly in making clean heat technologies competitive and therefore incentivising the replacement of gas boilers. |
| Representativeness | Moderate | Reflects an important driver of emissions reduction in the residential sector but does not capture heating system transition or behavioural factors that also determine overall emissions performance. |
| Data availability | Moderate | Based on Accredited Official Statistics and published annually; however, survey-based methodology and sample size limit timeliness and precision for small changes. |
| Sensitivity to change | Moderate | Broad trends detectable over time, but small annual improvements may fall within confidence intervals. |
| Interpretability | High | Clear directional interpretation — increasing number of EPC C+ (or equivalent) homes represents progress. |
| Practicality | High | Uses established survey infrastructure; no additional data collection required. |
Waste Management
WASTE MANAGEMENT 1 - Biodegradable municipal waste landfilled
| Indicator Title | Tonnage of biodegradable municipal waste (BMW) landfilled |
|---|---|
| Description | Total tonnage of biodegradable municipal waste (including household and similar residual waste) sent to landfill in Scotland each year. This reflects progress towards eliminating landfill disposal of biodegradable waste and reducing methane emissions from the waste sector. |
| Data Source | Scottish Environment Protection Agency (SEPA), Waste landfilled in Scotland statistics. Published annually. |
| Expected trend | Assessed against the projected reduction of biodegradable municipal waste sent to landfill to zero by 2028, consistent with statutory landfill restrictions and the waste emissions pathway. |
| Unit | Tonnes of biodegradable municipal waste landfilled per year. |
| Limitations and data development | Data are derived from regulatory reporting by waste operators and are subject to annual publication cycles. The indicator captures landfill disposal, the main source of greenhouse gas generation in the Waste Management sector, but does not cover landfill gas capture, which acts to reduce landfill emissions. |
| Criterion | Assessment | Rationale |
|---|---|---|
| Relevance | High | Landfilled biodegradable waste generates methane, a potent greenhouse gas; reducing landfill volumes directly reduces emissions. |
| Representativeness | High | Captures the principal source of waste-sector methane emissions targeted by policy. |
| Data availability | Moderate –High | Based on regulatory reporting and published annually by SEPA; subject to annual publication lag (typically 10 months after reporting year) but comprehensive in coverage. |
| Sensitivity to change | High | Based on reported tonnage data; capable of detecting small changes in landfill volumes. |
| Interpretability | High | Direction of success (reduction towards zero) is clear and aligned with a defined policy endpoint. |
| Practicality | High | Uses established regulatory reporting; no additional data collection required. |
WASTE MANAGEMENT 2 - Waste tonnage generated
| Indicator Title | Waste tonnage generated (excluding soils and mineral waste from construction & demolition) |
|---|---|
| Description | Total tonnage of waste generated in Scotland each year, excluding soils and mineral waste from construction and demolition activities. This reflects progress in reducing overall waste generation consistent with circular economy and emissions reduction objectives. |
| Data Source | Scottish Environment Protection Agency (SEPA), Waste from all sources. Published annually. |
| Expected trend | Assessed on a downward trend basis, with success understood as a sustained reduction in total waste generated over time. |
| Unit | Tonnes of waste generated per year. |
| Limitations and data development | Excludes soils and mineral waste from construction and demolition, which represent a significant proportion of total waste by tonnage; therefore, it does not capture the full waste system. It excludes these soil and mineral wastes because they are generally landfilled with low emissions, but show significant year-to-year variation which can obscure the overall trend. Other than this, the measure does not differentiate by waste type, carbon impact, or treatment route. Emissions outcomes depend on how waste is managed (e.g. recycled, incinerated, landfilled). Data are based on regulatory reporting and subject to annual publication lag. Economic conditions and population changes may influence total waste generation independent of policy effectiveness. |
| Criterion | Assessment | Rationale |
|---|---|---|
| Relevance | Low - Moderate | The indicator gives an overall picture regarding progress towards waste reduction rather than a direct link to emissions. |
| Representativeness | High | Covers all sectors (household; commercial & industrial; construction & demolition) although it excludes soil and mineral waste from construction & demolition for the reasons given above. |
| Data availability | Moderate - High | Based on regulatory reporting and published annually by SEPA; subject to annual publication lag – typically 15 months after reporting year. |
| Sensitivity to change | High | Based on reported tonnage data; capable of detecting year-on-year changes. |
| Interpretability | High | Direction of success (reduction in total waste generated) is clear. |
| Practicality | High | Uses established regulatory reporting; no additional data collection required. |
Agriculture
AGRICULTURE 1 - Engagement with farm advisory service
| Indicator Title | Engagement with Farm Advisory Services on environmental issues and climate change |
|---|---|
| Description | Increased engagement with Farm Advisory Services to ensure more farmers, crofters, land managers and other primary food producers are aware of the benefits and practicalities of cost effective climate mitigation measures. |
| Data Source | Farm Advisory Service annual and lifetime reports. |
| Expected trend | Progress towards maintaining and increasing higher levels of engagement over time. |
| Unit | Percentage change year on year. |
| Limitations and data development | Indicator captures engagement with a specific advisory programme and hence is a partial indicator of wider knowledge and skills amongst farmers and crofters. |
| Criterion | Assessment | Rationale |
|---|---|---|
| Relevance | High | Engagement with advisory services is a driver of climate change related skill and knowledge transfer. |
| Representativeness | Moderate | Captures engagement with the service, but does not necessarily capture wider skills and knowledge across farmers, crofters, land managers and other primary food producers. |
| Data availability | High | Monitoring data are updated annually. Farm Advisory Service (FAS) data are published in FAS annual reports. This published source data can be broken-down to align with the CCP reporting period. |
| Sensitivity to change | Moderate | Broad trends detectable; however, smaller year-on-year changes may reflect survey variability or weather-related fluctuations. |
| Interpretability | High | Simple percentage measure with trend to help evaluate direction of travel. |
| Practicality | High | No additional cost or resource requirements – monitoring and evaluation is built into the contracting for the Farm Advisory Service. |
AGRICULTURE 2 - Use of nitrogen fertilisers
| Indicator Title | Use of nitrogen fertilisers |
|---|---|
| Description | Quantities of nitrogen fertilisers used in Scotland. |
| Data Source | British Survey of Fertiliser Practice(BSFP). Published annually. |
| Expected trend | Assessed on a downward trend basis, with success understood as a sustained reduction in nitrogen fertiliser use. |
| Unit | Kilotonnes of nitrogen (kt N) applied per year. |
| Limitations and data development | Published annually as accredited official statistics, based on survey data. |
| Criterion | Assessment | Rationale |
|---|---|---|
| Relevance | High | Falling nitrogen usage is a key policy outcome. |
| Representativeness | High | Quantities of nitrogen fertiliser used is a driver of nitrogen usage in agriculture. |
| Data availability | High |
Based on annual survey data; published annually as accredited official statistics. Subject to survey-based limitations and reporting lag – data for crop years are published with around a one year lag. For example, data for crop year 2023-24 (fertiliser consumption period July to June) were published in July 2025. |
| Sensitivity to change | Moderate | Broad trends detectable; however, smaller year-on-year changes may reflect survey variability or weather-related fluctuations. |
| Interpretability | High | Simple percentage measure with trend to help evaluate direction of travel. |
| Practicality | High | Based on existing published data tables, minimal additional resource required. |
AGRICULTURE 3 - Application rates of nitrogen fertilisers
| Indicator Title | Overall nitrogen application rates (kg/ha) |
|---|---|
| Description | Total overall application rates of nitrogen fertiliser per hectare of agricultural land in Scotland. |
| Data Source | British Survey of Fertiliser Practice (BSFP). Published annually. |
| Expected trend | Progress towards reducing average application rates over time. |
| Unit | Kilograms of nitrogen per hectare (kg/ha). |
| Limitations and data development | Published annually as accredited official statistics, based on survey data. |
| Criterion | Assessment | Rationale |
|---|---|---|
| Relevance | High | Falling application rates of Nitrogen usage related directly to key policy outcomes. |
| Representativeness | High |
Precision application of fertilisers can help to reduce greenhouse gas emissions. The overall application rate is a measure of the fertiliser nutrient application rate over the sown area (the area of a field that has been planted with a crop or grass) of all fields, irrespective of whether they received dressing of that nutrient or not. Excludes headlands, field margins, buffer strips and other agri-environment features. |
| Data availability | High |
Based on annual survey data; published annually as accredited official statistics. Subject to survey-based limitations and reporting lag – data for calendar years are published the following summer. For example, data for 2024 were published in July 2025. |
| Sensitivity to change | Moderate | Broad trends detectable; however, smaller year-on-year changes may reflect survey variability or weather-related fluctuations. |
| Interpretability | High | Simple percentage measure with trend to help evaluate direction of travel. |
| Practicality | High | Based on existing published data tables, minimal additional resource required. |
AGRICULTURE 4 - Average age at slaughter
| Indicator Title | Average age at slaughter of prime animal |
|---|---|
| Description | Average age of prime animal at slaughter, reflecting livestock production efficiency in Scotland and its relationship to greenhouse gas emissions intensity per unit of output. |
| Data Source | Administrative cattle traceability data, analysed by Scotland’s Rural College (SRUC). |
| Expected trend | Assessed on a downward trend basis, with success understood as a reduction in average slaughter age, consistent with improved production efficiency and lower emissions intensity. |
| Unit | Average age at slaughter (months). |
| Limitations and data development | The indicator measures slaughter age as a proxy for emissions intensity and does not directly measure methane or nitrous oxide emissions. Emissions outcomes depend on feed type, herd management, animal health, and productivity, which are not captured directly. Changes in slaughter age may reflect market conditions, breed characteristics, or production systems rather than structural emissions mitigation alone. The indicator applies to cattle and does not represent emissions from other livestock sectors. |
| Criterion | Assessment | Rationale |
|---|---|---|
| Relevance | Moderate | Slaughter age affects lifetime methane emissions per animal and emissions intensity, but is an indirect proxy rather than a direct emissions measure. |
| Representativeness | Moderate |
Reflects production efficiency in cattle only and does not capture total livestock numbers, herd composition, or emissions from other agricultural sources. The animals need not have been slaughtered in Scotland. |
| Data availability | Moderate |
Based on comprehensive administrative cattle tracing data analysed annually by Scotland’s Rural College (SRUC). Data not currently published regularly other than in existing Climate Change Plan monitoring reports. Would expect this to continue as a minimum, and to explore options for publishing separately. |
| Sensitivity to change | High | Administrative dataset allows detection of small changes in average slaughter age year-on-year. |
| Interpretability | Moderate | Concept requires explanation; shorter slaughter age is assumed to reduce emissions intensity but is not inherently intuitive to non-specialist audiences. |
| Practicality | Moderate-High |
Commissioned annually from Scotland’s Rural College (SRUC). Uses existing administrative data; no additional data collection required. |
AGRICULTURE 5 - Woodland area on agricultural land
| Indicator Title | Woodland area on agricultural land |
|---|---|
| Description | Estimated area of woodland on agricultural land in Scotland. |
| Data Source | National Forest Inventory (NFI) intersected with agricultural land, Scottish Government analysis. |
| Expected trend | Progress towards maintaining and increasing area of woodland. |
| Unit | Hectares (thousands). |
| Limitations and data development |
NFI is a land-use dataset, and its definition of woodland excludes areas under 0.5 hectares. Definition of measure used as indicator must make clear: • which areas marked as woodland in the NFI are included/excluded, for example felled areas • scope of ‘agricultural land’. Expect to publish analysis, including definitions used, and will continue to review data source to ensure that it remains the most suitable. |
| Criterion | Assessment | Rationale |
|---|---|---|
| Relevance | High | Planting and managing trees on agricultural land can capture carbon. Key policy outcome to support farmers and crofters to plant more trees on their land in a way that works for their business. |
| Representativeness | Moderate |
Reflects areas of woodland, but will not represent trees outside woodlands (areas under 0.5 hectares) This is a land-use dataset, and measure will need to define what areas are included/excluded, for example: felled areas of woodland; what areas are in scope for agricultural land. |
| Data availability | High | Based on analysis of published National Forest Inventory (NFI) data. Analysis will be published and source will continue to be reviewed to ensure the most suitable data are used. |
| Sensitivity to change | High | National Forest Inventory is updated annually based on earth observation. Around 20% is ground-validated annually on a rolling basis. |
| Interpretability | High | Expect published measure to be tailored for a non-technical audience, alongside information on representativeness. |
| Practicality | Moderate-High | While developing and publishing this measure will have value for a range of stakeholders, analytical resource is needed to produce and quality assure a robust measure. |
Just Transition
JUST TRANSITION 1 - Participation in Decision-Making
| Indicator Title | Percentage of people satisfied with participation in net zero decision making |
|---|---|
| Description | Proportion of people in Scotland reporting satisfaction with opportunities to influence (i) the Scottish Government’s approach to delivering net zero, and (ii) local policy and planning decisions relating to net zero. |
| Data Source | Scottish Climate Survey. |
| Expected trend | Increasing over time. |
| Unit | Percentage (%) of people in Scotland. |
| Limitations and data development |
It is challenging to define and monitor an objective measure of success of public participation in climate policy and planning decisions as this is a subjective experience which is highly dependent on local context and experiences. Therefore, the proposed approach is to capture data on subjective satisfaction with opportunities to participate. The viability of this indicator is contingent on the commissioning of future waves of the Scottish Climate Survey. |
| Criterion | Assessment | Rationale |
|---|---|---|
| Relevance | High | Participation in the process is a key part of having a successful just transition. |
| Representativeness | Moderate | Captures people’s subjective views on their opportunities to influence local and national net zero policy making, but does not provide an objective measure of the quality or quantity of participation opportunities. |
| Data availability | Moderate | This data should be published on an annual basis but is subject to continued commissioning of the Scottish Climate Survey. |
| Sensitivity to change | High | This measure should be responsive to annual changes in self-reported satisfaction with participation opportunities at a Scotland-wide level. |
| Interpretability | High | A simple metric to understand, with clear lines of progress. |
| Practicality | Moderate | Requires ongoing resource commitment to commission the Scottish Climate Survey. |
JUST TRANSITION 2 - Community Energy
| Indicator Title | Operational capacity of community energy |
|---|---|
| Description | Operational capacity of community and locally owned energy installations in Scotland. |
| Data Source | Energy Saving Trust. |
| Expected trend | Increasing over time. |
| Unit | Megawatts (MW). |
| Limitations and data development | Owners, installers, certifiers and many funders of renewable energy systems do not currently have a mandatory requirement to report that these systems are in community or local ownership, therefore, much of the data is voluntarily provided or is sourced from public datasets that may be partial. |
| Criterion | Assessment | Rationale |
|---|---|---|
| Relevance | High | Community energy has been shown to create both monetary and non-monetary benefits in local areas, directly contributing to Scotland’s just transition outcomes. |
| Representativeness | Moderate | Captures the megawatts of installed capacity but does not provide evidence of the benefit of this to communities. |
| Data availability | Moderate | Data are published on an annual basis as part of Energy Saving Trust ‘Community and Locally Owned Energy in Scotland’ report. |
| Sensitivity to change | Moderate | This data should capture changes over time but as this data is not from a complete dataset, may not accurately reflect all changes. |
| Interpretability | High | A simple metric to understand, with clear lines of progress. |
| Practicality | High | Data collection, analysis and publication commissioned annually from the Energy Saving Trust. Requires minimal additional analytical resource. |
JUST TRANSITION 3 - Community Benefits
| Indicator Title | Average value of community benefits |
|---|---|
| Description | Average value of community benefits committed from renewable energy projects commissioned in the last 36 months. |
| Data Source | Local Energy Scotland (LES) community benefits register. |
| Expected trend | Increasing average value of community benefits committed from renewable energy projects, meeting or exceeding figures outlined in the Scottish Government’s “Good Practice Principles” for community benefits. |
| Unit | GBP (£). |
| Limitations and data development | The provision of community benefits is voluntary and the accuracy of the data depends on those developers or communities which submit the information. It is only collected where a community or developer form is attached to a project. |
| Criterion | Assessment | Rationale |
|---|---|---|
| Relevance | High | Enhancing community capacity and wealth is a key part of delivering a just transition. |
| Representativeness | Moderate | Captures the amount of money being provided to community benefits but does not reflect the distribution across the country or how this money is used. |
| Data availability | Moderate | This data is made publicly available by LES. Data is provided to LES by developers, project owners and fund administrators on a voluntary basis, therefore, some data may be outdated or inaccurate. |
| Sensitivity to change | Moderate | This data should capture changes over time but is reliant on voluntary reporting being timely and accurate. |
| Interpretability | High | A simple metric to understand, with clear lines of progress. |
| Practicality | Moderate | The data is collected, analysed and published by LES, funded by SG. It relies on ongoing voluntary reporting by developers, project owners and fund administrators. |
JUST TRANSITION 4 - Changes to Places
| Indicator Title | Percentage of people reporting improvements to their local area as a result of net zero infrastructure or land use change |
|---|---|
| Description |
Proportion of people reporting that changes to their local place due to net zero infrastructure and/or land use change have maintained or improved the quality of their local area. |
| Data Source | Scottish Climate Survey. |
| Expected trend | Maintaining or increasing over time. |
| Unit | Percentage (%) of the sub-set of people in Scotland aware of experiencing changes to their local place as a result of net zero infrastructure and/or land use change. |
| Limitations and data development | There are variables that will affect how people are feeling about their local area that are not caused by net zero developments, which may influence responses to these questions. The Scottish Climate Survey does not specifically target areas which have net zero developments underway as is therefore dependent on respondents having awareness of these developments. However, asking people about their own experiences and perceptions of this in their local area provides useful proxy for the impact of the net zero transition on local places. |
| Criterion | Assessment | Rationale |
|---|---|---|
| Relevance | High | Ensuring that local communities are not unfairly negatively impacted by net zero development is a key indicator of achieving a just transition. |
| Representativeness | Moderate | Captures perceptions of changes to quality of local areas as a result of the transition, but is a subjective measure that relies on respondents’ awareness of local net zero developments and their impact. |
| Data availability | Moderate | This data should be published on an annual basis but is subject to continued commissioning of the Scottish Climate Survey. |
| Sensitivity to change | Moderate | This measure should be responsive to changes in perceived quality of local areas. Depending on the achieved sample size, smaller changes may not be statistically significant. |
| Interpretability | High | A simple metric to understand, with clear lines of progress. |
| Practicality | Moderate | Requires ongoing resource commitment to commission the Scottish Climate Survey. |
JUST TRANSITION 5 – Fuel Poverty
| Indicator Title | Percentage of dwellings in fuel poverty |
|---|---|
| Description | Percentage of dwellings in fuel poverty for (i) all of Scotland and (ii) island, rural and urban geographies |
| Data Source | Scottish House Condition Survey (SHCS) |
| Expected trend | Decreasing percentage of dwellings in fuel poverty. Statutory targets set by the 2019 Fuel Poverty (Targets, Definition and Strategy) (Scotland) Act: by the end of 2040 no more than 5% of households will be in fuel poverty. No more than 1% of households will be in extreme fuel poverty. |
| Unit | Percentage (%) of dwellings |
| Limitations and data development | Data for this indicator are based on National Statistics from the SHCS, an annual national survey of Scotland's housing stock, which forms part of the Scottish Household Survey (SHS). Limitations to the indicator mainly stem from overlapping geographies when considering rural/urban classification and island local authorities. |
| Criterion | Assessment | Rationale |
|---|---|---|
| Relevance | High | Reducing fuel poverty is a key indicator of achieving a just transition. |
| Representativeness | High | The data provides a dedicated measure of fuel poverty, which is key to delivery of a just transition. |
| Data availability | High | The data is published annually as accredited official statistics with a reporting lag of just over a year (e.g. data for 2024 were published in February 2026) |
| Sensitivity to change | High | This data should capture change over time, but with a time lag of just over a year. |
| Interpretability | Moderate | A simple metric to understand, with clear lines of progress towards a statutory target. However, fuel poverty is affected by factors unrelated to the net zero transition, which should be taken into consideration when interpretating the data. |
| Practicality | High | Data come from the SHCS, a long-running annual national survey of Scotland’s housing stock. The data is analysed and presented in a format that can be used to monitor progress towards the statutory fuel poverty targets and therefore requires minimal additional resource. |
JUST TRANSITION 6 - Transport Affordability
| Indicator Title | Percentage of people that can afford their transport costs |
|---|---|
| Description |
Percentage of people reporting that they are able to afford their individual transport costs for (i) all of Scotland, (ii) island, rural and urban geographies, and (iii) people with different levels of household income. |
| Data Source | Scottish Household Survey (SHS). |
| Expected trend | Increasing over time. |
| Unit | Percentage (%) of people. |
| Limitations and data development |
Affordability of transport costs is used as a proxy for transport poverty. Transport poverty is multi-dimensional, integrating issues of availability, reliability, affordability, accessibility and safety, but this data will only provide information related to affordability. The data for this indicator is a subjective measure, based on people’s self-reported perceptions of affordability, rather than an objective calculation of affordability. The data does not allow for breakdown of affordability by transport mode. Limitations also stem from overlapping geographies when considering rural/ urban classification and island local authorities. |
| Criterion | Assessment | Rationale |
|---|---|---|
| Relevance | High | Transport poverty is a key indicator of achieving a just transition. |
| Representativeness | Moderate | Transport affordability is a key aspect of transport poverty. However, it does not account for other aspects of transport provision that may be affected by the transition to net zero, such as availability, reliability and accessibility and, therefore, does not provide a complete picture. |
| Data availability | High | The data is published annually as accredited official statistics with a reporting lag of just under a year (e.g. 2024 data were published in November 2025). |
| Sensitivity to change | High | This data should capture change over time with a time lag of just under a year. |
| Interpretability | Moderate | A simple metric to understand, with clear lines of progress. However, transport affordability is affected by factors unrelated to the net zero transition, which should be taken into consideration when interpretating the data. |
| Practicality | High | Data come from the SHS, a long-running annual general population survey in Scotland. Minimal additional resource is required. |
JUST TRANSITION 7 - Employment rate in oil and gas communities
| Indicator Title | Socio-economic impact on oil and gas communities |
|---|---|
| Description | Employment rate for people aged 16-64 in five local authorities with high socioeconomic dependence on oil and gas industries: (i) Aberdeen City; (ii) Aberdeenshire; (iii) Falkirk; (iv) Shetland Islands; and (v) Orkney Islands.[276] |
| Data Source | Annual Population Survey, Office for National Statistics (ONS). |
| Expected trend | Maintaining or increasing over time. |
| Unit | Percentage (%) of population. |
| Limitations and data development |
This indicator is a proxy for the community-level impact of the net zero transition in places with a strong socioeconomic connection to, and reliance on, oil and gas industries. Aberdeen City, Aberdeenshire and Falkirk have been selected as they are the local authorities with the highest proportion of total employment in these industries. The Shetland Islands and Orkney Islands have been included due to their strong connections to the oil and gas industry and island geography. Other methods of selection could result in different areas of interest. The data is only available at local authority level, which may not allow the granularity of more localised impacts to be clear. |
| Criterion | Assessment | Rationale |
|---|---|---|
| Relevance | High | Understanding the local impact of the transition in places that have historically had a strong connection to and reliance on oil and gas industries is a key indicator of whether a just transition has been achieved. |
| Representativeness | Low | Employment rate is an important element of the socioeconomic impact of the transition, however, it does not provide a complete picture. Moreover, the five communities identified to be monitored do not represent all communities in Scotland with connections to or reliance on oil and gas industries. |
| Data availability | High | Data published annually by ONS. |
| Sensitivity to change | High | This data should capture change over time. |
| Interpretability | Moderate | A simple, commonly-used metric. However, employment rate in these communities can be affected by factors unrelated to the net zero transition, which should be taken into consideration when interpretating the data. |
| Practicality | High | This data is collected, analysed and published by ONS and requires minimal additional analytical resource. |
JUST TRANSITION 8 - Proportion of households managing well financially in oil and gas communities
| Indicator Title | Impact on household finances in oil and gas communities |
|---|---|
| Description | Proportion of households reporting that they are managing well financially in three local authorities with a high proportion of employment in oil and gas industries: (i) Aberdeen City, (ii) Aberdeenshire, and (iii) Falkirk |
| Data Source | Scottish Household Survey (SHS) |
| Expected trend | Maintaining or increasing over time |
| Unit | Percentage (%) of households |
| Limitations and data development |
This indicator is a proxy for the financial impact of the net zero transition on people living in places that have historically had high employment in oil and gas industries. The data is a subjective, self-reported assessment of how well households feel they are managing financially, it does not provide a direct measure of the influence of the transition to net zero on individual household finances. Different methods could be used to select the places to be monitored for this indicator. Aberdeen City, Aberdeenshire and Falkirk have been selected as they are the local authorities with the highest proportion of total employment in these industries. Other methods of selection would result in different areas of interest. |
| Criterion | Assessment | Rationale |
|---|---|---|
| Relevance | High | Understanding the financial impact of the net zero transition on people living in places that have historically had high employment in oil and gas industries is a key indicator of whether a just transition is being delivered. |
| Representativeness | Low |
The three places identified to be monitored do not represent all places in Scotland with people employed in oil and gas industries. The data is a subjective assessment of how people feel about their household finances, it does not provide a direct, objective measure of household finances. |
| Data availability | High | The data is published annually as accredited official statistics with a reporting lag of just under a year (e.g. 2024 data were published in November 2025) |
| Sensitivity to change | High | This data should capture change over time. |
| Interpretability | Moderate | A simple metric to understand, with clear lines of progress. However, people’s perception of whether they are managing well financially is affected by factors unrelated to the net zero transition, which should be taken into consideration when interpretating the data. |
| Practicality | High | Data come from the SHS, a long-running annual general population survey in Scotland. Minimal additional resource is required. |
JUST TRANSITION 9 - Recipients of the Oil and Gas Transition Training Fund
| Indicator Title | Access to training for offshore oil and gas workers |
|---|---|
| Description | Number of recipients of the Oil and Gas Transition Training Fund joint SG and UKG initiative |
| Data Source | Oil and Gas Transition Training Fund (TTF) data via Skills Development Scotland and external evaluators (pilot phase only) |
| Expected trend | Fund is sufficient to meet demand |
| Unit | Number of recipients |
| Limitations and data development |
This indicator is a proxy for oil and gas workers having access to the retraining needed to secure equivalent jobs in net zero sectors. There are many routes to retraining for oil and gas workers and, currently, there is no feasible method for direct monitoring. The Oil and Gas TTF is an important mechanism for facilitating retraining, but it will only capture part of the picture. Another limitation of this indicator is that, as more workers are retrained, demand for this fund will decrease. Therefore, there is not a clear expected trend in terms of the number of recipients of the fund. Further, this indicator does not tell us if receiving training resulted in people transitioning into secure high-quality jobs in renewable or sustainable energy sectors. This information may be captured retrospectively via surveys. The quality and usefulness of this additional data is dependent on uptake of such optional surveys and quality of responses. |
| Criterion | Assessment | Rationale |
|---|---|---|
| Relevance | High | Ensuring people in oil and gas industries are equipped with the retraining required to enable access to equivalent jobs in net zero sectors is a key aspect of delivering a just transition. |
| Representativeness | Low | There are many routes to retraining for oil and gas workers, this indicator will only capture data on those taking up the Oil and Gas TTF. The number of recipients of the Fund will not tell us whether the training received resulted in high quality employment in a net zero sector, although it is anticipated that this could be captured through additional surveying. |
| Data availability | Moderate | Monitoring data is being collected by Fund administrators. The pilot phase is also being evaluated by an external evaluator. Availability of this data is dependent on ongoing funding of this joint SG and UKG initiative. |
| Sensitivity to change | High | This data should capture change over time. |
| Interpretability | Low | The indicator will capture the uptake of the Fund and whether it is meet demand. However, it will be challenging to correlate this with the extent to which oil and gas workers have access to the training required. |
| Practicality | High | Data are being collected by the Fund administrators. Limited additional analytical resource will be required. |
JUST TRANSITION 10 - Number of people employed in the low carbon and renewable energy economy
| Indicator Title | Green jobs |
|---|---|
| Description | Employment (full-time equivalent) in low carbon and renewable energy economy in Scotland. |
| Data Source | Low Carbon and Renewable Energy Economy (LCREE) survey, Office for National Statistics (ONS). |
| Expected trend | Increasing over time. |
| Unit | Number of people. |
| Limitations and data development | This indicator is a proxy for the number of jobs in net zero sectors (‘green jobs’) in Scotland. There is currently no standardised definition or metric for ‘green jobs’. There are various different approaches to defining the bounds of what should be counted, each with its own limitations. This indicator uses the definition and data from the ONS, which is the most commonly used source in the UK. The data is derived from the LCREE survey, which collects self-reported data on business activity from a sample of businesses in the UK. The methodology produces data with large confidence intervals which makes it unreliable for collecting data on small, emerging industries with a small workforce and can only be used for tracking relatively large changes over time. |
| Criterion | Assessment | Rationale |
|---|---|---|
| Relevance | High | The availability of good ‘green jobs’ is a key aspect of delivering a just transition. |
| Representativeness | Moderate | Data are survey-based, drawn from a sample of businesses rather than the whole population. The data does not reflect industries with smaller workforces. The indicator tracks overall employment, but does not provide information on the quality of the jobs. |
| Data availability | High | Data are published annually. |
| Sensitivity to change | Low | The methodology produces data with large confidence intervals which means that it is only sensitive to very large changes over time. |
| Interpretability | High | A simple metric to understand, with clear lines of progress. |
| Practicality | High | Data are collected, analysed and published by ONS. Minimal additional resource is required. |
JUST TRANSITION 11 - Proportion of small businesses reporting energy prices as an obstacle
| Indicator Title | Impact of energy prices on small businesses |
|---|---|
| Description | Proportion of small businesses (1-249 employees) in Scotland reporting the level of energy prices as a major obstacle to the success of their business. |
| Data Source | Scotland Small Business Survey. |
| Expected trend | Decreasing over time. |
| Unit | Percentage (%) of small businesses. |
| Limitations and data development |
This indicator is a proxy for the financial impact of the net zero transition on small businesses. The potential impact of the net zero transition on energy prices is just one of many ways in which small businesses may be affected. The data is survey-based. Sampling methodology and questionnaire changes means that it will not always be comparable from year to year. |
| Criterion | Assessment | Rationale |
|---|---|---|
| Relevance | High | Understanding the financial impact of the net zero transition on small businesses is an important indicator of whether a just transition is being delivered. |
| Representativeness | Low | The potential impact on energy prices is just one of many ways in which small businesses may be affected by the net zero transition. Therefore, this indicator will not provide a full understanding of the impact of the net zero transition on small businesses. |
| Data availability | High | Data are published annually. |
| Sensitivity to change | Moderate | Data is collected on an annual basis and should allow for change to be monitored over time. However, sampling limitations may mean that it is not always possible to make a comparison from year to year. |
| Interpretability | Moderate | This is a simple metric with a clear expected trend. However, energy prices may be affected but factors unrelated to the net zero transition, therefore, observed changes may not be directly correlated with the impact of the net zero transition. |
| Practicality | High | Data are routinely collected, analysed and published and will require minimal additional resource. |
JUST TRANSITION 12 – Emissions of the eight priority Air Quality pollutants
| Indicator Title | Air pollution |
|---|---|
| Description | Emissions of the eight priority Air Quality pollutants (ammonia, carbon monoxide, nitrogen oxides, non-methane volatile organic compounds, particulate matter, sulphur dioxide and lead) for (i) Scotland and (ii) industrial sector. |
| Data Source | National Atmospheric Emissions Inventory. |
| Expected trend | Decreasing over time. |
| Unit | Kilotonnes (kt). |
| Limitations and data development | This indicator is a proxy for measuring the impact of the net zero transition on environmental quality. It provides an overall measure of air quality in Scotland, Whilst there is strong evidence of the negative health impact of both long and short term exposure to air pollution, the indicator will not provide information on how air pollution this is affecting people, and the equality implications. The air pollution inventory for Scotland is made by disaggregating UK level data, which introduces a degree of uncertainty that is further compounded when disaggregated by industrial sector. |
| Criterion | Assessment | Rationale |
|---|---|---|
| Relevance | Moderate | The impact of the net zero transition on environmental quality is an important aspect of just transition, however, it does not directly capture the effect on people. |
| Representativeness | Moderate | The indicator provides an overall measure of air quality in Scotland but it will not provide an assessment of the equality implications of changes in air quality in particular places or for particular groups of people. |
| Data availability | High | Data published annually |
| Sensitivity to change | High | This data should capture change over time. |
| Interpretability | Moderate | This is a set of simple metrics with a clear expected trend. However, air quality may be affected but factors unrelated to the net zero transition, therefore, observed changes may not be directly correlated with the impact of the net zero transition. |
| Practicality | High | Data is routinely collected, analysed a published and will require minimal additional resource. |
Analytical Annex
Section Overview
This annex provides an overview of the analytical material which has underpinned the development of the CCP. The information is presented by sector, together with the relevant baseline scenarios and associated policy and proposal packages.
The content is prepared in accordance with the requirements of the Climate Change (Scotland) Act 2009, which provides that the CCP must set out:
- The contributions towards meeting the carbon budgets that should be made by each of the sectors and by each group of associated policies set out in the plan, and
- An estimate of the costs and benefits associated with the policies set out in the plan.
The analytical work has been carried out by analysts across the relevant areas of Scottish Government and agencies and has, in general, followed a bottom-up process whereby policies and proposals, or groupings of policies and proposals, have been assessed for their impact on emissions and costs and benefits. This bottom-up analysis has used various analytical models and estimation approaches appropriate to each context. The component estimates for each policy and proposal or group of policies and proposals have then been summed to give the sector and whole-plan totals. Each element of the analytical process has had its own quality assurance process undertaken at the sector level.
Since the publication of the draft CCP in November 2025 a number of estimates have been updated. These reflect changes in wider context including announcements by the UK Government as well as updates to Scottish Government analysis reflecting new data. This Analytical Annex sets out the details as to how these estimates were arrived at.
Baseline
The CCP comprises a package of measures adopted or proposed by the Scottish Government to mitigate climate change, including policies already in force but under continuing Ministerial discretion. These are assessed against and in addition to a baseline position in which such policies are assumed to have not been enacted, and all policies are assessed on this basis. The baseline takes account of expected wider actions by the private sector and by the UK Government which, while outside the scope of the CCP, are expected to influence Scottish Emissions.
While the baseline costs are not a part of the CCP’s overall cost estimate, it is apparent that these investments will still be required and take place as part of the overall transition to net zero. Scottish Government is aware of a number of upcoming investments required as part of routine investment into the growing economy and in turn to enable the transition to net zero, including planned investment into the grid which could total around £42 billion over the RIIO-T3 period (2026-2031)[277]
Policies and Proposals
The Climate Change (Scotland) Act 2009 distinguishes between ‘policies’ and ‘proposals’. Policies are where it is possible to clearly set out a specific action, scale, a lever of choice, an outcome and a timeline, and, thus, it is possible to set out clear delivery details and cost implications. Proposals are where it is possible to clearly set out an outcome and a timeline, and it is recognised action needs to take place, generally these will have impact later in the plan period, so, consequently, more concrete detail on the precise policy levers and cost implications is more difficult to present. Proposals are not costed owing to the absence of sufficient certainty, though their estimated emissions impact is recorded.
All estimates of emissions reductions in this document include impacts of both policies and proposals.
Policy Categorisation
To frame the different policies and proposals that are included in the Scottish Government’s policy package, this annex divides the policies in the CCP into three broad classifications:
- Key policies/proposals – these policies are direct drivers of emissions reductions or are the most significant actions that drive emissions reductions. They often have financial impacts and would result in emissions reductions regardless of other policies.
- Supporting policies/proposals – these policies are actions that help support key policies, and while some could drive emissions reductions themselves are more likely to make a key policy more efficient, cost effective or support the wider just transition implications of a policy. Enabling policies have financial impacts but any emissions impact is captured in the key policy they support.
- Narrative policies – narrative policies are important policies that support long-term action but have not progressed to the point of having clear impact. These include things like ongoing work to influence the UK Government in reserved areas that might influence Scottish emissions and research projects that are not yet in progress. Narrative policies are not included in this annex as they have not yet materialised in terms of financial or emissions impacts. If a policy that is specified in the main body of the CCP does not appear in this annex it is because it is a narrative policy and should be assumed to have no immediate impact.
Presentation of Financial Impacts
For each policy or group of associated policies this annex sets out:
1. Benefits – this is calculated as the additional benefits resulting from the group of policies over and above the expected baseline:
e.g. if an Electric Vehicle was £1,000 cheaper to run each year than the petrol or diesel equivalent then the expected benefit would be £1,000 per year of operation.
2. Net CCP Costs – this is calculated as the additional costs over and above the expected baseline as a consequence of the associated group of policies less the benefits resulting from that group of policies. If the benefits exceed the costs, the net CCP cost figure will be shown as negative.
e.g. if an Electric Vehicle is expected to cost £10,000 to purchase but costs £1,000 less to operate over the period of analysis then this annex would show a net CCP cost of £9,000 (£10,000 – £1,000) and a Benefit of £1,000.
The annex presents these as totals for each carbon budget of the plan period. All financial values are in 2025 prices unless otherwise stated. As noted above, all financial values are for policies only.
Summary of Impacts
This section provides a summary of the details contained within this annex.
Through the period of the CCP, Scotland is projected to decarbonise significantly under the planned pathway with emissions in the third carbon budget less than half those of the first. This decarbonisation is driven by actions across all sectors, but most significantly is driven by the decarbonisation of car and vans, the restoration of peatland and the development of removals. Areas of residual emissions persist where decarbonisation is difficult or impossible, including Agriculture, Aviation and LULUCF, but investment in technological and natural offsets provide opportunities to mitigate these emissions.
The table below shows the expected pathway of remaining emissions in each carbon budget period following the policies and proposals in the CCP.
| MtCO2e | 2026-2030 | 2031-2035 | 2036-2040 |
|---|---|---|---|
| CCP emissions pathway | 163.8 | 119.7 | 76.9 |
| Scottish Carbon Budget levels | 174.6 | 125.8 | 81.2 |
The Scottish Government’s CCP substantially reduces emissions between 2026 and 2040 and is projected to meet each carbon budget and put Scotland firmly on the path to net zero by 2045.
Over the course of the CCP, emissions are projected to decline across all sectors. The table below shows the breakdown of the emissions pathway by sector.
| MtCO2e | 2026-2030 | 2031-2035 | 2036-2040 |
|---|---|---|---|
| Residential and Public Buildings | 28.8 | 26.6 | 18.0 |
| Transport | 54.2 | 37.5 | 24.6 |
| Waste Management | 6.1 | 4.4 | 3.4 |
| Energy Supply | 9.9 | 2.3 | 0.0 |
| Business and Industrial Process | 25.4 | 19.4 | 13.1 |
| NETs | -0.2 | -3.0 | -12.2 |
| Agriculture | 36.3 | 33.7 | 30.2 |
| LULUCF | 3.6 | -1.1 | 0.0 |
| Total | 163.8 | 119.7 | 76.9 |
Note: Totals may not sum due to rounding
The overall estimates of net CCP costs and benefits are presented below, showing the total direct financial estimates resulting from policies. This shows that CCP costs are most significant in the initial years where there are more policy related costs and fewer benefits. In later periods there are more proposals, which are not costed given the significant uncertainties, and more significant benefits from the policies.
| 2025 £million | 2026-2030 | 2031-2035 | 2036-2040 |
|---|---|---|---|
| Benefits | 9,784 | 15,246 | 17,319 |
| Net CCP costs | 5,395 | 311 | -3,562 |
Note: negative net CCP cost figures indicate that the estimated benefits exceed the costs. Totals may not sum due to rounding
CCP| 2025 £million | 2026-2030 | 2031-2035 | 2036-2040 |
|---|---|---|---|
| Residential and Public Buildings | 89 | 155 | 162 |
| Transport | 4,334 | 9,368 | 12,733 |
| Waste Management | 1,315 | 1,549 | 236 |
| Energy Supply | 0 | 0 | 0 |
| Business and Industrial Process (inc. NETs) | 41 | 41 | 41 |
| Agriculture | 3,200 | 3,200 | 3,200 |
| LULUCF | 805 | 933 | 947 |
| Total | 9,784 | 15,246 | 17,319 |
Note: Totals may not sum due to rounding. NETs is included as part of Business and Industrial processes as investment for NETs technologies overlaps with investment for CCUS that is used in Industry decarbonisation although the emissions abatement will not necessarily be used to offset industry.
| 2025 £million | 2026-2030 | 2031-2035 | 2036-2040 |
|---|---|---|---|
| Residential and Public Buildings | 1,619 | 504 | 285 |
| Transport | 3,406 | -2,173 | -6,894 |
| Waste Management | -95 | -403 | -137 |
| Energy Supply | 0 | 0 | 0 |
| Business and Industrial Process (inc. NETs) | 486 | 2,304 | 3,113 |
| Agriculture | 30 | 30 | 30 |
| LULUCF | -51 | 49 | 41 |
| Total | 5,395 | 311 | -3,562 |
Note: Totals may not sum due to rounding. Negative net CCP cost figures indicate that the estimated benefits exceed the costs. Totals may not sum due to rounding
Buildings (Residential and Public)
Summary
Summary of Residential and Public Buildings Pathway
The Residential and Public Buildings sector decarbonises by 53% between 2025 and 2040 under the CCP pathway. The primary driver of emissions reductions is the transition from fossil fuels to clean heat sources in residential buildings. Additionally, substantial reductions are achieved through the installation of clean heating systems in public buildings over the period. The table below shows the estimated emissions arising for the CCP pathway of the Residential and Public Buildings sector for each carbon budget. The table following shows the pathway broken down by the component subsectors.
| MtCO2e | 2026-2030 | 2031-2035 | 2036-2040 |
|---|---|---|---|
| Residential and Public Buildings sector emissions pathway | 28.8 | 26.6 | 18.0 |
| Residential and Public Buildings baseline emissions | 29.1 | 28.8 | 28.6 |
| Residential and Public Buildings total policy reductions | 0.3 | 2.2 | 10.6 |
Summary of Emissions Sources
Emissions from the Residential and Public Buildings sector are primarily as a result of the use of polluting heating systems such as natural gas, oil or other fossil fuel boilers. There are currently around 2.2 million residential properties in Scotland using a polluting heating system, and around 309,000 properties using a clean heating system.[278] Of those using polluting heating systems, around 92% use mains gas, 6% use oil, and the rest use LPG or solid fuel. Emissions reductions in the pathway are primarily achieved by transitioning to clean heating systems such as heat pumps or heat networks.
| MtCO2e | 2026-2030 | 2031-2035 | 2036-2040 |
|---|---|---|---|
| Residential | 24.4 | 22.4 | 15.1 |
| Public | 4.5 | 4.2 | 2.9 |
| Total | 28.8 | 26.6 | 18.0 |
Note: Totals may not sum due to rounding
Summary of Costs and Benefits
An assessment has been undertaken of the financial costs and benefits associated with the CCP policies to reduce emissions in the Residential and Public Buildings sector. Cost estimates for CB1 reflect the additional investment required to transition from fossil fuel heating systems to clean heat alternatives to support the delivery of the clean heat target, including improvements to energy efficiency, as well as the costs associated with minimum energy efficiency standards which occur in 2030. Costs in later carbon budgets (CB2 onwards) are associated with the development of heat networks, the remaining years (2031-2033) of minimum energy efficiency standards and Energy Performance Certificate (EPC) reform. Quantified benefits primarily relate to energy savings resulting from improved energy efficiency, as well as the wider benefits linked to increased uptake of EPCs driven by reform. A summary of these impacts is presented in the table below.
| 2025 £million | 2026-2030 | 2031-2035 | 2036-2040 |
|---|---|---|---|
| Benefits | 89 | 155 | 162 |
| Net CCP costs | 1,619 | 504 | 285 |
Baseline
Residential and Public Buildings Baseline Emissions
| MtCO2e | 2026-2030 | 2031-2035 | 2036-2040 |
|---|---|---|---|
| Baseline emissions | 29.1 | 28.8 | 28.6 |
The current baseline for Residential and Public Buildings is based on the latest Greenhouse Gas Inventory[279] and assumes that there is no significant decarbonisation which occurs as no further policy action takes place. The small reduction reflects the impact of F-gas regulations on the baseline[280] and a reduction in heating demand over time due to a warming climate. In order to assess the impact of a warming climate on the baseline for Residential and Public Buildings, analysis has been conducted internally to track the effect of increasing temperatures on gas demand in Scotland, which we estimate at approximately 0.2 MtCO2e less emissions per year by 2040.
The baseline assumes no increase in emissions from new buildings due to the New Build Heat Standard, which mandates the use of clean heating systems instead of oil and gas boilers. It also assumes that reductions mainly as a result of high energy prices in recent years are maintained. In the absence of additional measures, it is assumed that there is insufficient incentive to drive large-scale adoption of clean heating systems, which typically involve higher upfront capital costs compared to replacing existing systems.
Analytical Methodology for Baseline
The baseline was estimated through a continuation of the emissions levels for the sector reported in 2023. A minor adjustment was made to reflect the impact of GB-wide F-gas regulations on the baseline, by applying the anticipated percentage reductions from these regulations to the sector’s existing F-gas emissions. The impact of rising temperatures on heating emissions is estimated by modelling the relationship between average temperature and heating demand, then applying this to Met Office projected climate trends. As the modelling is based on the 2023 Greenhouse Gas (GHG) Inventory, 2023 is used as the base year. Internal regression modelling has been carried out to determine how emissions change over time using Met Office data on population-weighted heating degree days (HDDs).[281] Previous years from before the COVID-19 pandemic are not included due to the material impact that the pandemic has had on building energy demand and usage. The baseline is subject to considerable uncertainty, driven by factors that are difficult to predict, such as temperature variability, future energy prices, UK Government policy decisions, and the future availability and cost of emerging technologies.
Policy Assessment
Residential Buildings
Residential building emissions are primarily from the use of heating systems in domestic buildings. These are reduced through swapping to lower emissions heating systems, and to a lesser extent through efficiency improvements which can reduce a building’s heat demand. There are a number of small emissions resulting from the use of cooking, composting and household machinery.
Key Policies
- Heat in Buildings – Clean Heat Target – Residential
- New heat network proposals
Supporting Policies
- Financial support for energy efficiency
- Minimum energy efficiency standards for the Private Rented Sector (PRS)
- Social Housing Net Zero Standard
- Energy Performance Certificate Reform
- Delivery schemes, including:
- Home Energy Scotland (HES) Advice Service
- HES Grant and Loan
- Area Based Schemes
- Warmer Homes Scotland
- PRS Loan
- Social Housing Net Zero Heat Fund
- Heat Networks Support Unit
- Scotland’s Heat Network Fund
- Future finance
- Local Heat and Energy Efficiency Strategies
- Community And Renewable Energy Scheme
Residential Buildings emissions impact of policies and proposals by carbon budget
| MtCO2e | 2026-2030 | 2031-2035 | 2036-2040 |
|---|---|---|---|
| Emissions reductions | 0.2 | 1.9 | 9.0 |
Analytical Methodology
Residential heating policy is framed by the target to decarbonise buildings by 2045, as set out in the draft Buildings (Heating and Energy Performance) and Heat Networks (Scotland) Bill,[282] supported by a series of grants, loans and support services to incentivise direct transition away from fossil fuel heating to heat pumps and other clean heat sources.
In outline, the modelling for the pathway has two main sections:
- The first section, covering CB1, takes a predominantly bottom-up approach. In CB1, emissions reductions are modelled based on the estimated impact of expected expenditure on clean heat and energy efficiency measures delivered through Scottish Government schemes.
- The second section covers CB2 and CB3, in which a predominantly top-down approach is taken. The modelling is driven primarily by the overall decarbonisation target and derives a conservative emissions reduction trajectory that aligns with this target. Specific, bottom-up estimates are made to identify the contribution of identifiable policy impacts (for example, the contribution of expansion of heat networks through the use of powers to require certain properties to change from fossil fuel heating systems when they have the opportunity to connect to a heat networks, and other policy interventions). Remaining clean heat conversions – for example, domestic conversion to heat pumps – are not modelled bottom up and by specific policy interventions, and are assumed to be sufficient to allow the overall achievement of the necessary decarbonisation.
In deriving the pathway, the total number of fossil fuel heated buildings in each sector is calculated using the Scottish House Condition Survey.[283] From here, an average emissions profile per building type and for each sector can be calculated, using the GHG 2023 inventory, and therefore, the quantity of buildings that need to decarbonise to meet the target by 2045 is estimated.
It is assumed that all carbon emitting building heating systems will be replaced in the pathway by zero direct emissions heating systems, and that 13% of buildings will be exempt from energy efficiency installation measures (the 13% is the estimated number of buildings which are “hard to treat” and is based on the number of pre-1919 properties). We assume that energy efficiency installations have a relatively small impact on emissions overall, and in the case of minimum energy efficiency standards reduce emissions by around 10% per building. Heat network deployment for residential buildings is based on internal modelling on available sites and total expected capacity (more detail is provided below).
As noted, the pathway is in part based on known policy interventions which will take place at currently planned rates or best estimates. For example, policies for energy efficiency installations in social and private rented sector properties take place at the end of CB1 and into CB2. It is also assumed that in CB2 the development of heat network capacity and connection corresponding to 1 TWh of demand takes place, with a commensurate number of connections. Further development of Heat networks continues through CB3, connecting a total of 284,800 domestic buildings by 2040.
In CB3, we assume that consumer uptake of clean heat installations continues to grow significantly in a way that builds on the progress driven by the target and other policies described above – as well as by similar policies at the UK level and which use reserved policy levers to accelerate progress – and that this continues to drive further national development of clean heating system supply chains.
Financial Impact Summary
Residential Buildings financial impact of policies by carbon budget
| 2025 £million | 2026-2030 | 2031-2035 | 2036-2040 |
|---|---|---|---|
| Benefits | 89 | 155 | 162 |
| Net CCP costs | 1,489 | 214 | -1 |
Costs associated with the delivery of the clean heat target are included in CB1 where there is greater certainty on action required. For subsequent carbon budgets the policy levers will be determined based on the outcome of existing Scottish Government policy, technologies and UK Government policy decisions. As such they are not costed, given their proposal status.
The remaining costed policy for the residential sector in CB3 is EPC reform. Over CB3 the estimated costs of EPC reform are slightly more than offset by the benefits of minimum energy efficiency standards and the benefits of EPC reform, giving a net cost of -£1 million (i.e. a small net benefit).
Costs associated with minimum energy efficiency standards for the PRS and the Social Housing Net Zero Standard occur between 2030 and 2033, meaning that the costs of these policies fall primarily in CB2. EPC reform policy is costed in all carbon budgets.
Cost Summary
The current Residential CCP policy package is expected to have a net cost of around £1.7 billion from 2026 to 2040, noting that delivery of the target is only costed to 2030 given the need for greater certainty based on outcomes of existing Scottish Government policy, technology development and UK Government policy decisions. The cost estimates presented reflect the additional cost required to transition from fossil fuel heating systems to clean heating alternatives, along with the supporting infrastructure necessary to enable this and improvements to energy efficiency. It is assumed that a substantial portion of these costs will be borne by the Scottish Government, with the remainder falling to consumers. Businesses and Local Authorities that lease properties will also face costs as they decarbonise their buildings.
Heat network installations for residential buildings are estimated to cost £8,000 per building, which is based on a sample of known installations, taking the average capex across the sample. The pathway contains approximately 40,000 connections to heat networks in CB2.
The total cost of heat network infrastructure for the residential sector is calculated by taking the estimated total demand expected from heat networks in Scotland once all suitable sites are connected (13.4TWh total) and an estimated cost per TWh of £1.1 billion. The cost attributed to the residential sector is calculated as the estimated percentage of demand on the heat network from residential users, which is around 63%.[284] The estimated total cost for heat network infrastructure (which is a costed policy only in CB1 for residential buildings) is £379 million and the residential portion of the cost is £239 million.
For clean heat installations which are not heat networks, the assumed average cost per installation is £11,500, based on internal modelling of the weighted average cost across a sample of installs. A “learning rate” is applied to the costs of installation for clean heat installations, which is designed to reflect increases in knowledge, efficiency, and supply chain development in the sector. We assume that the cost of installation decreases by approximately 11% for every doubling of the number of installs. This assumption is taken from the CCC modelling methodology.[285]
The estimated cost of the Residential CCP policy package in CB1 is £1.5 billion, which includes the residential component of heat network infrastructure spending. This is on the spending review funding package totals for each policy activity, attributed by the heat demand of each sector.
Benefit Summary
We have quantified only the benefits associated with financial support for energy efficiency, EPC reform, minimum energy efficiency standards for the PRS and the Social Housing Net Zero Standard. These benefits are the savings generated by reducing energy demand of a property through these measures, estimated to be 10% on average for non-fuel poor households, and 5% on average for fuel poor households. The remaining policies are assumed not to have substantive benefits above and beyond their support for the key emissions reduction objectives. The benefit to the residential sector of improvements in energy efficiency and EPC reform is the subsequent reduction in energy demand, estimated to be £406 million over the course of the pathway.
Average residential unit electricity prices are currently around five times the level of gas unit costs.[286] While heat pumps can be around three times more efficient than traditional gas boilers, this is currently offset by the electricity-to-gas price ratio, making it unlikely that households will experience reduced running costs from switching to heat pumps under current energy prices.[287]
There is potential for reduced running costs in the future if electricity prices decline relative to gas (e.g. if the UK Government were to use its reserved powers to reduce electricity prices). However, this potential benefit has not been quantified due to difficulties with predicting future energy prices which are influenced by a wide range of unpredictable factors, such as geopolitics, UK Government policy decisions and future energy demand. This is a particular issue given how the uncertainty could change the overall direction of the impact (i.e. depending on the relative electricity to gas ratio it could be a benefit or a cost).
In addition to the financial benefits, the deployment of clean heat and energy efficiency may provide health benefits through improvements to thermal comfort. Furthermore, switching away from polluting heating systems may have additional benefits in terms of reducing pollution and improving air quality.
Technical Uncertainties
The modelling underpinning the baseline and emissions reduction trajectory is subject to considerable uncertainty, driven by factors that are difficult to model, such as temperature variability, future energy prices, UK Government policy decisions, and the future availability and cost of emerging technologies. For example, changes to energy prices are not modelled in this analysis, and future energy costs are uncertain. Possible changes to energy prices do not, therefore, influence the indirect demand for clean heating conversions in our analysis (through, for example, changes to the expected running costs of clean heating systems). Significant future movement in energy costs – through market effects or policy interventions – may affect the rate of decarbonisation of the sector.
Dependencies
In order to support decarbonisation of buildings, supply chain development is assumed to occur in industries to deliver increasing retrofit, energy efficiency installation and heat pump manufacture related to delivery of the trajectory. Our estimates also assume sufficient training provision uptake over the pathway.
It is assumed that the investment required to develop heat networks continues to be available over the pathway.
Delivery
A key delivery mechanism is grant funding and loans to incentivise the switch to clean heating. The Scottish Government continues to monitor levels of grant awards and engage with industry to ensure the necessary pipeline of skills.
Public Buildings
Key Policies
- Heat in Buildings – Clean Heat Target – Public
- New heat network proposals
Supporting Policies
- Green Public Sector Estate Decarbonisation Scheme
- Energy Performance Certificate Reform
- Heat Networks Support Unit
- Scotland’s Heat Network Fund
- Local Heat and Energy Efficiency Strategies
| MtCO2e | 2026-2030 | 2031-2035 | 2036-2040 |
|---|---|---|---|
| Emissions reductions | 0.05 | 0.3 | 1.6 |
Analytical Methodology
For non-domestic buildings we follow the same approach used in domestic buildings. Numbers of non-domestic and public buildings are sourced from Non-Domestic Analytics (which is a database of the Scottish non-domestic building stock[288]). We estimate initial decarbonisation in CB1 based on current trends and policy support. For more detail see the residential sector above, as the overall methodology carried out is broadly the same, with some exceptions. For example, evidence and data on non-domestic energy efficiency is less robust than evidence for residential energy efficiency. These impacts are, therefore, not modelled for non-domestic buildings.
Financial Impact Summary
| 2025 £million | 2026-2030 | 2031-2035 | 2036-2040 |
|---|---|---|---|
| Benefits | - | - | - |
| Net CCP costs | 130 | 290 | 286 |
Costs associated with the delivery of the clean heat target are included in CB1 where there is greater certainty on action required. For subsequent carbon budgets the policy levers will be determined based on the outcome of existing Scottish Government policy, technologies and UK Government policy decisions. As such they are not costed, given their proposal status. Costs associated with heat network provisions are included for CB1, CB2 and CB3. Heat network infrastructure costs are calculated in the same manner as set out in the residential section above (i.e. attributing the total cost of providing a total 13.4 TWh energy supply by the heat demand of each sector).
Cost Summary
The current Public Buildings Decarbonisation CCP policy package is expected to have an additional cost of around £706 million from 2026 to 2040, noting that delivery of the target is only costed to 2030 given the need for greater certainty based on outcome of existing Scottish Government policy, technology development and UK Government policy decisions. The cost estimates reflect the additional cost required to transition from fossil fuel heating systems to clean heating alternatives, along with the supporting infrastructure necessary to enable this. This is based on an average install cost per heat network installation at £8,000, deployed over 2,400 buildings, and an average heat pump installation cost of £11,500, deployed across 11,400 total buildings. It is assumed that the majority of these costs will be borne by the Scottish Government, with significant costs also falling on local authorities.
Benefits Summary
Benefits associated with decarbonising public buildings are not quantified in the Plan period.
Average non-domestic electricity prices per unit were around five times the level of gas prices per unit in the third quarter of 2025.[289] While heat pumps can be around three times more efficient than traditional gas boilers, this efficiency advantage is currently offset by the electricity-to-gas price ratio, making it unlikely that public buildings will experience reduced running costs from switching to heat pumps under current energy prices.[290]
There is potential for reduced running costs in the future if electricity prices decline relative to gas. However, this potential benefit has not been quantified due to difficulties with predicting future energy prices which are influenced by a wide range of unpredictable factors, such as geopolitics, UK Government policy decisions and future energy demand.
Technical Uncertainties
The modelling underpinning the baseline and emissions reduction trajectory is subject to uncertainty, driven by factors that are difficult to model, such as temperature variability, future energy prices, UK Government policy decisions and the future availability and cost of emerging technologies. For example, changes to energy prices are not modelled in this analysis, and future energy costs are uncertain. Possible changes to energy prices do not, therefore, influence the indirect demand for clean heating conversions in our analysis (through, for example, changes to the expected running costs of clean heating systems). Significant future movement in energy costs – through market effects or policy interventions – may affect the rate of decarbonisation of the sector.
Dependencies
In order to support decarbonisation of buildings, supply chain development is assumed to occur in industries to deliver increasing retrofit, energy efficiency installation and heat pump manufacture related to delivery of the trajectory. Our estimates also assume sufficient training provision uptake over the pathway.
It is assumed that the investment required to develop heat networks continues to be available over the pathway.
Delivery
A key delivery mechanism is grant funding and loans to incentivise the switch to clean heating. The Scottish Government continues to monitor levels of grant awards and engage with industry to ensure the necessary pipeline of skills.
Transport
Summary
Summary of Transport Pathway
The Transport sector decarbonises by around 67% between 2025 and 2040 under the CCP pathway, mainly driven by the electrification of cars, vans, trucks and buses. By 2040, the largest remaining sources of emissions are expected to be aviation (1.8 MtCO2e) and shipping (1.2 MtCO2e). While these sectors are expected to undergo some decarbonisation over time, the outlook for emissions from aviation and shipping is heavily dependent on future transport demand and the pace of technology rollout for lower carbon solutions. A summary of the Transport emissions pathway for the CCP is shown in the table below with the breakdown of that pathway into sub sectors shown in the table following.
| MtCO2e | 2026-2030 | 2031-2035 | 2036-2040 |
|---|---|---|---|
| Transport sector emissions pathway | 54.2 | 37.5 | 24.6 |
| Transport baseline emissions | 60.6 | 53.4 | 45.1 |
| Transport total policy reductions | 6.4 | 15.9 | 20.5 |
Summary of Emissions Sources
In 2023, road transport (cars, vans, trucks and buses) was responsible for the majority (68%) of total Scottish transport GHG emissions, with aviation (15%), shipping (14%) and others (3%) making up the remainder.
Between 2025 and 2035, road transport is required to significantly decarbonise (a reduction of 64%) under the CCP pathway. In particular, emissions generated by cars, vans and HGVs will gradually decline as policies designed to replace Internal Combustion Engine (ICE) vehicles with Zero Emission Vehicles (ZEVs) take effect. Policies to incentivise modal shift away from private car to sustainable modes of transport and freight from road to rail and water will also play a supporting but lesser role in reducing road transport emissions in Scotland. Aviation will experience little decarbonisation as gradual uptake of sustainable aviation fuel (SAF), aircraft efficiency improvements and contributions from Emissions Trading Schemes (UKETS/CORSIA) are expected to be offset by potential demand growth for air travel at Scottish airports. The decline in shipping emissions is mostly tied to the outlook for shipping activity which is expected to decline alongside reductions in oil and gas activity in the North Sea, and the potential impact from International Maritime Organisation (IMO) policies relating to carbon pricing.
As a result, by 2035, road transport is estimated to be responsible for less than half of total Scottish transport emissions (48%), followed by Aviation (30%) and Shipping (19%). A small share of emissions (3%) is made up of other sources, such as rail.
In 2040, emissions from aviation are projected to be the single largest contributor (43%) to total Scottish transport emissions. Road transport will have experienced significant decarbonisation – representing only 27% of Scotland’s transport emissions. Emissions resulting from shipping movements will have fallen further, accounting for 28% of total Scottish transport emissions.
| MtCO2e | 2026-2030 | 2031-2035 | 2036-2040 |
|---|---|---|---|
| Car | 19.4 | 10.4 | 4.3 |
| LGV | 8.4 | 4.6 | 2.0 |
| HGV | 6.4 | 4.8 | 2.3 |
| Bus | 1.2 | 0.9 | 0.6 |
| Aviation | 10.2 | 9.8 | 9.4 |
| Shipping | 7.4 | 6.0 | 5.4 |
| Other | 1.2 | 1.0 | 0.6 |
| Total | 54.2 | 37.5 | 24.6 |
Note: Totals may not sum due to rounding
Summary of Costs and Benefits
Total financial benefit of the transport package across the planned period is in excess of £26 billion, taking account of the operating and maintenance costs savings associated with electric cars and vans compared with petrol and diesel vehicle equivalents; economic benefit from free bus travel for young people aged 22 and below and older and disabled persons; and reduced operating and maintenance costs of zero-emission trucks relative to those powered by diesel.
| 2025 £million | 2026-2030 | 2031-2035 | 2036-2040 |
|---|---|---|---|
| Benefits | 4,334 | 9,368 | 12,733 |
| Net CCP costs | 3,406 | -2,173 | -6,894 |
Baseline
Transport Baseline Emissions
| MtCO2e | 2026-2030 | 2031-2035 | 2036-2040 |
|---|---|---|---|
| Baseline emissions | 60.6 | 53.4 | 45.1 |
In the absence of policy action, transport emissions are expected to follow a gradual decline over time. The baseline takes account of several inputs including transport demand forecasts.
For cars, vans, trucks and buses, some car demand decarbonisation is expected over time as newer more efficient vehicles replace older vehicles, and uptake of electric vehicles (for cars, vans and buses) continues as it has done in recent years. These savings are to some extent offset by forecast increases in demand for road transport.
For shipping, the baseline assumes a gradual decrease in emissions due to expected changes in vessel movements. The decline in shipping emissions is mostly tied to the outlook for shipping activity, which is expected to decline alongside reductions in oil and gas activity in the North Sea in the coming decades.
For aviation , the emissions baseline is relatively flat over the period to 2040. There are some improvements expected from newer more efficient aircraft, from the gradual introduction of SAF and from emissions trading schemes, however, these improvements are mostly offset by expectations around growth in demand for air travel.
Analytical Methodology for Baseline
The baseline emissions trajectory estimates the expected emissions outlook for the transport sector in the absence of the policy actions set out in the CCP.
For each transport mode, a forecast of future demand (such as number of car miles driven; or passenger-km travelled by aeroplane) is taken together with assumptions around consumer choice, technological progress, fleet replacement and the impact of any other relevant policies (such as UK Government or International policies that apply to Scotland) to make an assessment of the baseline emissions trajectory.
For example, in the case of cars, future demand is estimated by building on historical trends and incorporating the impact of future economic cycles and developments. An assumption is made around the rate of EV uptake based on historical uptake, noting that this is likely to be lower than the rate of uptake compared to ‘with policy’, which is combined with forecasts of fuel efficiency of new ICE vehicles and fleet replacement rates to form an emissions baseline. Further detail on baseline estimation is provided in each section below.
The baseline approach draws upon the evidence and analysis developed for Transport Scotland[291] and the Scottish Government.[292]
Policy Assessment
Car and Vans
Transport Package 1 – Measures to Encourage Uptake of EVs for Cars and Vans
Key Policies
- Vehicle Emissions Trading Scheme (VETS) and ZEV mandate
- EV Infrastructure Fund (public EV Chargepoint network)
- Consumer incentives
Supporting Policies
- Investment in the skills to support the EV transition (such as in servicing and maintenance of EVs, and charging infrastructure installation and maintenance
- Additional support to enable the more rapid rollout of critical EV charging infrastructure including public EV charging in Rural communities and cross pavement charging at domestic properties.
- Action plan for the decarbonisation of the Public Sector fleet
| MtCO2e | 2026-2030 | 2031-2035 | 2036-2040 |
|---|---|---|---|
| Emissions reductions | 4.8 | 13.8 | 17.7 |
The decarbonisation of cars and vans is expected to occur through electrification, as policies designed to encourage the uptake of EVs gradually increase the share of zero-emission vehicles on the road, and polluting ICE vehicles are removed. The pathway is delivered through three key interlinked policies:
- The VETS legislation, which includes the ZEV mandate, sets targets on vehicle manufacturers for the emissions of new polluting vehicles and for the share of new vehicles sold that must be zero-emission. The ZEV mandate sets a gradually increasing target for new zero emission vehicles sales, reaching 80% of new cars and 70% of new vans by 2030. The UK Government has also set a target of phasing out the sale of new petrol and diesel cars by 2030 and vans by 2035.
- Incentives to support consumers and businesses to make the transition to EVs, making use of public funding to crowd in private investment.
- Expansion of the public EV charging network.
Taken together with advice provided by the CCC around assumptions on consumer choice and future EV uptake, this package of measures is expected to lead to increases in car and van sales.
The emissions pathway is aligned with the CCC’s outlook for Scotland – which presumes that EV uptake outstrips the ZEV Mandate for cars (from 2026) and vans (from 2028). This expectation is driven by consumer choice and preference, built on an expectation that the price of EVs reach parity with new petrol/diesel cars and vans from 2025. In order for EV uptake to outstrip the Mandate, vehicle supply and charging infrastructure will also need to keep pace with vehicle demand. The CCC Progress Report for Scotland, published on 25 February, identifies that “risk remain due to the potential use of ZEV mandate flexibilities and lower confidence in achieving the CCP pathway". The Scottish Government will take forward the development of potential contingency options to address the risk that could be implemented if required.
Baseline
As with all baseline pathways the initial starting point is the GHG inventory[293] which gives the emissions levels in 2023 for cars and vans as 6.9 MtCO2e (cars 5.1 MtCO2e, vans 1.8 MtCO2e).
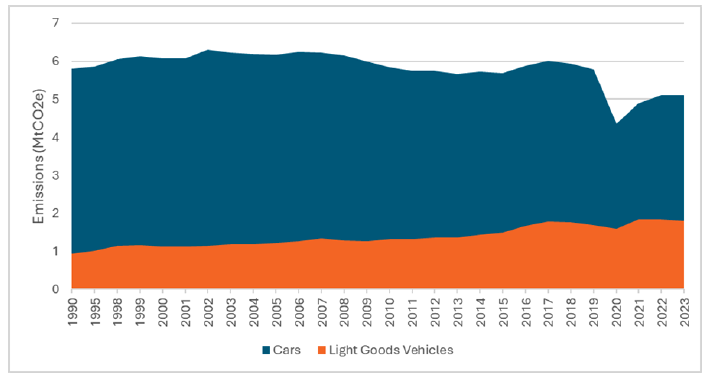
The main source of emissions from cars and vans is ‘tailpipe’ emissions i.e. the emissions emitted from petrol and diesel vehicles as a result of combusting fuel. Additional sources of emissions include air pollutants arising from tyres and brake usage.
In general, total emissions from the car and van fleet are determined by the number of vehicles on the road; the distance travelled by those vehicles; the age, fuel efficiency and emissions standard of those vehicles; and the amount of fuel used.
The baseline emissions trajectory estimates the expected emissions outlook for cars and vans in the absence of the policy actions set out in the CCP.
In the baseline i.e. in the absence of additional policy actions, total emissions from cars and vans are expected to gradually reduce. This is a result of gradual uptake of Electric Vehicles through consumer choice, albeit at a slower rate than could be achieved with policy to encourage EV uptake. This is combined with forecasts of fuel efficiency of new ICE vehicles, based on Department for Transport forecasts, and fleet replacement rates, based on historical data. This outlook for the fleet composition is then combined with forecasts of future travel demand, which predicts increases in total distance travelled by both cars and vans across the plan period. To some extent this reduces the impact that EV adoption has on emissions in the baseline.
The baseline approach draws upon the evidence and analysis developed for Transport Scotland and the Scottish Government.
Analytical Methodology
Modelling of the emissions pathway starts with the baseline emissions trajectory, and layers on the impact of key policy actions set out in the plan. The primary approach is to identify how policies can encourage the adoption of EVs and increase their presence in the fleet, in turn reducing total emissions from cars and vans relative to the baseline.
Firstly, the EV sales targets and implications of successful delivery of the VETS are taken into account. This increases the annual rate of uptake of EVs to be in line with the ZEV mandate, which leads to a greater number of EVs in the fleet earlier in the plan period, therefore, reducing total emissions. Modelling the delivery of VETS is built upon analysis originally prepared by the Department for Transport[294], which has been modified to take into account developments in the legislation and the Scottish context.
The VETS, including the ZEV mandates, are the primary mechanism for increasing electric vehicle (EV) uptake across the UK. The mandates require 80% of new cars and 70% of new vans to be zero emission by 2030. At introduction, VETS was expected to deliver around 40 MtCO2e of cumulative emissions savings by 2045 and represented the single largest transport decarbonisation policy for Scotland. Flexibilities introduced in 2025 allow manufacturers to borrow, trade or pay fees to defer compliance. While 2030 targets remain unchanged, these flexibilities permit lower EV sales and higher emissions through to 2029.
Updated modelling now suggests cumulative savings of around 25.2 MtCO2e by 2045. Department for Transport modelling suggests that the enhanced flexibilities equate to an additional 0.3 to 0.5 MtCO2e in Scotland during Carbon Budget 1 (2026 to 2030). The remaining emissions gap to the CCC pathway is 33.7 MtCO2e.
Market evidence indicates EV uptake is already below VETS annual headline targets. New car sales achieved 19.6% in 2024 and 23.4% in 2025 against targets of 22% and 28% respectively,[295] with larger under delivery expected in the van sector. Although manufacturers remain compliant overall, further change may be possible through the Interim Review of VETS in 2027.
As noted above, the CCP pathway for cars and vans is aligned to the advice provided by the CCC, which is reliant on uptake of EVs at a faster pace than required by the ZEV mandate. To achieve this, additional financial incentives which reduce the price discrepancy between ICE vehicles and EVs are assumed to encourage faster adoption of EVs, supported by continued development of the EV charging network.
Scottish Government analysis shows that, in the absence of additional interventions, there is a significant risk that EV uptake is likely to be significantly lower than the CCC pathway due in part to a significant EV to petrol car price gap of around £15,000 for new vehicles, contrary to the CCC assumption of price parity by 2025. New UK Government policies such as EV road pricing (eVED), are sending signals to consumers which may disincentivise adoption. The CCC[296] do note that there is risk to achieving this pathway, due to the potential use of ZEV mandate flexibilities and lower confidence in achieving the CCP pathway uptake before price parity is reached.
The exact form of additional interventions, should they be necessary, would need to be determined as required, but their aim would be to encourage the level of consumer choice towards EVs that is required to meet the CCC’s trajectory uptake of electric cars and vans, through, for example, vehicle scrappage schemes which is noted by the CCC as a potential contingency policy to incentivise ICE owners to replace vehicles ahead of end of life.
Financial Impact Summary
| 2025 £million | 2026-2030 | 2031-2035 | 2036-2040 |
|---|---|---|---|
| Benefits | 1,196 | 5,420 | 8,544 |
| Net CCP costs | 1,626 | -3,804 | -8,427 |
Central costs and benefits estimates are presented in the table above. There is considerable uncertainty in some costs of the policy pathway. The costs for this policy pathway are shared across Scottish Government (to deliver the policies outlined above), local government (to deliver local schemes and replace vehicles in their fleets), industry (to meet the supply of EVs required to deliver the pathway) and consumers (to purchase the EVs). Over the period to 2040, the net cost to consumers is expected to become negative as the combined purchase and operating costs fall below that of ICE equivalents. The main financial benefits of this policy package will flow to consumers and businesses who operate cars and vans.
Cost Summary
Central costs estimates are presented in Table 19. There is considerable uncertainty in some costs of the policy pathway. The costs for this policy pathway are shared across Scottish Government (to deliver the policies outlined above), local government (to deliver local schemes and replace vehicles in their fleets), industry (to meet the supply of EVs required to deliver the pathway) and consumers (to purchase the EVs). Over the period to 2040, the net cost to consumers is expected to become negative as the price of new EVs falls below that of ICE vehicles.
Costs have been estimated from a range of sources, including historical and forecasts costs of purchasing vehicles using internal Transport Scotland analysis, analysis prepared by the Department for Transport in its Cost-Benefit Analysis of the ZEV mandate,[297] data published by the Society of Motor Manufacturers and Traders[298] and the CCC in its Methodology Report.[299] The main approach to modelling costs is to compare the additional cost of purchasing a new EV compared to an ICE vehicle over the plan period, with an assumption that the price differential between the two vehicle categories will gradually close over time. The costs of delivering policy in this area are informed by previous delivery of similar schemes, such as through development of the public charging network, and internal analysis of the level of consumer incentives that may be required to deliver the pathway.
Benefit Summary
Central monetised benefits estimates are presented in Table 19. There is considerable uncertainty in some benefits of the policy pathway and these are sensitive to assumptions around future vehicle purchase and operating prices. The main financial benefits of this policy package arise in the form of lower operating and maintenance costs of EVs compared to conventional petrol and diesel vehicles. The main assumption delivering these benefits is that EVs will continue to cost less to operate and maintain than petrol or diesel equivalents, and that as the number of EVs in the fleet increases, the total financial outlay for consumers and businesses to operate vehicles will decrease relative to the baseline scenario. At the same time, the purchase price differential between new electric and ICE vehicles is expected to decrease over the plan period.
The main groups realising these benefits will be consumers and businesses who operate cars and vans. These benefits are estimated by comparing the operating costs price differential between ICE vehicles and EVs, which draws upon evidence presented by the CCC. Benefits are related to the number of EVs in the fleet under the CCP pathway. To undertake the estimation, vehicle purchase price costs are compared using internal analysis of retail prices as well as data such as that published by the Society of Motor Manufacturers and Traders[300] and the CCC in its Methodology Report.[301] Assumptions on operating and maintenance costs are informed by data such as that published by Energy Savings Trust,[302] which shows that EVs can be up to 40% cheaper to run than petrol or diesel equivalents. These costs are projected forwards using Department for Transport appraisal guidance[303] for future fuel and electricity prices and combined with forecasts of EV uptake and total vehicle mileage to produce the overall benefits estimation.
Dependencies
The pathway for these estimates is dependent on a number of factors which could pose significant risk to its delivery, including:
- Delivery of the ZEV mandate and use of the flexibilities within the mandate could reduce its effectiveness,
- Supply of EVs and consumer demand to purchase those vehicles: achieving the pathway requires more vehicles to be sold than is required under the ZEV mandate,
- The future price of vehicles: higher EV prices would mean that financial incentives are less effective or that greater incentives are required, and
- The future price of fuel and electricity: lower fuel prices and/or higher electricity prices could mean that ICE vehicles remain on the roads for longer.
Technical Uncertainty
EVs have emerged as the predominant technology for zero-emission cars and vans. There is some uncertainty surrounding vehicle replacement rates and future emissions of non-EVs that will remain in the fleet over the Plan period.
Costs and benefits of this pathway are sensitive to future price changes for fuel and vehicles, which are uncertain.
Delivery
Delivery of this pathway takes place through a combination of EV sales targets (ZEV Mandate), financial incentives to encourage faster switching to EVs, and development of the charging landscape in Scotland.
It is noted that there is substantial risk to the delivery of this pathway, noting the dependencies above which are largely out with the control of Scottish Ministers, and additional contingency measures may be required.
Transport Package 2 – Measures to Reduce Car Use
Key Policy
- Successor policy for car use reduction
Supporting Policies
- Providing free bus travel for those aged under 22 and older and disabled persons through the National Concessionary Travel Schemes
- Work with LAs and RTPs to provide research, advice and guidance on reducing car use
- Multi-year funding for the development of bus infrastructure (Bus Infrastructure Fund) and development of Trunk Road bus priority
- Development of smart and integrated ticketing, digital enhancements to journey planning and improvements to the National Concessionary Travel Schemes
- Investment in active and sustainable travel programmes
- Promotion of car and bike share schemes; Mobility as a Service; demand responsive transport; and multi-modal mobility hubs
| MtCO2e | 2026-30 | 2031-35 | 2036-40 |
|---|---|---|---|
| Emissions reductions | 0.8 | 0.9 | 0.9 |
Reducing emissions from cars will principally be made through the sale and purchase of EVs to replace polluting petrol and diesel equivalents, however, an element of car use reduction via modal shift towards more sustainable forms of public and active travel will be required to achieve the desired level of emission reduction for cars.
In their advice to the Scottish Government, the CCC assume a 4% reduction in car use by 2030 (on 2030 forecast levels) will be required in addition to 90% of new car sales being electric by 2030 to achieve the emission reduction from cars in the first carbon budget (2026-2030). The advice also includes a 6% target by 2035. The Scottish Government has since adopted this 4% target by 2030 (on our own 2030 ‘business as usual forecast baseline’). In practical terms, this equates to a 2.3% reduction in annual car km relative to 2019 levels.
This policy package contains a suite of policies that can reduce future car use demand. While there is limited evidence regarding the effectiveness of some interventions in isolation, the combined impact of the policies may potentially generate the car use reduction required. It should also be noted that these policies have a wider objectives than the CCP, delivering a range of co-benefits including improvements to health and wellbeing; tackling inequalities via improving access to services and employment; and reducing congestion.
Baseline
As with all baseline pathways the initial starting point is the GHG inventory which gives the emissions levels in 2023 for cars as 5.1 MtCO2e. As described above, the baseline emissions trajectory for cars takes into account the outlook for the composition of the vehicle fleet and forecasts of future demand.
Specifically with regards to future car demand, an annual forecast for total car kilometres driven is generated based on historical trends, factoring in the impact that economic cycles may have on car demand. This forecast allows for an assessment of how policies to reduce car demand may be having an effect over the plan period relative to the baseline (i.e. no-policy) scenario, however, such forecasting contains a significant degree of uncertainty and it is likely that the baseline will be revised in future as required to take into account economic developments. The car demand baseline used in the CCP is within a close range of alternative forecasts, such as those produced by the CCC, Department for Transport and those previously produced by Transport Scotland.
Analytical Methodology
The analytical approach to this policy package estimates the combined impact that the suite of policies could have on future car demand. It estimates the potential role that improvements to, for example, cycling infrastructure, could have on reducing the demand for car trips. When trips that would have otherwise been made by car are taken by lower or zero-carbon alternatives, such as by active travel or by public transport, it reduces the total emissions from cars in the baseline.
The approach estimates the potential distance travelled by car that could be reduced by measures to encourage travel by other modes, and calculates the emissions saved relative to car travel by journeys transitioning from car to bus, or from car to cycling, for example.
While there is limited evidence for how some of these types of interventions individually act to encourage modal shift, it is assumed that the package of interventions taken together has the potential to reduce car demand by in 2030 by around 4% below what it otherwise would be without these incentives. This draws on the analysis published by the Scottish Government[304] and is in line with analysis presented by the CCC.
Financial Impact Summary
| 2025 £million | 2026-2030 | 2031-2035 | 2036-2040 |
|---|---|---|---|
| Benefits | 3,067 | 3,540 | 3,300 |
| Net CCP costs | 883 | 48 | -30 |
The main financial costs of this package relate delivery of Scottish Government policies as well as potential local policies, in particular, to concessionary travel scheme costs and delivery of infrastructure for active and public transport, and potential costs of local car use reduction schemes. Given the bulk of the costs relate to policies that have objectives that are wider than climate change, the costs associated with this policy package cannot be fully attributed to climate change objectives. While the policies included have a supporting role in delivering climate change ambitions, the costs should be viewed as additional to the core CCP policy package given the wider objectives of the bulk of policy spend in this package.
Cost Summary
Costs associated with this policy pathway fall to local and central government, as these organisations will fund delivery. The approach to estimating costs is based on historical spend, forecast spending plans, and operational expertise of delivering these types of policies within Scottish Government.
There are significant costs to providing free bus travel to young people aged 5 to 21 years-old, those aged 60 or above and disabled people, and delivery infrastructure for active and sustainable travel. However, these policies and programme are not solely for the purpose of delivering climate change commitments and have far wider objectives such as: improving health and wellbeing; improving air quality; increasing social and economic opportunities; and reducing financial barriers to accessing vital services. Therefore, the costs associated with this policy package cannot be fully attributed to climate change objectives. It is not possible to estimate a share of these policy costs that contribute to climate change objectives, as without delivery of the policies in full with their associated costs, the full benefit of emissions savings would not be realised.
Benefit Summary
The main financial benefits arise in the form of the economic transfer to individuals as a result of free bus travel to under 22s and older and disabled people. These benefits are estimated using historical[305] and forecast data from concessionary travel schemes to identify the financial value of the schemes to its users.
These policies also generate significant wider benefits, which have not been monetised and, therefore, are not captured within the benefits assessment, including improved health and wellbeing and access to services and employment, alongside benefits relating to reduced congestion. As most of these benefits are generated by policies with a wider scope than the CCP, they cannot fully be attributed to the CCP. However, because these policies contribute towards emissions reduction, they are included for completeness.
Dependencies
This pathway is dependent on:
- The specific type and location of active and public travel interventions, as infrastructure developments in rural areas may have differing impacts to those in urban areas, for example,
- The speed at which interventions are delivered: earlier action generates larger cumulative emissions savings, as at that point in time there will be relatively more emitting (ICE) vehicles on the road,
- Sustainability of routes and services within the public transport network – if access to public transport was reduced, policies to encourage its use would be less effective in switching users from private car, and
- Local and regional decisions on approaches to reducing car use – depending on approaches taken locally, reductions in car use could be sped up or more limited.
Technical Uncertainty
There is considerable uncertainty in forecasting baseline car demand, as it is dependent on a range of societal and economic factors which can change according to national and global events. The CCP baseline is considered to be appropriate at this point in time, however, it is anticipated that the baseline will be revised as required in future.
Delivery
Delivery of emissions reduction is centred around creating the enabling environment for car users to reduce their amount of car travel, through local and national schemes and interventions that encourage use of other more sustainable modes of travel.
Heavy Duty Vehicles
Transport Package 3 – Measures to Reduce Emissions from Heavy Duty Vehicles
Key Policies
- Investment in the replacement of vehicles and deployment of charging infrastructure
- Energy market reform to support decarbonising transport including HGVs
- Support skills development and aspect of economic development to support just transition.
- Grant support for modal shift of freight from road to rail or water
- Consideration and implementation of regulatory measures to encourage and ensure transition to zero-emission vehicles
Supporting Policies
- Measures required to end the sale of fossil fuel powered trucks in 2035
- Support for the decarbonisation of Transport (Plugged-in Communities)
- Investments to enable more freight to be moved by rail
- Government support for bus decarbonisation
| MtCO2e | 2026-30 | 2031-35 | 2036-40 |
|---|---|---|---|
| Emissions reductions | 0.9 | 1.2 | 1.9 |
Truck decarbonisation is expected to be achieved via the transition to zero emission vehicles. This transition is supported by three interlinked policies which aim to encourage the uptake of zero-emission HGVs, alongside developing the required charging infrastructure and providing the skills required to support a just transition to a zero-emission market.
The emissions pathway for the policy package follows the advice presented in the CCC’s Balanced Pathway for HGVs, which is reliant on rapid uptake of zero emission trucks beginning from the late 2020s. To achieve the level of uptake needed to deliver the emission reductions set out by the CCC, financial incentives are required to support the up-front costs of more expensive vehicles and encourage the industry to invest in zero-emission trucks, alongside significant investment in charging infrastructure especially as Scotland faces additional challenges with longer average journey distances and more remote locations.
Further interventions to reduce emissions from the movement of freight, including grants for modal shift from road to rail or water, are also required.
Baseline
As with all baseline pathways the initial starting point is the GHG inventory which gives the emissions levels in 2023 for HGVs as 1.6 MtCO2e.
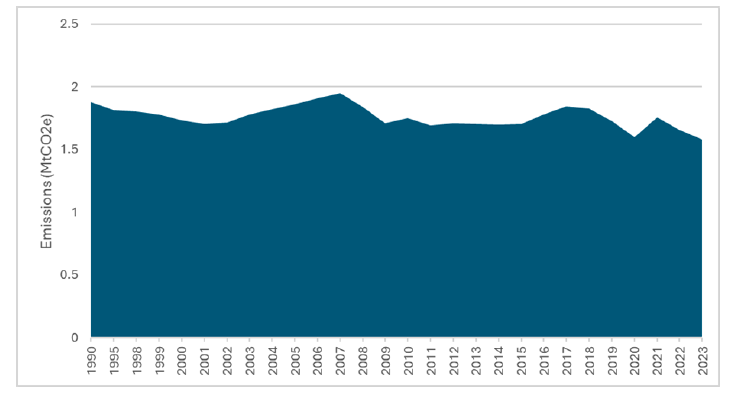
The main source of emissions from HGVs is ‘tailpipe’ emissions – i.e. the emissions emitted from petrol and diesel vehicles as a result of combusting fuel. Additional sources of emissions include air pollutants arising from tyres and brake usage.
In general, total emissions from the HGV fleet are determined by the number of vehicles on the road; the distance travelled by those vehicles; the age, fuel efficiency and emissions standard of those vehicles, and the amount of fuel used.
The baseline emissions trajectory estimates the expected emissions outlook for HGVs in the absence of the policy actions set out in the CCP.
In the baseline (i.e. in the absence of additional policy actions), total emissions from HGVs are expected to gradually reduce.
This is a result of gradual uptake of more efficient (and ultimately Zero Emissions) Vehicles through market forces, albeit at a slower rate than could be achieved with additional policies to encourage uptake. Forecasts of future demand for HGV miles travelled forms the starting point of the baseline, which predicts increases in total distance travelled by HGVs across the plan period. This is combined with fleet replacement rates, based on historical data to estimate the required number of new vehicles. Finally these are combined with assumptions informed by EU and UK regulations about how much more efficient new vehicles will become in order to produce emissions forecasts.
Analytical Methodology
In the baseline (i.e. in the absence of additional policy actions), total emissions from HGVs are expected to gradually reduce. This is a result of gradual uptake of more fuel efficient (including electric) vehicles through market factors and supported by enabling policies, albeit at a slower rate than could be achieved with additional policy to encourage EV uptake.
The modelling approach starts by setting expectations for fleet turnover. These are based on historical fleet composition data (it is assumed that HGVs are required to be replaced at a similar age and rate to those that have been replaced in the past) and forecasts of future travel demand (it is assumed that there will be an increase in total distance travelled by HGVs across the Plan period). Once this has been assessed, it is possible to estimate the requirement for new vehicles. This results in a forecast of individual cohorts (by year of sale) of HGVs within the fleet. The rate at which more efficient vehicles are assumed to be adopted and the extent to which they are more efficient is tied to EU Regulations and draft (consultation stage) UK Regulations. Once combined with assumptions about the likely emissions intensity of different HGV cohorts, an emissions forecast is deduced.
The model has also been combined with forecasts of fuel efficiency of new ICE vehicles, based on the EU and UK regulations and made with reference to Department for Transport forecasts to estimate the requirement for Zero Emission (or Zero Emission Equivalent) sales in order to achieve the outcomes in the baseline.
The emissions pathway for the policy package follows the advice presented in the CCC’s Balanced Pathway for HGVs, which is reliant on rapid uptake of zero emission trucks beginning from the late 2020s. To achieve the level of uptake needed to deliver the emission reductions set out by the CCC, financial incentives are required to support the up-front costs of more expensive vehicles and encourage the industry to invest in zero-emission trucks, alongside significant investment in charging infrastructure especially as Scotland faces additional challenges with longer average journey distances and more remote locations.
It is assumed that these interventions are successful in encouraging zero-emissions HGV uptake to the levels required to meet the pathway set out in the CCC’s advice. The modelling approach builds on the approach for the baseline described above, assuming greater uptake of EVs as a result of financial intervention. The CCC, in its 2025 Scottish Progress Report, has acknowledged the risk with efforts to encourage electric HGV adoption and the Scottish Government will keep progress under review and develop contingency plans for additional interventions should these be required.
Further interventions to reduce emissions from the movement of freight, including grants for modal shift from road to rail or water, are also required.
To assess the impact of incentives to encourage freight modal shift from road to rail or water, estimates are made for the potential volumes of freight and HGV-distance travelled that could be transitioned to other modes for a given level of funding. The emissions saved are calculated by comparing the relative emissions of tonne-kilometres of HGVs to other modes. This assessment is informed by historical data from the delivery of existing modal shift schemes in Scotland.
Financial Impact Summary
| 2025 £millions | 2026-2030 | 2031-2035 | 2036-2040 |
|---|---|---|---|
| Benefits | 71 | 407 | 890 |
| Net CCP costs | 896 | 1,584 | 1,563 |
Unlike cars where the cost of EV cars falls below petrol and diesel powered equivalents, it is assumed the upfront capital cost of zero-emission HGVs will remain greater than ICE equivalents over the plan period. Costs estimates reflect an estimated £5-9.5 billion additional investment above the baseline scenario of replacing the fleet with new diesel vehicles spanning from 2025 to 2050. These costs are indicative based on an assumed 10% Scotland share (representative of an approximate Scotland population share of the UK) of the estimated £50 billion to £100 billion required at a UK-level to transition to zero-emission HGVs.[306] Costs could be greater if, for example, road lengths are used to apportion costs to Scotland – around 15% of the UK’s roads are in Scotland, meaning costs may be £7.5 billion to £15 billion. This may be more appropriate given Scotland’s significantly higher portion of landmass that is rural. Applying Scotland’s share of road freight lifted (12% of the UK’s road freight is lifted in Scotland) would suggest a cost range from £6-12 billion.
The main direct benefits of the policy pathway are expected to come in the form of reduced operating and maintenance costs of zero-emission vehicles compared to diesel vehicles. Monetised benefits are indicative and intended to give an idea of the scale and direction of benefits.
Cost Summary
Unlike cars where the cost of EV cars falls below petrol and diesel powered equivalents, it is assumed the upfront capital cost of zero-emission HGVs will remain greater than ICE equivalents over the plan period. Costs estimates reflect an estimated £5-9.5 billion additional investment above the baseline scenario of replacing the fleet with new diesel vehicles spanning from 2025 to 2050. These costs are indicative based on an assumed 10% Scotland share (representative of an approximate Scotland population share of the UK) of the estimated £50-100 billion required at a UK-level to transition to zero-emission HGVs. Costs could be greater if, for example, road lengths are used to apportion costs to Scotland – around 15% of the UK’s roads are in Scotland, meaning costs may be £7.5-15 billion. This could be used as an alternative given Scotland’s significantly higher portion of landmass that is rural. Applying Scotland’s share of road freight lifted (12% of the UK’s road freight is lifted in Scotland) would suggest a cost range from £6-12 billion.
Benefit Summary
Most of the direct benefits of the policy pathway will accrue to industry who own and operate the majority of HGVs. The main benefits are expected to come in the form of reduced operating and maintenance costs of zero-emission vehicles compared to diesel vehicles. To produce these estimates, assumptions are made around the operating costs of zero-emission HGVs compared to ICE vehicles, drawing on industry analysis prepared for the CCC[307]. These operating costs are projected forwards and compared to those of ICE vehicles using values recommended in Department for Transport appraisal guidance, and combined with the rate of EV uptake and total vehicle demand under the policy pathway to produce the benefits estimation. While the operating and maintenance costs of Zero-Emission HGVs are expected to come down over time as a result of greater use of electricity in the fleet, the upfront purchase price of vehicles and charging infrastructure is expected to outweigh the benefits of lower operating costs over the Plan period.
Monetised benefits are indicative and intended to give an idea of the scale and direction of benefits. The net benefits to business considers the saving in operating costs compared to the baseline level of EV uptake without policy intervention. These estimates draw on the analysis published by the CCC, however, it is noted that financial benefits are sensitive to assumptions around vehicle price and operating costs in future.
Dependencies
The most significant dependency is energy network readiness, including timely reinforcement of transmission and distribution networks and reform to the connections process. Grid upgrades can take several years and are governed by UK wide regulatory frameworks, meaning Scotland does not control investment decisions or timing. The ability of Distribution Network Operators to deliver competitive, timely quotes and secure reinforcement works is essential for project viability
Related to this is planning and permitting capacity. The deployment of both depot and enroute charging infrastructure requires local authority planning approvals and land agreements, with multiple landowners sometimes needing to sign way leave agreements. The availability of strategically located land, particularly along trunk roads represents another key dependency.
A major component of the Total Cost of Ownership for HGVs (ICE or zero emission) is energy costs. Shifts in energy cost – whether in diesel, electricity or another fuel – may change the technology that makes most commercial sense and affect business investment decisions.
The project also depends on UK wide regulatory decisions, including the timeline and design of phaseout regulations for diesel HGV sales, vehicle weights/length standards, and consistency with UKG schemes such as the Plugin Truck Grant (PiTG). Misalignment could distort market signals, leading to underinvestment or cost burdens falling disproportionately on Scottish operators.
Finally, the project depends heavily on availability of skilled labour, including EV technicians, high voltage engineers, civil contractors, grid planners and charging infrastructure specialists. Competition from the wider net zero economy (e.g., offshore wind, grid reinforcement programmes) presents a risk that skills availability could become a binding constraint.
Technical Uncertainty
The zero-emission HGV market is at a relatively early stage compared to other vehicles, and so there is uncertainty surrounding the likely costs, availability, charging infrastructure and applications of zero-emission HGVs.
Delivery
Delivery of this emissions pathway is expected to take place through policies and incentives designed to encourage private sector investment in zero-emission HGVs and charging infrastructure.
It is noted that there is substantial risk to the delivery of this pathway, noting the dependencies above which are largely outwith the control of Scottish Ministers, and additional contingency measures may be required.
Aviation
Transport Package 4 – Measures to Decarbonise the Aviation Sector
| MtCO2e | 2026-30 | 2031-35 | 2036-40 |
|---|---|---|---|
| Emissions reductions | 0.0 | 0.0 | 0.0 |
The aviation sector’s emissions pathway will be reliant on the success of the UK Government’ Sustainable Aviation Fuel (SAF) mandate and Jet Zero strategy, alongside international airspace change and emission trading scheme policies. Because these policies are not owned by the Scottish Government, their impact is also captured in the emission baseline pathway for aviation. Scottish policy is expected to deliver limited emission reduction for aviation, with a primary focus on decarbonising domestic flights which make up a small proportion of total Scottish aviation emissions.
Baseline
As with all baseline pathways the initial starting point is the GHG inventory which gives the emissions levels in 2023 for Scotland’s aviation sector to be 1.9 MtCO2e – largely composed of emissions generated by international flights (1.5 MtCO2e), with a smaller amount attributable to domestic aviation (0.4 MtCO2e).
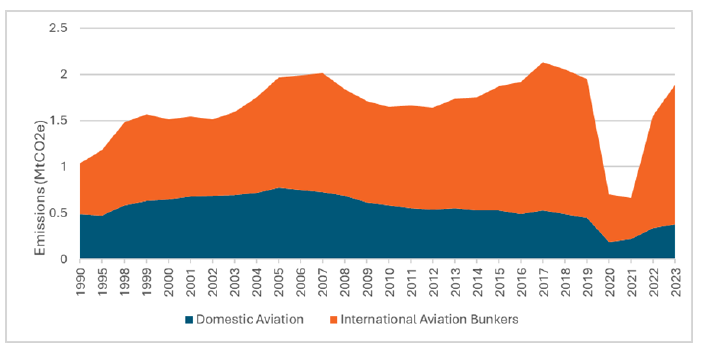
Scotland’s aviation emissions have steadily risen since 1990, driven mainly by the expansion of, and demand for, international air travel – prior to the onset of COVID-19 restrictions which severely impacted the global aviation sector, the number of international and UK offshore aircraft movements in Scotland steadily increased, peaking at 155,000 in 2019.[308] In contrast, emissions from Scotland’s domestic flights have fallen slightly, partly due to reduced domestic air travel – the number of domestic flights in Scotland has followed a downwards trajectory since the mid-2000s.
Looking ahead, the sector’s emissions output in Scotland will be contingent on the supply and use of SAF, production of low and zero-emission hydrogen and electric powered aircraft that can replace existing jet fuelled powered aircraft on commercial routes, and technological advancements that drive efficiency improvements such as enhanced aerodynamics. These changes are expected to deliver some emission reduction over the next 10 to 15 years, however, potential terminal passenger growth at Scottish airports alongside the introduction of new long-haul routes may partially counteract efforts to reduce the sector’s emissions output over the short and medium term.
Analytical Methodology
The emissions pathways takes a balanced view of the evidence presented in the UK Government’s Jet Zero modelling framework[309] and advice provided by the CCC to the Scottish Government. Introducing SAF, improvements in aircraft efficiency, contributions from Emission Trading Schemes (UK ETS/CORSIA) and an adjusted demand forecast to account for potential growth at Scottish airports are accounted for in the pathway. As these measures and their corresponding impacts are not directly related to Scottish policy working to achieve this pathway, it can be considered as an aviation baseline.
Scotland’s aviation emissions include emissions associated with aircraft flying from Scotland domestically (within the UK) and internationally. Emissions are calculated by combining data on fuel consumption, aircraft type, journey length and other factors. Emissions are allocated to Scotland based on the volume of fuel consumed at Scottish origin airports.
The package of Scottish Government policies, which relate to flights within Scotland and the introduction of ADT, have not identified significant quantifiable emissions savings at this stage.
Financial Impact Summary
| 2025 £millions | 2026-2030 | 2031-2035 | 2036-2040 |
|---|---|---|---|
| Benefits | 0 | 0 | 0 |
| Net CCP costs | 2 | 0 | 0 |
Significant costs are expected in the process of manufacturing and purchasing SAF, developing new aviation technologies, and the development, testing deployment of zero emission aircraft, for example. In their advice to Scotland, the CCC have estimate the additional capital and operating expenditure associated with the balanced pathway for the aviation sector in Scotland to be more than £3.5 billion between 2025 and 2045. This cost accounts for deployment of SAF, technological advancements to improve aircraft efficiency, production of low and zero-emission aircraft and engineered removals of residual emissions generated by aeroplanes. Although some of these assumptions underpinning the Scottish Government’s pathway differs to that of the CCC, it provides a sense of the costs involved in decarbonising the sector. These are not, however, as a result of Scottish Government policy in this area, and are, therefore, not considered as an additional cost resulting from the delivery of the CCP. The costs are expected to be incurred in response to wider UK and international policy to decarbonise aviation. A relatively smaller cost to the Scottish Government is expected in administrating the development of its own Air Departure Tax (ADT).
Cost Summary
A cost to the Scottish Government of around £2 million for this policy package is expected during carbon budget one (2026-2030) in relation to internal work to develop ADT, however, more significant costs attributable to manufacturing and purchasing SAF, technological developments, and development, testing and introduction of zero emission aircraft, for example, are expected to be incurred by the UK Government and private sector throughout the CCP period.
The CCC’s balanced pathway accounted for SAF deployment, technological advancements, production of low and zero-emission aircraft and engineered removals of residual emissions generated by aeroplanes. Additional capital and operating expenditure associated with the balanced pathway for the aviation sector in Scotland was estimated to be more than £3.5 billion between 2025 and 2045, and although some of the assumptions underpinning the Scottish Government’s pathway differs to that of the CCC, it provides a sense of the costs involved in decarbonising the sector.
Benefit Summary
Potential monetised benefits as a result of measures taken to decarbonise the aviation industry mainly arise in the form of carbon emission reductions, alongside potential job creation and contributions to economic growth. Again, these impacts are not attributable to the Scottish Government policies.
Dependencies
This pathway is dependent on:
- SAF production and uptake levels: uncertainties related to the production, supply and cost of SAF could impact uptake levels. Lower uptake could result in fewer emission savings from aviation,
- Technological developments: slower deployment of low and zero-emission aircraft may result in unplanned domestic aviation emission output, and
- passenger demand at Scottish airports: the CCC assumed part of the costs of decarbonising the aviation sector would be passed on to consumers by way of increased air fares which would in-turn lead to reduced demand for air travel – however, evidence within the Jet Zero Strategy and airport expansion plans revealed by Edinburgh airport which includes new long-haul routes is at odds with this assumption.
Technical Uncertainty
Emission reduction potential generated by SAF depends on the production method and feedstock used in the wider fuel composition; this is because the lifecycle GHG emission reduction varies by SAF type.
Technological advancements that generate emission savings from jet fuelled aircraft and deployment of low and zero-emission aircraft rely on continued research and development investment, particularly within the private sector. The success of these investments in unearthing new technologies may accelerate or slow down emission savings from the sector.
Delivery
Delivery is contingent on the success of UK and International policies as well as action by the private sector. The Scottish Government will continue to engage with partners and the wider sector to support its decarbonisation efforts.
Shipping
Transport Package 5 – Measures to Decarbonise Shipping
| MtCO2e | 2026-30 | 2031-35 | 2036-40 |
|---|---|---|---|
| Emissions reductions | 0.0 | 0.0 | 0.0 |
The emissions pathway for shipping is dominated by structural changes in freight demand rather than domestic policy intervention. Baseline emissions fall chiefly due to expected reductions in bulk fuel shipping linked to declining North Sea oil and gas activity projections domestically as a result of the maturity of the basin and falling demand for imported oil and oil products. Historical data show a strong correlation between seaborne freight tonnage and emissions, with fuel‑related freight representing a major share of total Scottish shipping volumes.
Baseline
As with all baseline pathways the initial starting point is the GHG inventory[310] which gives the emissions levels in 2023 for Shipping as 1.9 MtCO2e. Shipping emissions in Scotland arise primarily from goods shipping, with fishing vessels forming the next most significant category. Ferries are accounted for as part of Goods shipping accounting for around 0.1 MtCO2e per year.
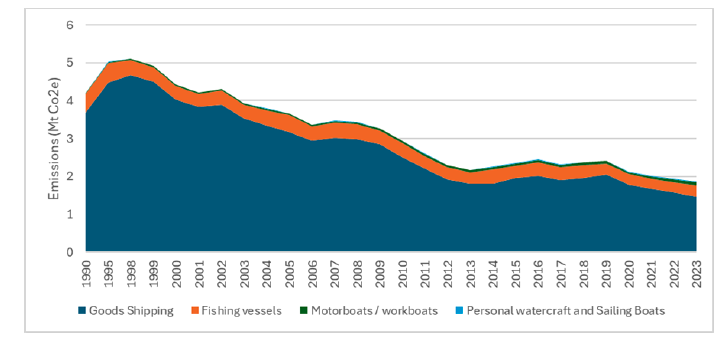
Goods shipping emissions correlate closely with freight tonnage, including fuel‑related bulk movements. Historical freight traffic peaked in 2000 at around 130 million tonnes but has since declined to approximately 55 million tonnes.[311] Most of this decline is due to the decline in oil and gas extraction as a result of the maturity of the basin.
Other forms of freight shipping have remain constant as reported by Transport Scotland’s water freight stats and is not expected to see any structural changes in the next 20 years at this point.[312]
Other forms of shipping emissions such as fishing vessel emissions have declined over a number of years, which is assumed to be due to: improvements in vessel efficiency, changes in fishery patterns, and broader economic shifts. This decline is projected forward in the baseline in a linear fashion. Motorboats, workboats, and personal watercraft remain comparatively small contributors and are assumed to remain broadly stable.
Analytical Methodology
Modelling of goods shipping emissions uses historical relationships between freight tonnage and emissions intensity.
Scotland both exports the majority of its crude oil and imports the majority of the oil it subsequently refined and additional refined oil products it consumed, which will continue with the closure of Grangemouth refinery. Both of these activities drive shipping demand.
Using the emissions pathways estimated across Transport, Residential and Public Buildings, Business and Industrial process, and energy supply it is possible to scale the level of fuel imports demanded in line with the expected decarbonisation pathways of these sectors.
Modelling exported fuel is based on independent assessments of production commissioned by the Scottish Government which provides a basis for projecting long term demand trends of Scottish Shipping.[313]
Taking the level of demand and the level of oil and gas production together provides a metric of the required bulk fuel freight. Given the identified relationship between freight tonnage and emissions intensity it is then possible to project forward the expected Shipping emissions pathway as a result of the market response to wider economic shifts.
Adding onto this the linear trend used for fishing vessels and other watercraft provides the final estimate of the Shipping baseline.
Financial Impact Summary
| 2025 £millions | 2026-2030 | 2031-2035 | 2036-2040 |
|---|---|---|---|
| Benefits | 0 | 0 | 0 |
| Net CCP costs | 2 | 0 | 0 |
There are no direct additional financial costs or benefits associated with the shipping pathway through the CCP. Activity to upgrade publicly owned vessels and ports will incur costs during the plan period, however, these investments relate to business-as-usual upgrades to maintain and replace existing assets with cleaner technology where relevant, and so their costs and impacts are not considered to be related to the delivery of the CCP.
Cost Summary
The shipping policies above are not expected to incur additional costs for the delivery of the CCP. While there will be costs associated with some Scottish Government actions relating to shipping, such as replacement of publicly owned vessels, these costs are planned to occur anyway in the course of maintaining and upgrading the ferry fleet. Therefore, these costs are not considered to be part of the CCP delivery.
Benefit Summary
There are expected to be limited benefits directly relating to the decarbonisation of Shipping as a result of Scottish Government policies. Instead there may be some wider benefits to the industry in response to international regulations that monitor vessel carbon intensity and energy output during voyages. Scottish Businesses involved in the implementation of these interventions may benefit from the regulations. These impacts do not come directly as a result of Scottish Government action in this area.
Dependencies
The pathway of our estimates are dependent on:
- Oil and gas production levels: large volumes of freight relate to fuel exports; higher than expected production could result in slower than projected emissions decline – however, the North Sea has seen long term decline which means it is unlikely to see a reversal of production,
- domestic demand for fossil fuels: slower electrification or heat decarbonisation could sustain higher freight volumes – however, the estimates used are the current best estimates and changes are actively monitored,
- the implementation of IMO carbon pricing: improvements and deployment of novel ship technologies could result in faster decarbonisation of both bulk fuel and other types of freight promoting more decarbonisation, and
- Fuel Pricing: fuel prices have complex relationships to both supply and demand and so any changes are uncertain but a significant impact as a result of fuel prices is unlikely.
Each of these factors have been considered as part of the estimation of the shipping pathway.
Technical Uncertainty
There are a number of different projections of oil and gas production levels with more recent statistics showing faster than expected declines relative to previous projections prepared for the Scottish Government as referenced above. While we have held with the published projections it is possible that there may be faster decarbonisation than anticipated.
The emissions from ship technologies are also difficult to predict given the international dimension. It is possible, given IMO projections that the emissions per vessel might reduce based on new technologies that are not factored into the pathway estimates shown here.
Delivery
Delivery considerations focus on enabling conditions rather than CCP‑specific programmes. The Scottish Government continues to monitor IMO regulatory developments, assess port requirements for novel technologies, and engage with industry to support readiness for future decarbonisation measures.
Waste Management
Summary
Summary of Waste Pathway
GHG emissions from the Waste Management sector are forecast to decline by around 57% between 2025 and 2040, driven by reductions in methane emissions from landfill, reflecting reductions in the landfilling of biodegradable waste. The pathway (based on implementation of all relevant CCP policies and proposals) is shown in the table below. It includes a comparison with a baseline, which assumes that the levels of waste – in particular waste to landfill – remain at the 2023 level, the last year for which all relevant data is available.
The Waste Management sector only directly accounts for around 4% of total Scottish greenhouse gas emissions as reported through the CCP. It should be noted that the Waste Management sector, as defined in the CCP, relates only to direct emissions (within Scotland) and, therefore, does not include “upstream” emission savings from waste and circular economy policies and proposals – for example, where an increase in recycling avoids the need for emissions relating to the extraction of raw materials; or increasing the lifetime of a product avoids emissions relating to producing new products. In addition, the Waste Management sector does not include emissions relating to Energy from Waste (EfW) from incineration, which are included under the Energy Supply sector.
The pathway for the final CCP has been updated since the draft CCP was published in November 2025 to account for the temporary enforcement approach that the Scottish Environment Protection Agency (SEPA) is taking regarding enforcement of the ban on the landfilling of biodegradable municipal waste (BMW) in Scotland. This builds upon the initial sensitivity analysis noted in the draft CCP’s analytical annex. More on this is outlined below under ‘Landfill’.
| MtCO2e | 2026-2030 | 2031-2035 | 2036-2040 |
|---|---|---|---|
| Waste Management sector emissions pathway | 6.1 | 4.4 | 3.4 |
| Waste Management baseline emissions | 6.4 | 5.2 | 4.5 |
| Waste Management total policy reductions | 0.3 | 0.7 | 1.0 |
Summary of Emissions Sources
Landfill emissions are the primary source of Waste Management emissions as well as the primary driver of emissions reductions resulting largely from historic reductions in landfilling of biodegradable waste. Composting/Anaerobic Digestion and Sewage/Waste Water Treatment are secondary sources of emissions, which are not expected to see significant reductions.
| MtCO2e | 2026-2030 | 2031-2035 | 2036-2040 |
|---|---|---|---|
| Landfill | 4.4 | 2.7 | 1.7 |
| Compost/Anaerobic Digestion | 0.7 | 0.7 | 0.7 |
| Sewage and Water Treatment | 1.0 | 1.0 | 1.0 |
| Other | 0.0 | 0.0 | 0.0 |
| Total | 6.1 | 4.4 | 3.4 |
Note: Totals may not sum due to rounding
Summary of Costs and Benefits
| £million | 2026-2030 | 2031-2035 | 2036-2040 |
|---|---|---|---|
| Benefits | 1,315 | 1,549 | 236 |
| Net CCP costs | -95 | -403 | -137 |
Note: negative Net CCP cost figures indicate that the estimated benefits exceed the costs.
The section below on costs and benefits has more detail on our approach.
Baseline
Waste Baseline Emissions
| MtCO2e | 2023 (actual) | 2026-2030 | 2031-2035 | 2036-2040 |
|---|---|---|---|---|
| Baseline emissions | 1.7 | 6.4 | 5.2 | 4.5 |
Baseline emissions follow a downward trajectory compared to 2023, as illustrated in the table above, principally due to the time lag in realising the emissions benefits of reducing landfill of biodegradable waste in earlier years.
Analytical Methodology for Baseline
The baseline is intended to show projected emissions if CCP policies and proposals were not implemented. However, it is difficult to determine a baseline for the Waste Management sector based on the implementation of specific policies or proposals due to:
- Interactions between policies/proposals,
- The time lag between landfilling waste and generating methane in landfill (the largest source of emissions in the sector), and
- The fact that key policies can start having an impact before they are formally introduced (for example, the BMW landfill ban has already influenced treatment and disposal routes for municipal waste since the Scottish Government legislated for the ban in 2012).
For this reason, a simple baseline has been chosen where the amount of waste going to different treatment routes (landfill; composting/anaerobic digestion; etc) is assumed to stay constant at the 2023 level, the last year for which all relevant data is available, and no further policies or proposals are introduced to reduce emissions from the sector.
Policy Assessment
For the reasons mentioned in the baseline section above, it was not possible to identify emission savings for each individual policy/proposal and sum those emission savings to get overall emission savings for the sector. Instead an approach was taken where projections of the tonnages of different waste types going to different treatment routes (landfill; composting/AD; etc) were modelled based on broad assumptions around reductions in waste (15% reduction in waste from all sources compared to 2011), improvements in recycling (66% recycling rate of waste from all sources from 2025) and, most importantly in terms of emissions, the implementation of the BMW landfill ban (with zero BMW landfilled from 2028 onwards), whilst maintaining landfill methane collection efficiency.
| MtCO2e | 2026-2030 | 2031-2035 | 2036-2040 |
|---|---|---|---|
| Waste Management | 0.3 | 0.7 | 1.0 |
Landfill
Key policies and proposals include:
- Introducing a ban on BMW going to landfill,
- Reviewing and targeting materials currently landfilled to identify and drive alternative management routes, including the potential to extend the BMW landfill ban to include biodegradable non-municipal wastes, and
- Increasing the capture of landfill gas.
Many other policies and proposals included in the waste chapter of the CCP are not directly related to landfill but act to reduce waste or move waste further up the waste hierarchy (e.g. by increasing reuse/recycling), hence, indirectly influence landfill reductions. These policies and proposals are grouped through the following package outcomes:
- Outcome 1 – Strengthen Scotland’s Circular Economy
- Outcome 2 – Reduce and Reuse
- Outcome 3 – Modernise Recycling
- Outcome 4 – Decarbonise Disposal
As shown in Table 29, the largest source of GHG emissions in the Waste Management sector comes from landfill, and reductions in these emissions drive overall reductions in the sector. The other emissions sources in the sector total less than 0.4 MtCO2e per year, and are projected to remain relatively stable. However, the CCP does outline areas for further review to address emissions from these sources, and future projections will reflect any updated evidence.
Annual GHG emissions from landfill sites have reduced markedly in recent years, from 5.73 MtCO2e in 2000 to 1.33 MtCO2e in 2023, and are projected to fall to less than 0.3 MtCO2e in 2040. Landfill emissions are due to the generation (and subsequent emission) of methane within landfill sites as biodegradable waste decomposes. As well as reducing the amount of biodegradable waste landfilled, efficient landfill methane collection is another factor that reduces the amount of methane ultimately emitted to the air.
Landfill emissions were estimated by first forecasting the tonnages of different waste types that will be landfilled in future years, then applying the methods used in the National Atmospheric Emissions Inventory to determine the resultant emissions. Results were broadly in line with previous analysis undertaken by Ricardo-AEA[314] for the Scottish Government which showed a clear drop in emissions driven by reductions in the landfilling of biodegradable waste. Policies/proposals can contribute by reducing the amount of waste generated, increasing recycling, diverting biodegradable waste from landfill or more efficiently capturing landfill gas generated within landfill sites.
A key policy for reducing emissions from landfill is the BMW landfill ban, which came into force on 31 December 2025. Since legislating for the ban over a decade ago, this policy has significantly reduced the amount of biodegradable waste landfilled and hence further reduced landfill emissions, and is projected to continue this downward trend. It is worth noting that, after waste has been landfilled, it takes time to decompose and hence methane is generated and emitted over a period of many years. For example, it is estimated that around a third of the methane generated from landfilling biodegradable waste is generated ten years or more after the waste was originally landfilled. Therefore, landfill emissions continue to reduce as a result of significant reductions in landfilled biodegradable waste in previous years, and the benefits of the BMW landfill ban will be realised over an extended period.
It should be noted that, shortly before publication of the draft CCP, SEPA, as Scotland’s independent environmental regulator, set out its enforcement approach to the ban on BMW going to landfill via a Temporary Regulatory Position Statement (published on 29 October 2025). As a result, relatively small amounts of BMW are expected to be landfilled in 2026 and 2027 before the temporary regulatory position on the ban expires after 31 December 2027. There was insufficient time to incorporate updates to landfill emission projections before the draft plan was published but, at the time, the draft CCP noted that sensitivity analysis had been conducted based on available evidence, and this had indicated that the likely impact would be small. The final CCP has taken into account that relatively small amounts of BMW are expected to be landfilled in 2026 and 2027, based on advice from SEPA. As a result, landfill emissions increase from a total of 4.2 MtCO2e to 4.4 MtCO2e in the first carbon budget period (2026-2030) and from 2.6 MtCO2e to 2.7 MtCO2e in the second carbon budget period (2031-2035). Given that the sector is relatively small (approximately 4% of total CCP emissions) and the vast majority of BMW already has alternative treatment solutions in place, the projected impact on overall CCP emissions remains minimal.
In summary, much of the reduction in landfilling of BMW has already taken place ahead of the ban coming into force, and the time lag for waste to decompose and then generate methane over a period of years (discussed above) has a smoothing effect on the overall trend. This means that a steady reduction rather than a drastic step change in emissions is expected as a result of the ban. The figures above are estimate projections, and actual emissions will be influenced by implementation of the policy as we continue to support ongoing compliance with the ban. Further updates to forecasting will be made if deemed appropriate based on available evidence.
Technical Uncertainties
The modelling assumes a reduction in BMW landfilled due to implementation of the BMW landfill ban, and also assumes landfill methane collection efficiency is maintained. Some uncertainty exists around the level of BMW that will be landfilled, particularly during the period up to 31 December 2027 before SEPA’s Temporary Regulatory Position Statement on enforcement approach for the ban expires, and the level of methane collection efficiency, an important element of emission reduction, that will be achieved as the overall level of methane generated within landfill sites reduces over time.
Dependencies
Landfill emissions will depend to some extent on the overall level of waste generated, which will be influenced by various factors (e.g. population, economy, behaviours, the range of waste reduction and circular economy policies) and, in particular, the routes followed by different waste types (e.g. recycling, landfill, incineration). Diversion of BMW from landfill will be a key factor in achieving the projected emission reductions.
Delivery
Central to delivery of landfill emission reductions will be full implementation of the BMW ban after 31 December 2027. Supporting factors will include policies set out in the waste chapter of the CCP to reduce waste and increase reuse/recycling, and work to maintain or increase landfill methane collection efficiency. We will continue to carefully monitor delivery of policies, working with partners through our Circular Economy and Resources Programme to provide strategic oversight on implementation.
Cost and Benefits Summary
The actions described in the Waste Management chapter of the CCP have benefits in terms of direct emissions reductions in the Waste Management sector in Scotland, principally reductions in landfill emissions, but there are also wider benefits. These include reductions in “upstream” emissions (for example, the emissions related to the production of goods and reduced demand for raw materials). This may create economic opportunities to maximise higher value return from material reprocessing, keeping these materials in use for longer. This should reduce the negative environmental impacts of waste entering the terrestrial and marine environments. There are also likely to be economic benefits in terms of job creation, skills development, and retraining.
Many of the waste chapter’s actions are included in Scotland’s Circular Economy and Waste Route Map to 2030 and are at different stages of design and implementation. A business and regulatory impact assessment outlining information on costs and benefits for these actions was published alongside the Route Map. In addition, separate assessments for some measures have already been undertaken.[315]
Costs beyond 2030 are currently uncertain for the majority of policies/proposals under the waste package and are heavily dependent on implementation of measures up to 2030. The summary table below includes benefits and net costs for the package where available. Cost and benefit estimates for the Deposit Return Scheme (DRS) and Packaging EPR (pEPR) are included as they are more developed policies with quantified, published estimates. Otherwise budgeted costs are only available for carbon budget 1 (2026-2030) for policies that are in varying stages of development. It is important to note that these financial estimates may change as measures are further developed in collaboration with different stakeholders and will be subject to outcomes of future spending allocations.
| 2025 £million | 2026-2030 | 2031-2035 | 2036-2040 |
|---|---|---|---|
| Benefits | 1,315 | 1,549 | 236 |
| Net CCP costs | -95 | -403 | -137 |
Note: negative Net CCP cost figures indicate that the estimated benefits exceed the costs.
Quantified benefits are not currently feasible across all policies/proposals. Many of the actions are still under development and, therefore, do not have quantitative data on benefits at this time. For example, in the case of a new circular economy strategy and targets, as set out below, they can provide clear goals and certainty necessary for long-term planning. This may be beneficial to businesses, the third sector and public bodies, through offering regulatory certainty, and reducing risk associated with the necessary shift to circular economy practices. This may incentivise further investment in circular economy infrastructure and innovation.
Costs and Benefits Analytical Approach
Cost information for the Scottish Government is based on estimated resource and capital costs for the waste and circular economy measures for the first carbon budget. Further cost and benefit information is drawn from impact assessments for more developed policies including DRS and Packaging EPR (pEPR). Note that estimates for pEPR are based on Net Present Value (NPV) proportional to Scotland based on population share of the UK. As previously noted, many of the actions are still under development and, therefore, do not have quantitative data at this time.
The costs and benefits of measures in the waste package are inextricably linked and should not be considered in isolation from one another. For example, extended producer responsibility schemes will have an impact on how household recycling measures are taken forward, as well as the composition and volume of waste that then needs to be managed.
Further detail on costs and benefits is summarised below by the four strategic areas: Strengthening Scotland’s Circular Economy, Reduce and Reuse, Modernise Recycling and Decarbonise Disposal.
Waste Policy Outcome 1 – Strengthening Scotland’s circular economy
Costs
Measures in this section include the development of statutory circular economy targets and a circular economy strategy. Associated public sector costs largely cover business-as-usual activities such as running consultations and engaging with stakeholders. Quantified costs for individuals, businesses and local authorities are not currently available, as they will be subject to the development of specific measures and the shape of the final circular economy strategy. Previous impact assessments have highlighted where potential costs for measures under this strategic outcome might develop.[316] While the introduction of a new circular economy strategy and targets is intended to benefit individuals, the public and private sector, there is a possibility of costs to align with any new requirements, as well as the risk of unintended negative consequences.[317]
Benefits
Quantified benefits are not currently feasible for measures under this strategic outcome. In the case of a new circular economy strategy and targets, they can provide clear goals and certainty necessary for long-term planning. This may be beneficial to businesses, the third sector and public bodies, through offering regulatory certainty, and reducing risk associated with the necessary shift to circular economy practices. This may incentivise further investment in circular economy infrastructure and innovation. For example, research from PwC highlighted that adopting circular business practices in the construction, textiles, packaging and electronics industry alone could deliver an estimated 0.2-0.4% boost to UK productivity and 150-170,000 new jobs.[318] The Green Alliance suggest that a more circular economy could create 470,000 jobs and add £25 billion to UK GDP by 2035.[319]
Waste Policy Outcome 2 – Reduce and reuse
Costs
Measures under this strategic outcome cover a wide range of policy areas, from producer responsibility schemes to tackle the environmental impact of products; actions to tackle food waste; and embedding circular practices in the construction sector. These actions are at different stages of development. Further detail on costs are set out in the relevant assessments undertaken for individual measures to date, including for packaging extended producer responsibility and the Deposit Return Scheme.
Benefits
As outlined in the CCP, there are significant economic and environmental benefits to the shift to more sustainable resource use, and there will be very significant cost to employers and society as a whole if we do not take forward the actions in this CCP. For example:
- Mandatory reporting of food waste can generate benefits for businesses by supporting a more efficient business model that reduces waste within an organisation, leading to reduced costs,[320]
- Packaging EPR – includes quantified transfer of costs for the collection, sorting, treatment, and disposal of household packaging waste to producers from the public sector[321] – benefits to producers from collection cost savings and reprocessors from the secondary material market are also quantified, and
- DRS – includes quantified benefits from reduction in material to be collected at the kerbside or public litter bins, and by the reduced littering (note some of the benefits are for the System Administrator of the scheme[322]).
Waste Policy Outcome 3 – Modernise recycling
Costs
There are likely to be costs associated with the package of recycling measures outlined in the CCP, as we seek to work with partners to modernise household and commercial recycling. Estimated costs to government across the first carbon budget period include the final investments from the Recycling Improvement Fund, alongside initial projections for requirements to deliver policies up to 2030, such as implementation of the new statutory Code of Practice for household waste services.
Some indirect costs may be expected to households as a result of the new Code of Practice, such as the need to adapt to any new kerbside waste and recycling collections. For local authorities, additional resource costs may be associated with the implementation of any new services or infrastructure funded by the Recycling Improvement Fund or as a result of the new Code. Subject to the outcomes of co-design and final shape of the new Code of Practice, local authorities may also need to make one-off capital investments such as bins, vehicles and storage facilities. There are currently no total quantified costs for businesses as a result of policies in this area, but previous assessments have identified some areas where costs may occur. For example, there may be higher expected costs to producers as a result of the policy for recyclable plastic film and flexible packaging to be collected. These costs are not quantified for Scotland but are set out in the UK level pEPR impact assessment.[323] Costs for many other measures will be subject to outcomes from co-design and actions to build better understand the current commercial recycling landscape.
Benefits
Increasing the amount of materials recycled and increasing the proportion of these recycled in Scotland will deliver carbon reductions, reduce the environmental impacts associated with extracting new raw materials and create a range of important economic opportunities to reprocess and reuse materials in Scotland. It is not possible to quantify benefits for many measures at this stage, pending outcomes from design activity, such as the co-design of a new statutory Code of Practice for household waste and recycling services. However, as an example, the combination of measures to support business and commercial organisations to recycle more is likely to have positive economic benefits. For example, businesses that recycle are likely to avoid higher waste disposal costs.
Landfill Tax in Scotland is substantial, with rates increasing annually. The standard rate of Landfill Tax is applied to waste sent to landfill, and businesses can save money by recycling more, as landfill charges are generally higher than recycling fees. For the public sector, the new statutory Code of Practice for household waste services presents opportunities to maximise the value of collected recyclate for local authorities. Increased and more reliable supply of quality recyclate will support investment in domestic processing capacity, and may help drive greater revenue for local authorities.
Waste Policy Outcome 4 – Decarbonise disposal
Costs
This package consists of a collection of measures to reduce emissions at the point of disposal, including the ban on BMW going to landfill, and steps to increase the capture of landfill gas. Further information on costs is set out in the CCP and Route Map BRIAs, and relevant assessments undertaken for individual measures to date.[324]
As well as direct costs to government to deliver measures such as the residual waste plan, the continued reduction in landfilled waste in Scotland means that Scottish Landfill Tax (SLfT) revenue is declining.[325] This long-term trend of decreasing SLfT revenues reflects the success of efforts to encourage diversion of waste from landfill, driven by the SLfT and the introduction of the ban on the landfilling of BMW. Costs for the private sector associated with measures such as the residual waste plan and landfill gas capture are outlined in the Route Map BRIA. Over time reducing biodegradable waste will reduce the landfill gas available for capturing and use, reducing a potential revenue stream for landfill operators. There is also a strategic link between waste sector measures and measures in the Energy Supply chapter to address emissions from EfW. Analysis has been undertaken regarding the impact of the potential inclusion of EfW within the Emissions Trading Scheme (ETS) and the potentially transformative economic effects of its implementation. Provisional analysis suggests proportionally higher costs for Scotland given waste redirected to incineration from landfill.[326]
Benefits
While our focus is firmly on cutting waste, we want to ensure that materials that cannot be avoided, reused, or recycled are managed in a way that minimises environmental and climate impacts, encourages management of materials further up the waste hierarchy, and minimises broader societal impacts. Measures in this section will help drive this by delivering wider benefits, including helping us understand the best environmental outcomes for specific wastes, ensuring there is an appropriate capacity and investment to manage waste in Scotland, and driving greater innovation and new technologies to deliver improved environmental outcomes. For example, the introduction of ban on BMW going to landfill encourages greater focus on waste reduction, reuse, repair and recycling, as well as the use of composting, anaerobic digestion, and energy-from-waste (EfW) technologies, extracting value from materials that would otherwise go to landfill. Maximising opportunities for landfill gas capture helps mitigate the negative effects of landfill and the environmental impact of closed landfill sites. Previous investment in landfill gas capture at four existing sites has led to estimated combined contributions to economic welfare (for the period between 2015-2047 and measured by NPV) of between £12-39 million. Note that this is not included in the quantified benefits for this CCP package as it refers to previous investment at selected sites.
This indicates that investment in additional gas capture could yield further economic benefits, and further assessment may be required, subject to the scope and nature of future work.
Energy Supply
Summary
Summary of Energy Supply Pathway
The Energy Supply sector is projected to decarbonise by around 85% between 2025 and 2040, primarily as a result of the decline in demand for fossil fuels reducing emissions from the fuel supply subsector and from carbon capture technology being utilised at Peterhead power station.
This sector also includes emissions reductions associated with decarbonisation of Non-Road Mobile Machinery (NRMM) over and above those specified separately elsewhere. NRMM emissions arise across a number of sectors, but due to the nascent proposal and consequent uncertainty around the exact composition of any changes arising from the proposal, it is placed into Energy Supply but cuts across several sectors.
The table below shows the expected emissions from the sector as it follows the CCP pathway.
| MtCO2e | 2026-2030 | 2031-2035 | 2036-2040 |
|---|---|---|---|
| Energy Supply sector emissions pathway* | 9.9 | 2.3 | 0.0 |
| Energy Supply baseline emissions | 9.9 | 4.8 | 4.4 |
| Energy Supply total policy reductions | 0.0 | 2.5 | 4.4 |
*Energy supply including NRMM reductions, without NRMM reductions Energy supply emissions are 9.9, 3.4 and 2.6 Mt respectively. NRMM reductions are correct when aggregated across the whole plan.
Summary of Emissions Sources
The sector pathway is broken down into its constituent sources in the table below. The sector covers two broad elements. The first is electricity generation and power stations, where emissions arise from three main sources: Peterhead gas-fired power station, EfW sites and island diesel generators. The second covers oil and gas supply emissions as a result of refining of crude oil into petroleum, the operation of terminals to manage the import and onshoring of oil and gas, leakage of gas from pipelines and emissions associated with the onshore production of oil and gas. As noted above, emissions reductions associated with the proposed stretch goals for NRMM are included here although the emissions occur in the Agriculture, Business and Industrial Process and Transport sectors. This is due to the current nascent state of policy development which makes a more precise allocation difficult.
| MtCO2e | 2026-2030 | 2031-2035 | 2036-2040 |
|---|---|---|---|
| Oil and Gas Supply | 4.7 | 0.9 | 0.8 |
| Electricity Supply | 5.1 | 2.5 | 1.9 |
| NRMM | 0.0 | -1.1 | -2.6 |
| Total | 9.9 | 2.3 | -0.0 |
Note: Totals may not sum due to rounding
Summary of Costs and Benefits
An assessment of the costs and benefits arising from the policies to be brought forward as part of this CCP to decarbonise energy supply has been undertaken. The summary of impacts is that:
| 2025 £millions | 2026-2030 | 2031-2035 | 2036-2040 |
|---|---|---|---|
| Benefits | 0 | 0 | 0 |
| Net CCP costs | 0 | 0 | 0 |
There are no specific costs to government from energy supply policies, and all emissions reductions are expected to be market driven or influenced by policies in other sectors across this plan. However, the energy supply sector is expected to see significant investment over the period of the CCP in areas such as transmission networks, renewable energy generation, flexible demand, storage and carbon capture.
Baseline
Energy Supply Baseline Emissions
Projected baseline emissions for the sector are shown in the table below:
| MtCO2e | 2026-2030 | 2031-2035 | 2036-2040 |
|---|---|---|---|
| Baseline emissions | 9.9 | 4.7 | 4.2 |
Oil and Gas Supply
Oil and Gas Supply emissions in Scotland are the result of: i) refining of Crude Oil into petroleum products (the largest source of such emissions in 2023); ii) the operation of terminals to manage the import and onshoring of Oil and Gas; iii) leakage of gas from pipelines; and iv) emissions associated with the onshore production of Oil and Gas.
| MtCO2e | 2026-2030 | 2031-2035 | 2036-2040 |
|---|---|---|---|
| Baseline emissions | 4.7 | 0.9 | 0.8 |
Emissions associated with Oil and Gas Supply will continue to decline over the period of the CCP, as demand for these products falls through the decarbonisation of the wider economy along with the decline in production of Oil and Gas in Scotland.
Activity in the Oil and Gas Supply sector is expected to decline as a result of:
- Ceasing refining of crude oil and falling imports as a result of declining domestic demand for petroleum products and gas as major sectors such as transport, buildings, power stations, and industry decarbonise as detailed in this plan. In particular, the closure of the Grangemouth refinery in 2025, which was the only oil refinery in Scotland, will mean any residual demand is met by import of finished fuel products.
- North Sea oil and gas production will decline as a result of the maturity of the basin – this trend will lower exports volumes of Oil and Gas. This is expected to fall in line with the estimates produced for the Just Transition Review of the Scottish Energy Sector.[327]
The emissions levels for Oil and Gas supply are estimated based on the expected volumes of production, import and export in line with the declining fossil fuel activity projections relative to 2023 levels.
There are no emissions reduction policies directed towards the Oil and Gas Supply sector, and emissions reduction is expected to be market driven.
As such there is expected to be no emissions reductions or financial impact as a result of Scottish Government Policy in what is a reserved policy area.
Electricity Supply
Electricity supply emissions have reduced from 14.7 MtCO2e in 1990 to just under 1 MtCO2e in 2023 (93.4% reduction). Overall emissions reductions in this sector are mainly due to complete cessation of coal use for electricity generation in Scotland, and a reduction in generation from fossil fuels more generally.
The main sources of the remaining existing emissions from the electricity sector are from Peterhead Power Station, EfW, Islands generators and Other Fuel.
| MtCO2e | 2026-2030 | 2031-2035 | 2036-2040 |
|---|---|---|---|
| Baseline emissions | 5.1 | 3.8 | 3.5 |
Electricity Supply emissions are projected to decline between 2026 and 2040, due primarily to: i) Peterhead Power Station being replaced by Peterhead 2 CCGT in 2032; and ii) some EfW sites installing carbon capture and storage technology once the Scottish CCUS Cluster is online, by 2032. In the short term, EfW emissions could rise as further waste is diverted from landfill (largely as a result of the ban on the landfilling of BMW), before this decline.
- Peterhead power station, as Scotland’s last remaining fossil fuel power plant, has a large bearing on Scotland’s electricity supply emissions. A closing date has not been set for the current Peterhead power station, however, the plant is coming to the end of its operational lifetime, and it is assumed that the plant will continue to emit at 2024 levels from ETS emissions data until it ceases operating from 2032.
- Peterhead Carbon Capture Power Station (Peterhead 2) is assumed to come online to replace the current Peterhead power station in 2032, when the Acorn T&S Project could be deployed, with an assumed 90% carbon capture rate and the plant operates for up to c. 8,000 hours per year at 100% full load, which is the reference case scenario for the power station by SSE.[328] This is subject to a decision by Scottish Ministers on an application under S.36 Electricity Act 1989 for construction of the new power station and carbon capture facilities.
- Forecast household waste incineration has been used as a proxy to provide a reasonable estimate for projecting future EfW emissions. For the draft CCP, previous modelling assumed that the BMW landfill ban was fully enforced from 31 December 2025. Under this previous scenario, EfW emissions were projected to hit a maximum level in 2026. Shortly before publication of the draft CCP, SEPA, as Scotland’s independent environmental regulator, set out its enforcement approach to the ban on BMW going to landfill via a Temporary Regulatory Position Statement. The final CCP has taken into account that relatively small amounts of BMW are expected to be landfilled in 2026 and 2027, based on advice from SEPA, before the temporary regulatory position statement expires after 31 December 2027. As a result, emissions from EfW are now expected to be lower in 2026 and 2027, and peak in 2028. It is assumed that 45% of EfW sites (by emissions) install CCS by 2032, a 90% capture rate, and that 50% of emissions are from biogenic sources, leading to a share of negative emissions. It also ignores potential new sites coming online as the timing and scale of these is unknown. The percentage of EfW sites assumed to install CCS by 2032 was developed by considering the proximity of EfW sites to the potential Acorn pipeline in 2032.
- Fossil-fuel generators on islands are another source of emissions for the electricity sector in Scotland. They are commonly used for back-up supply. It is assumed that as grid infrastructure is reinforced, back-up generators will be utilised half as frequently from 2026 onwards.
- Other Fuel is the remaining very small portion of electricity supply emissions (0.02 MtCO2e) and this is assumed to remain constant.
Policy Assessment
Energy Supply Package 1 – Energy From Waste
There are no specific costs for electricity sector policies as these are largely around a reserved area of policy and are anticipated to be industry led; while costs for waste sector policies, that will influence EfW emissions, are outlined in the waste sections of this annex.
One area within the EfW package with cost implications is the Scottish Government’s role as part of the UK ETS Authority, which is currently exploring expanding ETS to include EfW.[329] It is anticipated that cost exposure would introduce stronger incentives for EfW facilities to adopt CCS. There is, therefore, clear interaction between the ETS, EfW and the resulting energy envelope. Because the inclusion of EfW in ETS remains subject to discussion within the ETS Authority, the four relevant measures are defined as proposals and cost estimates are not provided here.
Key Policies
- Support the inclusion of EfW in the UK ETS
- Require new EfW facilities to have an acceptable decarbonisation strategy aligned with Scottish Government decarbonisation goals
- Encourage existing EfW plants to CCS, working with the UK Government to develop a policy and funding framework to incentivise this
- Incentivise advanced sorting and separating technologies for residual waste (e.g. to separate key recyclable material streams before incineration) where feasible, to be explored through the 2045 residual waste plan, and sector-led plan for EfW decarbonisation, as part of wider efforts to end the unnecessary incineration of plastics
| MtCO2e | 2026-2030 | 2031-2035 | 2036-2040 |
|---|---|---|---|
| Emissions reductions | 0.0 | 1.3 | 1.6 |
Technical Uncertainties
- Forecast household waste incineration have been used as a proxy to provide a reasonable estimate for projecting future EfW emissions. While household waste incineration figures capture a significant portion of waste being incinerated and broadly follow similar trends to EfW emissions, factors such as changes to the composition of waste incinerated and changes to the proportion of commercial/industrial waste incinerated could result in diverging EfW emissions compared to the proxy forecast.
Dependencies
- The UK ETS Authority has signalled its intention to expand the UK ETS to include EfW.[330] While the cost exposure date has yet to be confirmed, the Authority has signalled that this scope expansion could happen anytime from 2028. The exposure to the UK ETS carbon price could create a stronger incentive for the adoption of CCS in EfW. However, several uncertainties exist, including the relative cost of CCS technologies and the confirmed cost exposure date for EfW in the UK ETS.
- As set out above, emission projections rely on a percentage of EfW sites installing CCS technology once the Acorn T&S Project and the Scottish Cluster are online by 2032. However, it is important to note the dependency on UK Government action in this space: the fiscal, legislative and regulatory levers required to deliver CCS remain reserved to the UK Government.
Delivery
Delivery of emissions reductions will be dependent on a range of factors, including delivery of measures within the waste sector chapter that will help reduce waste and tackle high-emitting materials within residual waste, that the UK ETS is expanded to include EfW, and that the Acorn T&S Project and the Scottish Cluster is online by 2032.
Energy Supply Package 2 – Electricity supply decarbonisation
Key Policies
The following supporting policies have been assessed to have zero direct emissions impacts and zero costs:
- Work with Scottish Southern Electricity Networks (SSEN) to reduce reliance on island diesel power stations through supporting establishment of new connections between islands and mainland; and explore the use of alternative, non-fossil-fuel based solutions to diesel for back-up supply, including the use of Hydrotreated Vegetable Oil (HVO) as a transition fuel and flexibility contracts,
- We will continue to work constructively with the UK Government to ensure the Acorn Project and Scottish Cluster secure the fastest possible deployment, so that a just transition for our energy workforce can be secured, while delivering on net zero targets,
- Work to influence the UK Government (e.g. through development of its Reformed National Pricing Delivery Plan) to better design energy markets and incentives which support the building and use of both medium and long duration energy storage and grid flexibility assets (such as battery storage and pumped hydro), as well as demand side including EV smart charging and other smart appliances to use electricity during off-peak hours, helping balance the grid and reduce costs and emissions– thereby reducing the need for energy from unabated fossil fuels alongside a renewables-based power system, and
- Work with the UK Government and the National Energy Systems Operator (NESO) on the Clean Power 2030 Action Plan (CP2030) and the Strategic Spatial Energy Plan (SSEP) to represent Scotland’s interests in reducing power sector emissions. Both of these aim to decarbonise the power system across Great Britain and plan a strategic approach to its deployment.
Technical Uncertainties
- Projecting electricity emissions out to 2040 is challenging as we expect the trend to be downward at systems level due to the assumptions outlined, though with annual fluctuations in that trajectory.
- This is due to uncertainties regarding the build out rate of new capacity, the variable nature of renewable generation, and the potential need to balance that variation through fossil fuel generation.
Dependencies
- The analysis across all of the electricity policies relies on assumptions about the future operation of electricity assets, which is uncertain and hard to predict. In particular, emission projections rely on the Acorn T&S Project and the Scottish Carbon Cluster coming online by 2032 so that Peterhead 2 can become operational. The UK Government is responsible for approving Acorn, including the selection of emitter projects, and provision of a full funding package. The timing of these decisions will influence when Acorn is able to move forward to deployment. Legislative and regulatory responsibility for CCS is reserved to the UK Government, and we need them to ensure that a full framework is in place for Acorn to progress.
- With the exception of its statutory planning and consenting functions, the Scottish Government has no regulatory role in relation to strategic planning for the electricity network or network infrastructure delivery. Therefore, the reduction of emissions from island generators is out with the control of the Scottish Government. However, there are opportunities for the Scottish Government to influence the design of Great Britain’s future energy system through the SSEP, and involvement in NESO’s other strategic plans including regional and network plans. We continue to engage with network operators, Ofgem, NESO and the UK Government on all relevant policy matters relating to electricity networks. We will also work to ensure that Scotland’s aims and objectives for decarbonised energy are reflected in plans for the energy system at a GB level.
Delivery
Delivery of emissions reductions will be dependent on a range of factors, including the timing of Peterhead 2 becoming operational, the pace of network upgrades, and UK Government actions.
Energy Supply Package 3 – Non-road mobile machine decarbonisation
NRMM are a cross-sectoral source of emissions which range from Agricultural vehicles to Construction machinery. These sources are disparate but have similar challenges. To decarbonise these machines will require either new power trains that are low carbon like those which replaced ICE cars, more efficiency operations, or bio-fuels.
Key Policies
- Target an 80% decrease in NRMM emissions by 2040
| MtCO2e | 2026-2030 | 2031-2035 | 2036-2040 |
|---|---|---|---|
| Emissions reductions | 0.0 | 1.1 | 2.6 |
At present there are few alternatives to fossil fuels for NRMM. The Scottish Government ambition to support an 80% decarbonisation of NRMM relies on supporting the market across a range of potential mechanisms, the exact balance is still to be determined. However, it is expected that replacement of older NRMM stock with more efficient models and improvements in how NRMM are used through complementary technologies such as GPS will help drive earlier decarbonisation. Longer term decarbonisation to reach the target will be dependent on either increasing availability of biofuels for NRMM as less is required to blend into ICE road vehicles’ petrol supply, or through supporting the market as it develops effective alternative power trains.
This ambition matches the CCC’s 2040 expectations while starting later in recognition of SG’s view that there is not currently sufficient market potential to decarbonisation NRMM in line with the CCC’s pathway.
As NRMM is a cross-sectoral source of emissions which are not present in energy supply, the emissions reductions presented here represent the total potential reductions that would be allocated across Agriculture, Transport, and Business and Industrial Processes. Given the uncertainty on how this technology will develop it is not known how these will be split and so the reductions are presented in aggregate here rather than in their respective sectors.
Given the uncertainty around how this technology will come into play it is not possible to provide cost estimates for NRMM and this is treated as a proposal. Further work is being taken forward on estimating these costs.
Technical Uncertainties
The estimation of NRMM emissions reduction is based on a similar pathway as the CCC’s estimated pathway. The actual reductions, however, are highly dependent on the rates of wider decarbonisation of road fuels, the exact dates of novel technologies entering the market, the price point of alternative fuels and uptake rates of improved efficiencies in NRMM operation.
Dependencies
NRMM decarbonisation is highly dependent on the private sector development of novel technologies. NRMM is also dependent on private operators adopting new technologies or fuels on the basis of improved efficiencies.
Delivery
The Scottish Government is reviewing potential options to promote additional low carbon NRMM technologies in the 2030s.
Business and Industrial Process
Summary
Summary of the Business and Industrial Process Pathway
The Business and Industrial processes CCP envelope is projected to decarbonise by 49% when comparing the 2036-2040 carbon budget with the 2026-2030 carbon budget, primarily as a result of policies to decarbonise industry and non-domestic buildings.
| MtCO2e | 2026-2030 | 2031-2035 | 2036-2040 |
|---|---|---|---|
| Business and Industrial Processes emissions projection | 25.4 | 19.4 | 13.1 |
| Business and Industrial Processes baseline emissions | 27.1 | 24.6 | 21.6 |
| Business and Industrial Processes policy reductions | 1.6 | 5.2 | 8.5 |
Total emissions over the carbon budget period 2026-2030 is projected to be 1.6 MtCO2e lower when compared to a baseline without any Scottish Government policies. This gap is expected to widen over time with the carbon budget period 2036-2040 showing an 8.5 MtCO2e reduction when compared to the baseline.
Emissions and costs estimates for the Industry policy package have changed since the draft CCP published in November 2025 as a result of the announced closure of the Fife Ethylene Plant at Mossmorran and an update to traded carbon values used for modelling purposes, published by DESNZ in February 2026.[331]
Summary of Emissions Sources
The table above shows projected CCP emissions pathway of the Business and Industrial Process sector in each carbon budget, while the table below shows this broken down by sub-sector. Within this envelope, the largest source of emissions is industry, followed by non-domestic buildings, and then sub-categories of transport and agriculture. The area expected to see the most decarbonisation within the envelope is industry, with emissions projected to fall from 18 MtCO2e during the period 2026-2030 to 9.2 MtCO2e during the period 2036-2040. This is followed by non-domestic buildings which is projected to fall from 7.2 MtCO2e in the first carbon budget to 3.8 MtCO2e in the third carbon budget. Mobile air conditioning is expected to decarbonise in line with the pathway for F-gas emissions, which expects a decline of around 74% by 2036 when compared to 2023 levels. Agricultural combustion is projected to remain flat over each carbon budget.
| MtCO2e | 2026-2030 | 2031-2035 | 2036-2040 |
|---|---|---|---|
| Industry | 18.0 | 13.4 | 9.2 |
| Non-Domestic Buildings | 7.2 | 5.9 | 3.8 |
| Mobile Air Conditioning | 0.3 | 0.1 | 0.1 |
| Agricultural Combustion | 0.0 | 0.0 | 0.0 |
| Total | 25.4 | 19.4 | 13.1 |
Note: Totals may not sum due to rounding
Summary of Costs and Benefits
An assessment of the costs and benefits arising from the policies to be brought forward as part of this CCP to decarbonise Business and Industrial Processes has been undertaken. The summary of impacts is presented in the table below.[332]
| 2025 £million | 2026-2030 | 2031-2035 | 2036-2040 |
|---|---|---|---|
| Benefits | 41 | 41 | 41 |
| Net CCP costs | 486 | 2304 | 3113 |
Baseline
Projected baseline emissions for the sector are shown in the table below:
| MtCO2e | 2026-2030 | 2031-2035 | 2036-2040 |
|---|---|---|---|
| Baseline emissions | 27.1 | 24.6 | 21.6 |
Policy Assessment
Industry
Industry is the largest source of emissions in the Business and Industrial Processes CCP envelope. Emissions are primarily a result of industrial combustion and industrial processes. Emissions from industrial combustion come from the burning of fossil fuels to generate heat or power required for manufacturing processes. Popular fuel sources are currently natural gas, oil and biomass. Switching away from fossil fuel technologies towards electricity-based technologies, or the adoption of hydrogen or carbon capture and storage are the main pathways available for industry to decarbonise. The electrification of industry also requires energy supply to decarbonise through the adoption of carbon-neutral electricity generation.
Table 46 below presents three different scenarios for industry, compared to a baseline scenario which represents a scenario with no Scottish Government policy. In the central scenario, industry is supported by Scottish Government policy through multiple funds, as detailed below, and faces the centrally projected UK ETS carbon price.[333] This scenario coincides with the total CCP envelope decarbonisation pathway represented above. The low scenario represents a pathway where Scottish Government policy is less effective, and industry faces relatively lower UK ETS carbon prices than the central scenario. In contrast, the high scenario represents a more ambitious pathway where Scottish Government policy is more effective and industry decarbonises further in response to higher carbon prices.
| MtCO2e | 2026-2030 | 2031-2035 | 2036-2040 |
|---|---|---|---|
| Baseline | 19.6 | 18.0 | 15.2 |
| Central Scenario | 18.0 | 13.4 | 9.2 |
| High Scenario | 17.7 | 12.3 | 8.0 |
| Low Scenario | 18.2 | 14.7 | 11.6 |
Without policy action, baseline emissions in the industry sector are expected to see a steady decline across carbon budgets. At a high level, baseline industry emissions are based on projected sector GVA growth adjusted for alignment with energy and emissions projections (EEP).[334] The latest UK projected territorial emissions in the EEP suggest modest emissions reductions in the 2020s before levelling out in the late 2030s. This pathway reflects the impact of previously announced UK Government industrial decarbonisation policy as well as the movement towards electrification technologies that reduce reliance on fossil fuels. One prominent policy is the Clean Power 2030 Action Plan,[335] which has the potential to provide lower and less volatile electricity costs in the longer term, due to reducing reliance on gas which is more susceptible to global market shocks. The impact of this policy is included in the baseline, where electrification technologies become more favourable to industry compared to existing fossil fuel technologies that rely on natural gas and oil.
Given the Scottish Government’s support[336] for CCUS in Scotland and the rollout of hydrogen technologies, it is assumed that no CCUS or hydrogen technologies would be available to industry in the baseline. It is also assumed that the carbon price faced by all of industry in the baseline mirrors the voluntary carbon price.[337] This approach is taken to try to account for some internalisation of the social cost of carbon, where industry may consider some of the social cost of polluting when making investment decisions.
Key Policies
- UK ETS
- Scottish Industrial Energy Transformation Fund (SIETF) to support the decarbonisation of industrial manufacturing
- New Industrial Decarbonisation Programme
- Support for CCUS, including the Acorn T&S Project and the Scottish Cluster
- Green Hydrogen Fund
| MtCO2e | 2026-2030 | 2031-2035 | 2036-2040 |
|---|---|---|---|
| UK ETS | 0.0 | 0.0 | 0.1 |
| SIETF | 0.2 | 0.2 | 0.2 |
| New ID Programme | 1.4 | 3.4 | 3.4 |
| Acorn CCS | 0.0 | 1.0 | 2.0 |
| Green Hydrogen Fund | 0.0 | 0.1 | 0.5 |
| Total | 1.6 | 4.6 | 6.1 |
Note: Totals may not sum due to rounding
While emissions reductions are presented broken down in the table above, in reality there will be strong interactions between policies and proposals. For example, the UK ETS is expected to drive emissions reductions through a decreasing UK ETS cap and decarbonisation across UK ETS sectors. This decarbonisation is expected to be supported through other Scottish Government policies and proposals, such as SIETF, support for the Acorn T&S Project or the Green Hydrogen Fund. In the Net Zero Industry Pathways (NZIP 2.0) model, detailed below, each policy is introduced either through introducing projections of UK ETS carbon prices or by setting minimum uptakes of certain decarbonisation technologies to reflect the government support that is expected to exist for them over the next 20 years. Model results of emissions reductions are then broken down by decarbonisation technology and then attributed to each policy based on internal analysis of policy impacts, with the residual attributed to the UK ETS.
Analytical Methodology
The Net Zero Industry Pathways (NZIP 2.0) model[338] is used to project industry emissions in Scotland. This model takes data for industry installations across the UK, and models how these sites may behave up until 2050 in response to the emergence of new decarbonisation technologies. Decarbonisation technologies vary across different sectors, with certain sectors having more limited decarbonisation options than others. For example, the cement industry is expected to have fewer options in the future with CCS being the main opportunity for reaching carbon neutrality. Each installation site behaves in a cost-effective way, subject to any imposed constraints such as minimum usage of certain technologies, where in every year they decide whether to switch to alternative technologies or to continue using existing infrastructure. The list of decarbonisation options in the model is extensive, and include electrification, CCS, hydrogen, biomass and heat pump technologies.
A core component of the model which has significant implications for the relative cost of decarbonisation technologies to fossil fuel technologies is the carbon price. Installation sites in the model are split into two groups, the traded and non-traded sector, each with their own carbon price which changes over time. This is an important consideration as it makes fossil-fuel based technologies more expensive to operate relative to decarbonisation technologies.
UK ETS
The UK ETS is a jointly run policy, by the UK Government, the Scottish Government, the Welsh Government, and the Northern Ireland Department of Agriculture, Environment and Rural Affairs. The UK ETS is the primary mechanism for carbon pricing across the UK. This cap-and-trade system currently covers industry, aviation and electricity generation (non-renewable). As opposed to a carbon tax which directly sets a price of carbon, this scheme sets a limit on the total number of allowances[339] available over a period of time, known as the UK ETS cap. The allowances available reduce over time, allowing for a market-driven carbon price to emerge where participants can trade allowances depending on whether it is cheaper to decarbonise or pay the UK ETS price. The UK Government produce a set of traded carbon price projections for modelling purposes using their Carbon Market Model, which attempts to project how a declining cap in combination with marginal abatement cost curves will affect UK ETS prices in the future.[340] The UK ETS is projected to have an increasing carbon value over time, which results in even stronger incentives to plan for decarbonisation as it becomes relatively more expensive to retain fossil-fuel based technologies. The UK ETS is modelled in NZIP 2.0 by the introduction of traded carbon price projections for the traded industry. Three scenarios were explored:
- Central Scenario
This scenario assumes the net-zero strategy aligned traded carbon price[341] for the traded sector in NZIP 2.0. For the non-traded sector, the same carbon values are used as in the baseline to reflect that there may be some internalisation of the carbon price by those who aren’t part of the compliance market.
- Low Sensitivity
This scenario assumes the low sensitivity carbon price trajectory for the traded sector, and has a lower carbon price trajectory compared to the central scenario. This reflects a state of the world where fossil fuel prices are relatively higher than the cost of renewables, driving a lower carbon market clearing price. For the non-traded sector, slightly lower voluntary market prices are assumed to reflect a world with higher fossil fuel prices.[342]
- High Sensitivity
This scenario assumes the high sensitivity carbon price trajectory for the traded carbon price. This trajectory reflects a state of the world where fossil fuel prices are lower and as such require a higher carbon price to incentivise decarbonisation. The non-traded sector is assumed to face slightly higher voluntary carbon prices given lower fossil fuel prices.[343]
Scottish Industrial Energy Transformation Fund
The SIETF is a Scottish Government policy which provides grant funding to help energy-intensive industrial sites in Scotland cut energy costs and reduce GHG emissions by funding energy efficiency updates and decarbonisation projects. This includes project deployment such as fuel-switching and improving the efficiency of existing manufacturing equipment. It is due to end in 2026.
New Industrial Decarbonisation Programme
Building on SIETF, our ambition is to leverage investment that can help to secure Scotland’s existing diverse industrial manufacturing base and support Scotland to become a centre for clean Energy Intensive Industries of the future. From 2027, a new programme, subject to multi-year budget approval, will complement other policies such as ETS by providing a means for industry to cut emissions; while covering a range of decarbonisation technologies it will aim to unlock significant industrial electrification opportunities. This is treated as a proposal given its infancy in policy development.
Support for CCUS (including the Acorn T&S Project and the Scottish Cluster)
Acorn is a CCS project based at the St Fergus gas terminal in Aberdeenshire, Scotland. The project aims to use existing offshore pipelines to move compressed CO2 from St Fergus to offshore storage sites. In June 2025, the UK Government committed £200 million in development funding to help prepare the Acorn project for delivery, with UK ministers stating the goal is to reach a final investment decision by 2028/29. The Scottish Government has committed £80 million to support the Acorn T&S Project and has repeatedly urged the UK Government to work at pace to ensure the availability of CCS in Scotland.
Investing in Hydrogen
The Scottish Government provides cross-cutting grant support to help develop the hydrogen sector in Scotland. The main goal is to accelerate green hydrogen production and help support the wider supply chain as well as hydrogen transport, storage and industrial end-use. Funding includes nearly £7m via the Hydrogen Innovation Scheme, and over £3m via the 2024/25 Green Hydrogen Funding Call.
Financial Impact Summary
| 2025 £million | 2026-2030 | 2031-2035 | 2036-2040 |
|---|---|---|---|
| Benefits | 41 | 41 | 41 |
| Net CCP costs | 324 | 590 | 1,525 |
Cost Summary
Costs of CCP policies in the table above derive from a combination of NZIP 2.0 modelling and internal policy estimates of costs and benefits. Alongside the financial support provided by government, a significant proportion of decarbonisation costs will need to be funded by industry. These costs have been estimated using NZIP 2.0, which models how industrial sites across Scotland could decarbonise over the next 25 years when cost minimising in their business decisions, considering the relative cost of existing industrial processes and the expected costs of emerging decarbonisation technologies.
These costs include both the financial cost of investing in new climate-friendly technologies and costs offset from financial savings from reduced expenditure on fossil fuel technologies.
Benefits Summary
The total benefits included represent the financial benefits to industry from improved energy and resource efficiency as a result of historic funding from SIETF. Given improved energy and resource efficiencies, businesses who took advantage of SIETF will continue to see the benefit of improved efficiency every year going forward. Given the infancy of the new industrial decarbonisation programme, benefits have not been quantified. As such total benefits included represent a lower bound on the potential overall benefits to industry. While not included in the table above, the primary benefit from these costs will be the social benefit of lower carbon emissions.
Technical Uncertainties
The largest area of uncertainty for the delivery of the industry decarbonisation pathway is the future UK ETS carbon price. As illustrated in the analysis above, the UK ETS carbon price will play a key role in determining the relative cost of gas and oil reliant technologies compared to low carbon technologies. If the future traded carbon price is low, this may provide little incentive for industry to adopt decarbonisation technologies, choosing instead to continue to adopt carbon-heavy technologies resulting in minimal decarbonisation. Alternatively, if the traded carbon price starts to rise over the next decade, this could signal much higher costs associated with carbon-heavy technologies, causing a major shift in which technologies are adopted across industry and driving strong decarbonisation. While projections of traded carbon values are produced by the Department for Energy Security and Net Zero (DESNZ),[344] these are not forecasts of the UK ETS carbon price and do not try to predict what will happen with the UK ETS price in the future. The UK ETS price could be impacted by multiple factors, such as future scope expansions and any potential linking with other ETS schemes such as the EU ETS.[345]
Dependencies
The pathway of our estimates for industry are dependent on:
- Support for investment in decarbonisation technologies: this includes the availability of private finance to fund the purchase of new technologies, business buy-in and government support schemes,
- Availability of decarbonisation technologies: while some decarbonisation technologies are currently available for some industrial sectors, the pace of development of new technologies and the cost of these will directly shape the cost-effective options available to industry over the next couple of decades, and
- The price of electricity: the pace of electrification across industry will hugely depend on the relative cost of oil and gas versus the cost of electricity – the speed at which the UK electricity market shifts away from fossil-fuel based electricity generation towards renewables, and the availability of government support schemes for electrification will be hugely prominent in shaping the relative costs of different options available to industry.
Delivery
Delivery considerations include:
- Industrial decarbonisation support programmes: this includes the newly proposed industrial decarbonisation programme, expected to start in 2027, in addition to the SIETF – public and private funding will play a crucial role in supporting industrial decarbonisation and will help to avoid deindustrialisation across Scotland, and
- Acorn T&S Project: the Scottish Government are supporting the development of the Acorn T&S Project, which will play a key role in the deployment of CCS decarbonisation technologies and NETs over the next couple of decades.
Non-Domestic Buildings
Key Policies
- Clean Heat Target – Non-Domestic
- New heat network provisions
Enabling policies
- Minimum energy efficiency standards
- Energy Performance Certificate Reform
- Heat Networks Support Unit
- Scotland’s Heat Network Fund
- Delivery schemes, including:
- SME Loan Scheme
- Business Energy Scotland
- Green Public Sector Estate Decarbonisation Scheme
- Future finance, including the Green Heat Finance Taskforce
- Local Heat and Energy Efficiency Strategies
Emissions from non-domestic buildings are primarily as a result of the use of polluting heating systems such as natural gas, oil or other fossil fuel boilers.
Non-domestic buildings decarbonise by 63% between 2025 and 2040, mainly as a result of the transition from fossil fuels to clean heat sources. The estimated non-domestic buildings emissions pathway for CCP is shown in the table below:
| MtCO2e | 2026-2030 | 2031-2035 | 2036-2040 |
|---|---|---|---|
| Baseline emissions | 7.2 | 6.4 | 6.2 |
| Emissions reductions | 0.04 | 0.5 | 2.4 |
| Total | 7.2 | 5.9 | 3.8 |
Note: Totals may not sum due to rounding
The current baseline for non-domestic buildings assumes that there is no significant decarbonisation without further policy action. The small reduction reflects the impact of F-gas regulations on the baseline and a reduction in heating demand over time due to a warming climate. The baseline assumes no increase in emissions from new buildings, due to the New Build Heat Standard, which mandates the use of clean heating systems in new buildings instead of oil and gas boilers. It also assumes that reductions, mainly as a result of high energy prices in recent years, are maintained. In the absence of additional measures (such as regulation or reforms to energy pricing, for example), it is assumed that there is insufficient incentive to drive large-scale adoption of clean heating systems, which typically involve higher upfront capital costs compared to replacing existing systems. In order to assess the impact of a warming climate on the baseline for Non-Domestic Buildings, analysis has been conducted internally to track the effect of increasing temperatures on gas demand in Scotland.
Analytical Methodology
The baseline was estimated through a simple continuation of the emissions levels for the sector reported in 2023. A minor adjustment was made to reflect the impact of GB-wide F-gas regulations on the baseline, by applying the anticipated percentage reductions from these regulations to the sector’s existing F-gas emissions. The impact of rising temperatures on heating emissions is estimated by modelling the relationship between average temperature and heating demand, then applying this to Met Office projected climate trends. Currently, as the modelling is based on the 2023 GHG inventory, 2023 is used as the base year. Previous years from before the COVID-19 pandemic are not included due to the material impact that the pandemic has had on building energy demand and usage. The baseline is subject to considerable uncertainty, driven by factors that are difficult to predict, such as temperature variability, future energy prices, UK Government policy decisions, and the future availability and cost of emerging technologies.
For non-domestic buildings we follow broadly the same approach used in domestic and public buildings. Numbers of non-domestic and public buildings are sourced from Non-Domestic Analytics (which is a database of the Scottish non-domestic building stock). We estimate initial decarbonisation in CB1 based on current trends and policy support. For more detail see the residential sector above, as the overall methodology carried out is broadly the same, with some exceptions. For example, evidence and data on non-domestic energy efficiency is less robust than evidence for residential energy efficiency. These impacts are, therefore, not modelled for non-domestic buildings.
Financial Impact Summary
| 2025 £million | 2026-2030 | 2031-2035 | 2036-2040 |
|---|---|---|---|
| Benefits | - | - | - |
| Net CCP costs | 162 | 1,714 | 1,587 |
Costs associated with the delivery of the clean heat target are included in CB1 where there is greater certainty on action required. For subsequent carbon budgets the policy levers will be determined based on the outcome of existing Scottish Government policy, technologies and UK Government policy decisions. As such they are not costed, given their proposal status. Costs associated with heat network provisions are included for CB1, CB2 and CB3. Heat network infrastructure costs are calculated in the same manner as set out in the residential and public section above, i.e. attributing the total cost to provide 13.4 TWh by the heat demand of each sector.
Cost Summary
The current Non-Domestic CCP policy package is expected to have an additional cost of around £3.5 billion from 2026 to 2040, noting that delivery of the target is only costed to 2030 given the need for greater certainty based on outcome of existing Scottish Government policy, technology development and UK Government policy decisions.
The cost estimates reflect the additional cost required to transition from fossil fuel heating systems to clean heating alternatives, along with the supporting infrastructure necessary to enable this. It is assumed that a substantial portion of these costs will be borne by businesses who own non-domestic buildings.
Benefit Summary
Benefits associated with decarbonising non-domestic buildings are not quantified in the Plan period.
Average non-domestic electricity unit prices are currently around five times the level of gas unit prices.[346] While heat pumps can be around three times more efficient than traditional gas boilers, this is currently offset by the electricity-to-gas price ratio, making it unlikely that non-domestic buildings will experience reduced running costs from switching to heat pumps under current energy prices.[347]
There is potential for reduced running costs in the future if electricity prices decline relative to gas (e.g. if the UK Government were to use its reserved powers to reduce electricity prices). However, this potential benefit has not been quantified due to difficulties with predicting future energy prices which are influenced by a wide range of unpredictable factors, such as geopolitics, UK Government policy decisions and future energy demand.
Technical Uncertainties
The modelling underpinning the baseline and emissions reduction trajectory is subject to uncertainty, driven by factors that are difficult to predict, such as temperature variability, future energy prices, UK Government policy decisions, and the future availability and cost of emerging technologies. For example, changes to energy prices are not modelled in this analysis, and future energy costs are uncertain. Possible changes to energy prices do not, therefore, influence the indirect demand for clean heating conversions in our analysis (through for example, changes to the expected running costs of clean heating systems). Significant future movement in energy costs – through market effects or through policy interventions – may affect the rate of decarbonisation of the sector.
Dependencies
In order to support decarbonisation of buildings, supply chain development is assumed to occur in industries to deliver increasing retrofit, energy efficiency installation and heat pump manufacture related to delivery of the trajectory. Our estimates also assume sufficient training provision uptake over the pathway. It is assumed that the investment required to develop heat networks continues to be available over the pathway.
Delivery
A key delivery mechanism is grant funding and loans to incentivise the switch to clean heating. SG continues to monitor levels of grant awards and engage with industry to ensure the necessary pipeline of skills.
Negative Emissions Technologies
Negative Emissions Technologies (NETs) have been highlighted by the CCC as being crucial for Scotland achieving its 2045 net-zero target.[348] NETs are engineered GHG removals that directly remove carbon dioxide from the atmosphere and store it in secure storage sites.
While there are several types of NETs, the most significant in terms of emissions reductions and the technologies the Scottish Government will be focusing on are:
- Bioenergy with Carbon Capture and Storage (BECCS)
BECCS operates by capturing emissions from biomass used for producing power, heat, fuels or hydrogen, and storing it in secure CCS sites. As biomass absorbs CO2 as it is grown, any captured emissions from biomass is treated as essentially removing CO2 from the atmosphere. BECCS costs vary considerably, like most NETs, with estimates suggesting values as high as £314/tCO2 to as low as £12/tCO2.[349]
- Direct Air Capture with Carbon Storage (DACCS)
This technology aims to directly capture carbon dioxide from the air using chemical sorbents, then compress and send to a secure CCS site via pipelines. DACCs is currently very costly, at between £315 and £550 per tCO2.[350] However, costs are expected to decrease over time, making DACCS more relatively cost effective as a means of reaching net zero.
As the exact mix of deployment for these developing technologies in Scotland is currently unknown, this analysis is subject to a significant degree of uncertainty.
The emissions reductions anticipated from NETs are presented below:
| MtCO2e | 2026-2030 | 2031-2035 | 2036-2040 |
|---|---|---|---|
| Emissions reduction | 0.2 | 3.0 | 12.2 |
Note: NETs emissions reductions result in cumulative negative emissions reductions
Financial Impact Summary
The costs of deploying NETS are highly uncertain and cost and benefit estimates for this proposal are not provided. All costs from NETs are expected to fall on government, as there is no financial motive for the private sector to invest in NETs currently. While integration of GHG Removals into the UK ETS[351] may help improve private investment in NETs and reduce costs over time, the overall net impact on emissions will hugely depend on the design of the UK ETS cap. Any move to a long-term net cap would mean any NETs generated from the UK ETS would be offset by higher UK ETS emissions.
Technical Uncertainties
NETs covers is a broad term covering many technologies. Emerging options carry uncertainties around technology readiness, integration with existing infrastructure, and scalability.
Scotland has promising geological storage potential in the North Sea, however, the UK Government need to provide certainty on infrastructure build‑out, regulatory approvals, and long‑term monitoring frameworks. Many NETs technologies depend heavily on future grid capacity, renewable generation expansion, and the ability to site energy intensive facilities within constrained transmission zones.
Dependencies
Many of the interdependencies for the roll out and scale up of NETs are reserved, including deployment at scale of CCS, electricity pricing and UK Government GHG Removal policy.
CCUS infrastructure: Scotland’s ability to deploy NETs at scale depends on a CO2 transport and storage infrastructure.
The price of electricity: NETs require substantial low cost, low carbon electricity and heat; especially for DACCS. Currently deployment of DACCS is tied to the expansion of renewable generation and the capacity of Scotland’s transmission network.
UK Government policy: policy clarity, long term incentives, and robust GHG accounting and certification systems are required. These frameworks are essential for investor confidence and for ensuring that removals are credible.
Biomass: Scotland must balance biomass supply with land‑use constraints, environmental sustainability, and competing demands for bioresources.
Delivery
The UK Government must increase action in this space: the fiscal, legislative and regulatory levers required to deliver CCS remain reserved to the UK Government. The Scottish Government are supporting the development of the Acorn T&S Project, which will play a key role in the deployment of CCS and NETs over the next couple of decades.
Agriculture
Summary
Summary of Agricultural Pathway
Agricultural GHG emissions are projected to fall by 21% between 2025 and 2040. Around half of this is as a result of the CCP policy package that includes mitigation measures delivered under the Agricultural Reform Programme and initial work to reduce NRMM emissions across the time period. Significant baseline reductions generated by wider external factors are estimated to account for the other half of the decline in agricultural emissions. The emissions profile across the three carbon budgets to 2040, accounting for the policies and proposals in the CCP, are estimated as follows:[352]
| MtCO2e | 2026-30 | 2031-35 | 2036-40 |
|---|---|---|---|
| Agriculture emissions projection | 36.3 | 33.7 | 30.2 |
| Agriculture baseline emissions | 36.5 | 35.3 | 33.9 |
| Agriculture policy reductions | 0.2 | 1.5 | 3.8 |
An initial assessment of the costs and benefits arising from the policies brought forward as part of this CCP to decarbonise Agriculture has been undertaken. At this stage of ARP development it has not been possible to fully assess the costs and benefits to industry of all elements of the policy package. All figures should, therefore, be treated as provisional.
The cost of the support package is aligned to the Agriculture and Rural Communities (Scotland) Act 2024 and is based on the current annual budget of £640 million. It has been rolled forwards until 2040 for the purpose of this analysis. It is not a financial commitment. As is appropriate for the treatment of subsidy payments in cost-benefit analysis it has been reflected as a cost to Government as well as a benefit to industry.
The budget covers the full future support framework across all four Tiers of the support framework as they are designed as a package to deliver the Vision for Agriculture, of which climate change is one component. It is not possible to disaggregate the climate costs as the four-tier structure being developed will work together to deliver all the outcomes of the Vision including climate mitigation, nature restoration and sustainable food production. The projections in the CCP do require the future support framework to deliver the mitigation measures with an uptake of 45% as discussed under the analytical description.
Summary of Costs and Benefits
An assessment of the costs and benefits arising from the policies to be brought forward as part of this CCP to decarbonise agriculture has been undertaken. The summary of impacts is presented in the table below.[353]
| 2025 £million | 2026-2030 | 2031-2035 | 2036-2040 |
|---|---|---|---|
| Benefits | 3200 | 3200 | 3200 |
| Net CCP costs | 30 | 30 | 30 |
Baseline
Agriculture Baseline Emissions
The main sources of agricultural emissions as outlined in the table above combine to result in the following projection of overall baseline emissions:
| MtCO2e | 2026-2030 | 2031-2035 | 2036-2040 |
|---|---|---|---|
| Baseline emissions | 36.5 | 35.3 | 33.9 |
Without policy action, emissions in the agriculture sector are projected to continue declining on a similar trajectory to historic trends. This is primarily because of economic factors resulting in the wider use of more efficient farming techniques meaning an equivalent level of output can be produced with fewer inputs. However, these declines in emissions, on their own, are not sufficient to meet the needs of the Carbon Budgets. Agricultural Reform is seeking to deliver the Vision for Agriculture which includes climate mitigation as a key outcome. This means there is greater emphasis on and incentives to reduce emissions and adopt emissions reducing technologies and practices, alongside sustainable food production and nature restoration.
Analytical Methodology for Baseline
Our baseline projections are based on independent peer-reviewed modelling of key agricultural sub-sectors for livestock and arable farming carried out using the FAPRI-UK trade model which have then been aligned to emissions sources in the GHG inventory for agriculture. The model was developed by Agri-Food and Biosciences Institute and captures the dynamic interrelationships among the variables affecting supply and demand in the main agricultural sectors of England, Wales, Scotland and Northern Ireland.
The projection period for the FAPRI-UK model used in the CCP baseline is 2021-2031 and showed a broadly stable projection for the value of output from livestock and arable sub-sectors with a downward projection in livestock numbers and arable hectares. We have adjusted these based on the percentage difference in outturn figures based on the 2023 inventory and extrapolated them forwards on a simple linear basis to 2040. The FAPRI projections are based on macroeconomic factors such as population growth, exchange rates, oil prices and world commodity prices. The 2021-2031 projections are not directly published but the 2020-2030 projections can be found here and topical analysis on GHG-related scenarios using the 2021-2031 projections can be found here.
Livestock Emissions
Livestock emissions – mainly methane created during digestion from ruminant livestock, particularly sheep and cows – are projected to decline over the projection period. This also includes other sources of emissions such as from slurry and manure storage and use. These emissions can be further reduced by changes to a wide range of management practices including improved efficiencies, new technologies and improved animal health.
Agricultural Soils (Management)
These are emissions of nitrous oxide due to management practices which have an impact on soil and are projected to decline over the projection period. They are mainly linked to nitrogen inputs through fertilisers, manure and crop residues and can be reduced through alternative, improved or more efficient use of fertilisers. This category also includes indirect emissions associated with nitrogen leaching and run-off. Emissions and removals associated with soil carbon are captured separately in the LULUCF sector in accordance with international reporting guidelines.
Agricultural Combustion
Combustion emissions are carbon dioxide emissions released from burning fuels for agricultural activities such as operating tractors, irrigation pumps and other machinery. They were originally projected to remain constant over the projection period. These emissions can be reduced by using low energy or renewable technologies or by changes to management practices.
Other Emissions (and Removals)
It is also important that we acknowledge the valuable contribution that our farmers and crofters make to address climate change and support biodiversity as custodians of the land. As outlined in the Agriculture and Rural Communities (Scotland) Act supporting evidence and analysis publication, agriculture has an important role to play in reducing emissions in the LULUCF sector in the CCP. This covers emissions and removals of GHG resulting from direct human-induced land use, land-use change and forestry activities. For example, the award-winning Integrating Trees Network, a farmer and crofter led initiative showcasing the multiple benefits of increasing the integration of trees on farmland for climate change and wider environmental priorities. The agriculture sector also includes a key policy related to ‘Protections of peatlands and wetlands’. This is another example of a policy that will support farmers and crofters to continue to take important actions that increase carbon sequestration on our land.
Carbon naturally cycles between the soil and the atmosphere, with the balance influenced by environmental conditions (such as temperature and moisture), how the land is used, and the soil’s natural characteristics. In farmland, the way the soil is managed, such as through ploughing, crop rotation, or fertiliser use, can have an impact on how much carbon the soil holds and how fast it is returned to the atmosphere. Soil can only store a certain amount of carbon under normal conditions. In Scotland, soils tend to be high in organic carbon, meaning there will be a limited number of farms that have the capacity to increase long-term carbon storage. However, if these carbon-rich soils are not managed properly, they could lose some of their stored carbon, resulting in additional GHG emissions.
Policy Assessment
Key Policies
- Agricultural Reform Programme
- Working to reduce NRMM emissions
- Slurry storage and management
- Supporting emerging technologies, including Smartsheds
- Alternative, improved or more efficient use of fertiliser
- Scottish Suckler Beef Support Scheme reforms to introduce calving intervals
- Protections of peatlands and wetlands
Supporting Policies
- Rural Support Plan
- Future Farming Investment Scheme (FFIS)
- Agricultural Knowledge and Innovation Systems
- Supporting tenant farmers to benefit from the Land Reform Bill
- Whole Farm Plans
- Nitrogen Use Efficiency (NUE) improvements through crop varieties
- Development of MyHerdStats
- Animal Health and Welfare Initiatives
- Methane Inhibitor pilot
- Understanding of selective breeding for low methane genetics
- Supporting planting and managing of trees on farms
The table below shows the estimated emissions reductions from Agriculture policies and proposals in CCP.
| MtCO2e | 2026-2030 | 2031-2035 | 2036-2040 |
|---|---|---|---|
| Emissions reduction | 0.2 | 1.5 | 3.8 |
The primary driver of emissions reductions from the baseline in agriculture will come from the Agricultural Reform Programme which is being designed to incentivise the uptake of climate change mitigation measures.
As set out in our Agricultural Reform Route Map and co-developed with the agricultural industry, we will continue delivering the Agricultural Reform Programme and our new four tier framework throughout the lifetime of the CCP and beyond. Significantly, the Agricultural Reform Programme will ensure that our farm businesses continue to receive funding to produce high quality food while reducing their emissions and improving biodiversity.
Analytical Methodology
The extent of the mitigation potential in the Agricultural Reform Programme was developed based on evidence in the ‘Scenarios for emissions reduction targets in Scottish agriculture’ report carried out by Scotland’s Rural College (SRUC) and published on the ClimateXChange (CXC) website. This report was developed by drawing on recommendations from Farmer Led Groups and other key stakeholder and academic reports outlining the ways in which agriculture in Scotland could reduce its emissions. The primary role of the Agricultural Reform Programme is to develop delivery mechanisms for these mitigation measures.
At present the assumptions for the uptake on mitigation measures are aligned to public commitments to increase the conditionality on at least 50% of support payments and to enable farmers some choice in these. They factor in all measures with an uptake of 45% across the board. In line with the current aims of the Agricultural Reform Programme, the majority of measures are assumed to begin to be implemented from 2030 and take 10 years to reach their respective peak uptake levels. The estimated impacts of two measures begin from 2025 based on announcements already made (Changes to Greening requirements and Calving Intervals). The Table 56 shows the measures quantified in this work, along with other measures in the CCP policy package, as well as an indication of emissions reduction in 2040 based on the assumptions above.
The majority of the mitigation from these measures is estimated to come from the Agricultural Reform Programme above as well as other measures such as water regulations and technology for fertiliser. Reductions from emerging technology, such as for reducing emissions from machinery and Smartsheds, have been estimated separately.
To estimate the emissions reduction from agriculture in each year a model was developed to draw together the baseline projections and extrapolations alongside the SRUC emissions reduction evidence, both of which are discussed above. This gives the number of animals and area of land that each measure is being applied to in each year which is then multiplied by the emissions factor for each measure.
This 45% level of uptake will be extremely challenging for the sector to achieve. The approach has been presented to the Academic Advisory Panel who determined it may be beyond an achievable level of mitigation for the sector. As the Agricultural Reform Programme develops and policy mechanisms become clearer these assumptions will need to be revisited.
Reductions to NRMM emissions have been based on the emissions reductions estimates in an evidence review by ClimateXChange[354] and an assumption of a gradually increasing proportion of alternatively fuelled newly purchased vehicles reaching 50% of new purchases by 2040. Vehicle sales have been estimated from Agricultural Engineer’s Association data and as the average lifespan of agricultural machinery is very long the reductions will take a number of years to build up and significantly change the stock of vehicles.
Reduced emissions from Smartsheds have been based on estimated savings from the SRUC Smart Shed project with 100 sheds being established by 2040.
| Mitigation measure | MtCO2e (2040) | Mitigation measure | MtCO2e (2040) |
|---|---|---|---|
| Nitrate feed additive beef | 0.09 | Nitrification inhibitor | 0.02 |
| Machinery decarbonisation | 0.09 | Soil pH | 0.02 |
| Genomics breeding dairy | 0.07 | Health dairy | 0.01 |
| Sexed semen in dairy | 0.05 | High fat diet beef | 0.01 |
| Faster finishing beef | 0.05 | Slurry acidification dairy | 0.01 |
| Grass-legume mix | 0.05 | AD pig poultry | 0.008 |
| Current breeding goal in dairy | 0.04 | Slurry acidification beef | 0.007 |
| Increasing beef calving rate | 0.04 | Genomics breeding beef | 0.005 |
| 3NOP beef | 0.04 | High fat diet sheep | 0.005 |
| 3NOP dairy | 0.03 | Lower emission breeding goal beef | 0.004 |
| Health sheep | 0.03 | Reducing age first calving beef | 0.003 |
| AD cattle | 0.03 | Nitrate feed additive sheep | 0.003 |
| Lower emission breeding goal dairy | 0.03 | Soil compaction | 0.002 |
| Nitrate feed additive dairy | 0.02 | Urease inhibitor | 0.002 |
| SmartSheds | 0.02 | Impermeable slurry cover dairy | 0.002 |
| Health beef | 0.02 | Impermeable slurry cover beef | 0.001 |
| Cover Crops | 0.02 | High fat diet dairy | 0.001 |
| Grain legumes | 0.02 | Slurry acidification pigs | 0.0005 |
| Variable rate nitrogen | 0.02 | Impermeable slurry cover pigs | 0.00004 |
| Total | - | - | 0.86 |
Note: Totals may not sum due to rounding
Financial Impact Summary
The table below summarises the estimated financial impacts of the Agriculture policies and proposals in the CCP for each carbon budget period:
| 2025 £millions | 2026-2030 | 2031-2035 | 2036-2040 |
|---|---|---|---|
| Benefits | 3,200 | 3,200 | 3,200 |
| Net CCP costs | 30 | 30 | 30 |
There is a £640 million annual budget which covers the full future support framework across all four Tiers of the support framework as they are designed as a package to deliver of the Vision for Agriculture. It is not possible disaggregate the climate costs as the Tiers work together to deliver all the outcomes of the Vision including climate mitigation, nature and sustainable food production. The projections in the CCP do require the future support framework to deliver the mitigation measures with an uptake of 45% as discussed under the analytical description.
The main additional cost to Scottish Government will be realised through the implementation of the Agricultural Reform Programme. This has been estimated at a cost of £36 million between 2024/25 and 2029/30. It has been reflected in this document as an average of £6 million annually at a cost of £30 million in the time period in question (2026-2030). Further development may be required beyond 2030 but it has not been possible to factor this in at present so an annual figure of £6 million has been rolled forwards. As with agricultural support itself the Agricultural Reform Programme is seeking to deliver on multiple objectives not just climate change. The costs above reflect the costs of the programme, delivering on all objectives.
Cost Summary
The net CCP cost to government is set at £6 million per year which is the cost of the Agricultural Reform Programme. However, the annual £640 million full future support framework across all four Tiers is necessary in order to deliver the emission reductions. In addition to this there are costs and benefits to industry that are yet to be fully quantified.
Benefits Summary
As outlined above, the quantum of agriculture support package are included here as a benefit to industry as is appropriate for the treatment of subsidies in a cost-benefit assessment. In addition to this there are substantial costs and benefits to industry that are yet to be fully quantified.
Technical Uncertainties
As noted above, our baseline projections are based on independent peer-reviewed modelling of key agricultural sub-sectors for livestock and arable farming. The model that produced these projections was developed by the Agri-Food and Biosciences Institute and captures the dynamic interrelationships among the variables affecting supply and demand in the main agricultural sectors of England, Wales, Scotland and Northern Ireland.
Independent of policy action, emissions in the agriculture sector are projected to decline on a similar trajectory to historic trends. Any long-term projection will have an inherent level of uncertainty and these trends will be monitored over time as new outturn emission data is published.
Dependencies
As noted previously, our emissions projections are a mixture of livestock emissions (which includes other sources such as from slurry and manure storage); agricultural combustion emissions (linked to emissions released from burning fuels for agricultural activities) and agricultural soil management (linked to management practices such as use of fertilisers as well as indirect emissions such as nitrogen leaching and run-off).
There are also interdependencies with the LULUCF sector, which covers emissions and removals of GHGs resulting from direct human-induced land use, land-use change and forestry activities.
Each of these factors have been considered as part of the estimation of the agricultural sector pathway.
Delivery
As noted previously, the primary driver of emissions reductions from the baseline in agriculture will come from the Agricultural Reform Programme which is being designed to incentivise the uptake of climate change mitigation measures. As set out in our Agricultural Reform Route Map and co-developed with the agricultural industry, we will continue delivering the Agricultural Reform Programme and our new four tier framework throughout the lifetime of the CCP and beyond.
Land Use, Land Use Change, Forestry
Summary
Summary of LULUCF Pathway
The table below shows the expected pathway of remaining emissions in each carbon budget period for the LULUCF sector following the policies and proposals in the CCP.
LULUCF| MtCO2e | 2026-2030 | 2031-2035 | 2036-2040 |
|---|---|---|---|
| Emissions projection | 3.6 | -1.1 | 0.0 |
| Baseline emissions | 5.7 | 11.1 | 15.9 |
| Policy reductions | 2.1 | 12.1 | 15.9 |
The main emissions and removals estimated for the main sub-components of LULUCF over the Plan period are detailed below (net removals shown as negative numbers).
| MtCO2e | 2026-2030 | 2031-2035 | 2036-2040 |
|---|---|---|---|
| Peatlands | 29.5 | 19.8 | 17.3 |
| Cropland Mineral Soils Change | 21.7 | 20.6 | 19.8 |
| Settlements | 3.7 | 3.7 | 3.8 |
| Other LULUCF | -0.3 | -0.3 | -0.3 |
| Grassland Mineral Soil Change | -17.5 | -17.5 | -17.5 |
| Forestry | -33.5 | -27.4 | -23.0 |
| Total | 3.6 | -1.1 | 0.1 |
Note: Totals may not sum due to rounding
Summary of Emissions Sources
The LULUCF sector in the national GHG inventory is unique in that it includes both sources and sinks of GHG emissions. Forestry is responsible for the biggest GHG removal, while peatlands are the biggest emissions source within the sector.
Land use change and management of agricultural soils contribute additional sources and sinks to the LULUCF sector. However, because soil carbon stocks change very slowly over time, much of the current emission source comes from land transformations more than 20 years old. While agricultural policies encourage good practices to maintain soil carbon, insufficient data and evidence exists to accurately quantify the impacts of these activities. Emission reductions associated with soil carbon stock changes in mineral soils are, therefore, not included in this analysis. For further information, see the Agriculture Sector section.
Summary of Costs and Benefits
An assessment of the financial costs and benefits arising from the policies to be brought forward as part of this CCP to expand woodland creation and restore degraded peatlands has been undertaken. The summary of impacts is shown in the table below.
| 2025 £million | 2026-2030 | 2031-2035 | 2036-2040 |
|---|---|---|---|
| Benefits (Forestry) | 633 | 727 | 741 |
| Net CCP costs (Forestry) | -151 | -71 | -79 |
| Benefits (Peatlands) | 172 | 206 | 206 |
| Net CCP costs (Peatland) | 100 | 120 | 120 |
| Benefits LULUCF | 805 | 933 | 947 |
| Net CCP costs LULUCF | -51 | 49 | 41 |
Note: negative Net CCP cost figures indicate that the estimated benefits exceed the costs.
Note that there are also considerable non-monetary benefits of the LULUCF policy package that is presented in this Plan.
Forestry
Summary of Forestry Emissions Pathway
The emissions from the forestry sector are derived from existing forest land, harvested wood products and land converted to forest land. The latest UK inventory data (2023) shows that the forest estate removes 7.6 MtCO2e annually, or 9.2 MtCO2e if sequestration in harvested wood products is included. These are expected to contract to –2.9 MtCO2e and -5.0 MtCO2e by 2040. This is primarily due to the uneven age profile of the forests, higher level of timber harvests in recent years and their replacement with younger, temporarily slow-growing trees.
Harvested Wood Products (HWP) are wood-based materials harvested from forests. These are used in production and/or energy, acting as substitutes for more environmentally harmful materials and energy sources and help to sequester carbon by forming a wood-based sink. The HWP sink has increased 200% since 1990, which also highlights the increased demand for Scotland’s wood products.
| MtCO2e | 2026-2030 | 2031-2035 | 2036-2040 |
|---|---|---|---|
| Baseline emissions | -33.5 | -27.4 | -22.4 |
The reduction in the forest carbon sink is projected to level-off in the period after 2040 and rise thereafter as recently planted woodlands move towards maturity and faster rates of growth. Creating new woodlands now is the main forestry measure to mitigate the decline in the sink in the next 15 years or so and to increase the rate at which sequestration (removal) capacity builds up again after that, set out in Graph 1 below.
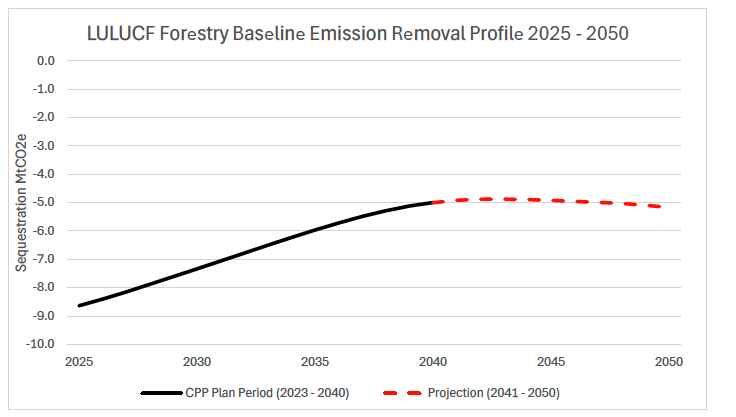
Policy Assessment
Key Policy
Scottish Forestry has worked with colleagues in the Scottish Government to prepare forestry’s contribution to the CCP. The current policy (Policy 1) is to scale up to 18,000 hectares of new woodland a year by 2029, with a further 10% “stretch” in CO2 removals due to the potential for improved location, species and management of trees. In 2040, this will result in an estimated total of 258,000 hectares of new woodland being planted.
| Hectares | 2026-2030 | 2031-2035 | 2036-2040 |
|---|---|---|---|
| Woodland Creation schedule | 78,000 | 90,000 | 90,000 |
The anticipated increase in the carbon sink from the proposed woodland creation schedule is estimated at 0.3 MtCO2e in 2040, the point when additional sequestration is achieved through the previous annual planting rates and the time taken for newer trees to sequester carbon. There is then increasing sequestration after this period. This will reduce the contraction in the annual carbon sink, which will reach -5.3 MtCO2e in 2040, a reduction of 38% of current levels.
| MtCO2e | 2026-2030 | 2031-2035 | 2036-2040 |
|---|---|---|---|
| Emissions reductions | 0.0 | 0.0 | 0.6 |
Although out of scope for this assessment, higher sequestration levels will continue beyond 2040 due to the new planting achieved, rising to -5.8 MtCO2e in 2045.
A secondary policy is to increase the use of sustainably sourced wood-fibre or HWP to reduce GHG emissions. This will be achieved through greater use of wood products by the construction and productive industries, thereby substituting for more carbon intensive materials and resulting in the potential for further emissions reductions in the Industrial and Business Process sector. The amount of HWP available for use and its associated carbon sequestration is directly although partially dependent on woodland creation policy, as the policy influences the type, volume and quality of timber that will be available in the future.
Analytical Methodology
Baseline
DESNZ is responsible for producing the emissions baseline for the LULUCF sector which includes forestry. The technical compilation of the inventory is produced by the UK Centre for Ecology and Hydrology (UKCEH) who, for the forestry component, use data provided by Forest Research. UKCEH uses a wide array of data sources (e.g. National Forest Inventory) as key inputs in carbon flow models to calculate the net emissions or removals in the forestry sector. These models simulate changes in forest carbon stocks and are driven by historical and current data on forest planting rates, management practices and harvesting to measure the entire forest lifecycle and estimate annual net CO2 removals. The central baseline scenario used assumes a minimal woodland creation schedule of 326 hectares per year. The estimates provided are calculated using the most robust, scientifically accepted data available at the time of compilation. As new information, improved methodologies, or updated emission data becomes available, analysis will be updated.
Policy
Modelling for all new woodland carbon removals under the key policy is based on Scottish Forestry analysis using up-to-date post-processed data from the Forest Research CARBINE data model. The approach taken to the Scottish Forestry modelling was discussed in detail with the CCC as the most scientifically robust approach available at the time of compilation. The forestry modelling is built on a set of assumptions that take account of differences in CO2 removals across different species, soil types and management regimes, which reflect variations in regional characteristics. At a practical level, local and regional objectives are also important in allocating funding for woodland creation through targeting under the Forestry Grant Scheme (FGS).
Financial Impact Summary
| 2025 £million | 2026–2030 | 2031–2035 | 2036-2040 |
|---|---|---|---|
| Benefits | 633 | 727 | 741 |
| Net CCP costs | -151 | -71 | -79 |
Note: negative Net CCP cost figures indicate that the estimated benefits exceed the costs.
The main affected groups under the key policy are government and business. The results present analysis for a 15-year assessment period commencing in 2026. Central costs values are used here although the development of high and low scenarios was considered.
Costs Summary
The costs of delivering on the Forestry ambitions of this CCP are primarily from the required capital investment for new forestry planting, maintenance costs and Scottish Forestry resource costs. The exact split of these is determined by Government’s level of funding through the FGS which include five-yearly maintenance costs and by the level of resourcing required by Scottish Forestry to achieve the hectare targets.
Any capital funding not provided by Scottish Government will have to be sourced from businesses which will result in a direct financial cost during initial planting phases and ongoing maintenance during the growth period. Private sector finance towards woodland creation is substantial and has increased in recent years through the additional private finance attracted through the Woodland Carbon Code and has enabled public spending through the FGS to be stretched to support a greater area of new woodland.
There are some additional private costs for administration but these costs have not been accounted for due to the limited evidence at this stage.
The methodology for assessing the monetised costs is based on published research and data. Cost assumptions combine FGS unit grant data with the trajectory of increasing woodland creation by an average of 2,000 hectares each year until 2029/30, maintaining levels thereafter. An estimated 80% of costs is provided through the FGS, with the remaining costs met by the private sector. Unit cost calculations assume that 60% of new planting will be conifer and 40% broadleaved. Maintenance costs are derived from FGS unit cost data and applied over a five-year period. Data will be monitored, evaluated, and updated as appropriate in future
The potential to meet CCP woodland creation targets will require trees to be integrated into the agricultural landscape. Although the current targeted area grant rate is a strong incentive for afforestation, the impact differs depending on type of farmland and how responsive landowners and farmers are willing to change land use i.e. from agriculture to forestry. There is a risk that standard rates may only encourage afforestation on marginal land. As the hectare target increases to higher levels, a farmer’s decision to switch land to forestry may involve a higher opportunity cost when available land is more productive or may involve higher costs on sites that are difficult and/or less accessible to plant. Scottish Forestry will continue to collect evidence and address knowledge gaps on the uptake of grant rates and their relation to investment behaviour and decisions.
Benefits Summary
The key and supporting policies are expected to result in total benefits of £2.1 billion across government and business. These values are derived from the economic activity from timber and estimated carbon market value of woodland projects under the key policy.
The key policy of expanding and sustained woodland creation, together with the FGS incentive, provides the conditions for a predictable, rising future timber supply and an increased revenue and profit stream beyond 2040. The policy can help reduce business risk of investment in innovation, widen timber procurement, increase productivity and market expansion; particularly as domestic demand for timber remains high to meet construction and net-zero targets across the UK.[355]
The release of carbon credits is a market-based way of valuing CO2 removals, although the true social value of carbon is an order of magnitude greater than the market value. In this case, Scottish Forestry uses the FGS investment to unlock private market funding in the creation of woodland in order to produce the positive spillover effects from woodlands (e.g. carbon sequestration) and secure long-term benefits to the public. Additionally, the economic value of wider non-market benefits (e.g. biodiversity, health and well-being) is estimated to be at least £2 billion annually across the whole forest estate.
The total benefits to government and business are an estimated £2.1 billion over the appraisal period. The monetised benefits are derived from economic activity from timber (public and private benefits) and estimated carbon market value of woodland projects (private benefits only). The estimated total impact is a net benefit (negative costs) of £301 million over the appraisal period.
The methodology for assessing the monetised benefits is derived from modelling using published data. Future timber revenues are estimated using historical average public and private timber volumes applied to a five-year average timber price (taken from official timber price indices data). The methodology for estimating carbon market value uses volume and price data from the Woodland Carbon Code; specifically, the average number of carbon credits issued per hectare, multiplied by the average carbon credit price, and then scaled using the projected area of annually validated woodland. Data will be monitored, evaluated, and updated as needed in future.
Other benefits
Other benefits of the forestry policy package for the CCP are based on non-market values. However, some evidence-based methodologies for approximating co-benefits and non-market values of woodland creation per annum are outlined below for context. Methodology for employment figures in direct woodland creation is also given.
- The social benefits have been valued as £400 million and £32.5 million per year for recreation and landscape amenity, respectively. Recreation value was estimated using a willing to pay unit values to travel to woodlands for recreation, multiplied with the number of visits to woodlands per year. Landscape valuation is based on public preferences and willing to pay for forested landscapes and views, multiplied by rural populations from census data.
- Human health benefits have been estimated as £34 million per year, being the estimated avoided costs of healthcare (issuing prescriptions) for reduction in mental health prevalence from visiting woodlands regularly. This achieved from establishing the estimated number of adults who visit woodlands and have a mental health condition and multiplying with the prevalence reduction from regular visits and relevant treatment cost profile.
- An annual average of 1,700 FTE-equivalent jobs will be created directly from woodland creation over the appraisal period. Employment benefits have been modelled using expected marginal FTEs from woodland creation activities and multiplied by the annual levels of woodland creation under the key policy.
Technical Uncertainties
Emissions and Removals Reporting
LULUCF sector emissions and removals figures used in the analysis are provided through official UK National GHG Inventory Reports. GHG CO2 removals and emissions figures from woodlands are dependent on complex modelling rather than direct measurement and are, therefore, subject to some uncertainty. The CARBINE model methodology developed by Forest Research is regularly assessed in line with the latest science and evidence. Updates to its methodology can introduce new variances which may impact historical and projected emission figures. For example, using the 2023 Inventory statistics (published in 2025), CARBINE model parameters were updated to reflect changes in the decomposition rate of dead wood, impacting the overall annual net carbon sink calculation. Accuracy of pathway estimates given in the CCP will be maintained by monitoring any official annual recalculations of data. This will ensure policy decisions are based on the most current scientific understanding of forest carbon modelling.
Cost and Benefit Uncertainties
Future reviews of the FGS may impact project total cost and capital estimates and projections given in the analysis. The development of new cost evidence and information will be monitored, with the analysis updated appropriately.
Monetised benefits estimated in the analysis can be impacted by future regulatory approaches and market fluctuations, dependent on drivers relating to demand and supply within timber and carbon markets. Changes in the evidence base will be monitored, with the analysis updated to reflect any new market, regulatory and other conditions.
Dependencies
The pathway estimates are dependent on the following.
- Available public and private finance: historic data shows that woodland creation in Scotland is highly responsive to the level of grant funding. The FGS budget must be consistently maintained to reach annual targets to meet the projected CO2 removals pathway. Estimates are also dependent on private sector investment. Consistent grant funding, with blended finance models available through the Woodland Carbon Code, will help to sustain confidence among landowners and investors.
- Operational and supply chain: woodland creation targets require a highly functional supply chain, and sufficient planning and certainty is needed to enable these activities to support woodland creation activities effectively. Nurseries (seed and tree saplings) require long-term certainty to scale up operations to meet demand and avoid sapling shortages. Delivery of targets also depends on labour availability.
- Land use change: to meet the emissions pathway, there will be a dependency on working with farmers to enable the integration of trees and woodlands to support farm businesses.
Delivery
Delivery considerations focus on existing funding, regulatory and enabling conditions to meet the CO2 removals pathway given under the woodland creation targets.
Peatlands
Summary of Peatlands Emissions pathway
For the purposes of emissions reporting, peatlands are categorised based on their condition, land use and vegetation composition, with drainage recognised as a key driver of increased emissions. Drainage has historically been driven by a combination of land use pressures, economic incentives, and development practices, for example, for agricultural expansion, afforestation, peat extraction or infrastructure development. In addition to the impact of drainage, emissions estimates from peatlands include quantification of carbon that is lost through grazing and/or harvesting, and peat that is washed downstream, which is particularly important for heavily eroded and exposed sites.
| MtCO2e | 2026-2030 | 2031-2035 | 2036-2040 |
|---|---|---|---|
| Baseline emissions | 31.6 | 31.9 | 32.6 |
Peatland emissions are not expected to change substantially without policy action. There may be some further emissions reductions from restoration carried out in previous years, recognising that it takes time for peatlands to fully recover. However, it is also likely that the condition of some peatlands already in a degraded state, or subject to continual overgrazing, may degrade further without intervention, leading to some increase in emissions. Emissions may also rise in response to the changing climate. While this has not been explicitly quantified, evidence suggests degraded peatlands are less resilient to the impacts of climate change, such as drought and wildfire, than those in good condition.
For the purpose of this analysis, baseline peatland emissions have been extracted from the DESNZ’s LULUCF sector modelling, which assumes no additional restoration without policy intervention.
Peatland policies have been designed to improve peatland condition and stewardship across Scotland, in order to maintain or reinstate their natural function for the benefit of the climate, nature and people. They are gathered into three outcomes – protect, manage and restore – supported by world-class evidence and research.
In addition to ‘restore’, the Plan contains other peatland policies and proposals under ‘protect’ and ‘manage’, including those relating to banning the sale of peat for horticulture, changes to deer management, windfarm and other development on peat, muirburn, and agriculture and crofting. These contribute towards our overarching vision for improving the condition of peatlands across Scotland to strengthen their role in mitigating and adapting to the climate and nature emergencies. However, these other policies and proposals are not yet sufficiently developed to allow emissions reduction estimates at this time. The analysis below is, therefore, focused on emissions reductions associated with peatland restoration.
However, changes in emissions associated with improved accuracy in reporting are also quantified, recognising the continual update and improvement of the evidence base used by the UK GHG Inventory.
Policy Assessment
Key Policy
1. Peatland restoration: we will increase peatland restoration by 10% each year to 2030 and maintain levels after that leading to the restoration of more than 400,000 hectares by 2040. Within this, we will look to increase the proportion of the most highly degraded and emitting peat that is restored.
Supporting Policy
1. Improved accuracy in emissions reporting
The cumulative emissions reductions from a combination of the above policies and the grassland on peat area correction described below are estimated as follows. As a result, reported annual peatland emissions are expected to reduce from an estimated 6.1 MtCO2e in 2025 to 3.2 MtCO2e by 2040.
| MtCO2e | 2026-2030 | 2031-2035 | 2036-2040 |
|---|---|---|---|
| Peatland restoration | 2.1 | 4.5 | 7.6 |
| Peatland area correction | - | 7.7 | 7.7 |
| Total | 2.1 | 12.1 | 15.3 |
Note: Totals may not sum due to rounding
Analytical Methodology
Peatland restoration is the primary means of reducing peatland GHG emissions, with restoration efforts focussed on rewetting, reprofiling, stabilising and revegetating dry or damaged peatlands.
A model based on the UK GHG Inventory methodology was used to estimate the emissions reductions associated with peatland restoration.
Working in collaboration with delivery partners, we have calculated a realistic and achievable restoration trajectory which balances ambition with the current capacity of the sector, its potential to grow and other practical headwinds to upscaling. In reality, annual delivery levels will fluctuate depending on the project pipeline, project complexity and associated costs which will continue to vary considerably. In that context, year-on-year increases of 10% that we have modelled are ambitious, even in the short term.
In terms of hectares restored, our trajectory is below that implied by the CCC’s 2025 balanced pathway which we assess to be unachievable at the pace advised. In emissions terms, however, due to our increased focus on high emitting peat, our pathway is similar to the CCC's until around the middle of Carbon Budget 3.
Total annual restoration projections were further refined by splitting between peatland condition categories, following the approach of the UK GHG Inventory, and based on advice from the Scottish Government’s Peatland Science and Technical Advisory Group. Whilst the majority of peatland restoration is assumed to be carried out on modified bog, which represents the biggest area of degraded peat, the proportion restored within high emitting categories, such as eroded and eroding peats, are assumed to increase to maximise emissions savings.
The peatland model uses these restoration projections to calculate emissions savings based on emission factors and lag times for each condition category. Lag times reflect the reality that severely degraded peatlands require several years to recover and achieve the full potential for emissions reduction after restoration activities are complete. This means that the emission savings from restoration undertaken in the late 2030s will not be fully realised within the quantified timeline presented here.
Emission factors used in the model are based on those in the UK GHG Inventory. As the inventory methodology does not include lag times in its calculations, these were estimated based on available literature and expert advice from the Scottish Government’s Peatland Science and Technical Advisory Group.
Recent evidence has shown that the area of peatland currently assumed to be under grassland vegetation in Scotland has previously been significantly overestimated. Peatland mapping is, therefore, being improved to provide more accurate peatland emissions calculations.
Recent detailed ground surveys and modelling carried out by the James Hutton Institute – a leading authority on Scottish peatlands with extensive involvement with the UK GHG Inventory reporting methodology – show that the area of grassland on peat in Scotland has been significantly overestimated in the Inventory.
These surveys indicate that many sites currently mapped as grassland on peat contain either shallow peat or less intensive land use than assumed, leading to inflated emissions figures in the UK GHG Inventory. A conservative estimate has been used to limit the risk of overstating changes, drawing on preliminary studies and reflecting uncertainties around misclassified areas, possible unmapped grassland on peat, and how these factors affect emissions.[356]
This research is ongoing so findings to date are not yet conclusive. Although early results provide robust evidence of systematic overestimation, these preliminary studies do not yet provide a replacement map that is needed for UK GHG Inventory use, and further research is needed to quantify misclassified areas and their emissions characteristics. We therefore have confidence in the existence of a significant overestimation in the area of grassland on peat, but not yet in the scale of that or what a revised national map of Scottish peat will ultimately show.
Correcting the overestimated areas and the land‑use intensity assumptions is expected to result in significantly lower peatland emissions than presently accounted for in the UK GHG Inventory.
Once this research is complete, and if the expected correction is formally adopted within the UK GHG Inventory, it will be treated as a baseline revision in any future Plan, with the associated emission reductions applied retrospectively across the full time series. In the meantime, however, we will continue to treat the expected adjustment as a single-year step change from Carbon Budget 2.
Financial Impact Summary
A summary of the estimated financial impacts of the peatland policies for each carbon budget period is shown in the table below:
| 2025 £million | 2026-2030 | 2031-2035 | 2036-2040 |
|---|---|---|---|
| Benefits | 172 | 206 | 206 |
| Net CCP costs | 100 | 120 | 120 |
The majority of peatland restoration in Scotland is funded by Peatland ACTION through the main Delivery Partners of NatureScot, Cairngorms National Park Authority, Loch Lomond and the Trossachs National Park Authority, Scottish Water, and Forestry and Land Scotland who work with local organisations and landowners to deliver restoration across Scotland.
However, other restoration efforts take place, whether through alternative grant-funded means, such as the Agri-Environment Climate Scheme (AECS), or privately funded philanthropic or business activity. This issue, along with broader challenges around data availability, will be considered in the Scottish Government’s current work to develop Official Statistics on peatlands in Scotland.
The Scottish Government recognises through the Natural Capital Market Framework that high integrity private investment in nature-based solutions has a role to play in maximising public funding and nature restoration. The voluntary Peatland Code currently offers financial incentives for landowners, while further blended finance models – including carbon contracts[357] – are being explored to reduce landowner risk and help ease public funding demands.[358] The expectation is that private finance is going to contribute more to funding peatland restoration over time.
Peatland restoration offers meaningful financial incentives for businesses and landowners through the generation of Peatland Code carbon credits. Over the CCP appraisal period, the projected level of restoration could expect to deliver around £583 million in financial benefits.
This policy package is expected to generate multiple non-financial benefits as a result of improved peatland condition and its ecosystem services, including reducing carbon emissions, as well as significant co-benefits associated with improved water and air quality, flood alleviation, increased biodiversity, reduced wildfire risk and resulting health benefits to the population. Further benefits of healthy peatlands to Scotland include culture, tourism and wellbeing impacts, and supporting rural economies.[359]
The wider benefits of peatland restoration can be difficult to quantify and monetise compared to costs, resulting in a skewed picture of the benefit-cost ratio to the wider society. As such, the net impact of the peatland policy considered under CCP appears as a net cost, which can be misleading, including in relation to the magnitude of climate change benefits. In modelling the benefits of the CCP it has not been possible at this time to capture all the wider benefits, nor the potential future shift of financing from Scottish Government to a more balanced and shared funding with private finance. This is due to the uncertainty involved in applying non-monetary values to benefits from nature, especially with such a complex habitat and set of ecosystem services as peatlands, as well as the scale of variation around the evolution of the contribution from private finance. There are continued Scottish Government, UK Government and international efforts to improve Natural Capital valuation, and improved methodologies will be explored to better quantify the socio-economic impacts of peatland restoration.
Costs Summary
The Scottish Government funds a significant portion of the carbon reduction through capital grant schemes for peatland restoration administered via the Peatland ACTION programme. However, as noted above, the contribution of responsible and high-integrity private finance is expected to increase over time and meet some of the capital costs in the costs modelling. It is assumed currently that a small portion of the costs of peatland restoration is being covered by private finance.
The methodology for assessing the costs of the peatland policy as for the CCP pathway is based on the trajectory of increasing peatland restoration by 10% each year from the assumed delivery in 2025 to 2030 and maintaining levels after, with some small increases. The costs methodology is based on the CCP emission pathway modelling and the assumed mix of peat types restored across the CCP period with a strong focus on high emitting peat. An internal Scottish Government model was used to model the costs and benefits of the CCP, with data and assumptions outlined below. All benefits have been reported in 2025/26 prices using the latest GDP Deflators.
Total costs of peatland restoration are assumed to be 80% capital costs and 20% resource costs. Capital cost data recorded in Peatland ACTION grant data is used as the basis of modelling. This analysis references the breakdown of capital costs by different peat categories as compiled by SRUC. The dataset matched grant data to peat types according to the Brown et al. (2021) peat condition categories, which enables alignment with the UK GHG Inventory and modelling of costs for different peat categories.[360] It is assumed currently that a small portion of restoration costs is covered by private finance, with the majority covered by public funding. Finally, the modelling considers capital and resource costs but excludes maintenance and other ongoing costs. These could not be incorporated at this stage due to data limitations, but will be investigated further as part of future analytical development.
There are assumptions and uncertainty associated with the costs modelled from the CCP. The capital costs data is based on grant data from 2022 and only from NatureScot, the main delivery partner. Nonetheless, this is the best data available as it has been independently analysed and quality assured, with a process carried out to align costs data with peat condition categories in the UK GHG Inventory.
To ensure robustness, sensitivity analysis was carried out, with low, central and high scenarios for costs based on cost variation present between peat sites. The scenario used in the CCP is the central scenario as agreed by the Scottish Government’s Peatland Science and Technical Advisory Group. The central scenario is based on the 75th percentile of costs, whilst the low scenario is median costs and the high scenario is 90th percentile of costs. The central estimate approach was agreed to account for potential inflation of costs since 2022, and to consider grant data referencing only NatureScot sites, as other delivery partners may face more varied costs (e.g. more forest-to-bog by Forestry and Land Scotland, a more expensive restoration activity).
As such the costs modelling approach is a conservative one, with assumptions reflecting the uncertainty associated with peatland restoration in terms of delivery costs varying considerably by several factors including type of peat and site location, the growth of the restoration industry, and private nature finance anticipated to play a larger role in the future.
Benefits Summary
There are significant benefits to the general population – as well as businesses and Local Authorities – of restoring degraded peatlands, achieving multiple Scottish Government objectives and commitments. Peatlands store carbon emissions whilst also delivering wider co-benefits to society. Restoring peatlands improves habitats, enhances biodiversity, reduces flooding and wildfires, improves water quality, and protects iconic Scottish heritage whilst providing recreation and health benefits. Restoration activity can stimulate local economies and support resilience of supply chains and infrastructure to climate change.
Under the peatland restoration policy over the CCP appraisal period there is an expected total benefit to businesses and landowners of £583 million. The wider co-benefits of peatland restoration to society have not been modelled at this time.
The portion of benefits monetised for the CCP is based on carbon income, as landowners and businesses can voluntarily apply for the IUCN’s Peatland Code to receive carbon credits from peatland restoration. This is a market-based mechanism that turns potential or realised carbon sequestered from peatland restoration projects into potential (Pending Issuance Units – PIU) or realised (Peatland Code Units - PCU) carbon credits, which are a standardised, tradable commodity. As such, this income to businesses and landowners recognises the carbon benefit of the restored peatland as valued by the market. Additionally, to register with the Peatland Code projects must meet the additionality criteria that at least 15% of project funding must come from carbon finance[361].
In terms of general benefits, research suggests the economic value of restored peatlands could range from £130 to £415 per hectare per year when considering a broad range of ecosystem services, and £90 to £210 per hectare per year for climate benefits alone.[362]. Such studies estimate the value people place on the benefits of peatland restoration, such as carbon capture, habitat provision and regulation of water quality. Whilst it is hard to precisely model these wider benefits for the CCP trajectory, these estimates illustrate the socio-economic importance of peatlands.
The Policy, through the Peatland ACTION programme, also encourages the growth of the peatland restoration sector in Scotland. The latest estimates for peatland restoration workforce projections are summarised in the table below.[363] There are caveats to the estimates on job creation,[364] which is why the modelling of the peatland policy package CCP benefits does not include job creation estimates.
| Occupation | Low Demand Scenario (10,000 hectares) | Medium Demand Scenario (100% increase to 20,000 hectares) | High Demand Scenario (250% increase to 35,000 hectares) |
|---|---|---|---|
| Peatland ACTION Partner | 87.9 | 132.0 | 198.0 |
| Agents | 50.0 | 125.0 | 200.0 |
| PC Validators | 5.0 | 12.5 | 20.0 |
| Ecologist/site surveyors | 40.0 | 80.0 | 140.0 |
| Contractors | 200.0 | 400.0 | 700.0 |
| Total | 382.9 | 749.0 | 1,258.0 |
Note: Totals may not sum due to rounding
An internal Scottish Government model was used to model the costs and benefits of the CCP pathway, with data and assumptions outlined below. Data from the IUCN on Peatland Code carbon credit market values, the average emissions reductions per hectare, and the proportion of projects with restoration validated was used to model benefits to businesses and landowners. All benefits have been reported in 2025/26 prices using the latest GDP Deflators.
The benefits modelling is based on the trajectory of increasing restoration by 10% each year from the 2025 assumed delivery to 2030 and maintaining levels after. To avoid overestimating potential carbon credits, the analysis applied the share of Peatland Code projects that have achieved validation and are, therefore, eligible for issuing PIUs. This results in a nine‑year average validation rate of 36%. No lag assumptions were incorporated into the benefits realisation timeline. The current market price of PIUs (£25 as of 2024) was held constant, with no inflationary adjustments modelled.
Overall, this approach considers the monetised long-term benefit of the unrealised asset value of the carbon value from the peatland restoration. These long-term benefits are not fully realised until the PIUs are verified and converted into PCUs and can be classed as a stock asset to the businesses and landowners. The CCP analysis does not model the PCUs due to uncertainty in the nascent market given the first PCUs have been converted in 2025. Finally, the range of significant co-benefits of restoration is not reflected in the market prices of PIUs, as such the modelled benefits to businesses are not inclusive of wider co-benefit value.
There are assumptions and uncertainty associated with the benefits modelled from the CCP. Market fluctuation in demand and prices could significantly impact the projected benefits. The Peatland Code is still a nascent, emerging market serving as a voluntary certification standard in the UK for carbon-financed restoration projects. As such, demand could be significantly impacted by any changes to introduce more compliance or regulatory measures, such as a carbon land based tax or if nature-based carbon reductions were to be integrated in the UK ETS.[365]
Additionally, it is important to note there exist different methodologies for monetising carbon and other benefits of peatland restoration, as outlined below for context. Whilst the direct benefits of carbon reduction can be measured by tracking emissions reductions, these can then be monetised using one of two proposed methods:
1. Carbon credits from registering restoration with the voluntary Peatland Code. These credits currently have a value of around £25 (in 2024) and represent 1 tonne of CO2 equivalent (tCO2e) emissions saved from restored peatland. The price of each credit reflects the market traded value of carbon.
2. UK Government carbon value for policy appraisal. The non‑traded (i.e., whole-economy) carbon values from the Green Book supplementary guidance representing the value society places on avoiding a tonne of CO2e. DESNZ sets a central carbon value of £273 per tonne CO2e for 2025 (2022 prices).[366]
To avoid double counting the value of carbon, it is recommended the two values cannot be used in combination, but they are shown to reflect the different scope of economic valuation. The CCP modelling has adopted the carbon credits market-based approach, as outlined above.
Technical Uncertainties
Emissions
Peatland emissions are underpinned by modelled estimates rather than direct, site specific measurement. Emissions estimates are, therefore, subject to uncertainty associated with the use of default emission factors, which may not fully capture the heterogeneity of Scottish peatland condition, hydrology and management history. There is currently no agreed emission factor for forest‑to‑bog restoration, requiring the use of proxies and assumptions that introduce additional uncertainty.
There is also scientific uncertainty regarding the lag time between peatland restoration activity and the resulting reduction in GHG emissions, with evidence suggesting variable response times depending on site condition and restoration method. This affects both the timing and magnitude of emissions reductions assumed in the pathway. In addition, proposed corrections to peatland area data introduce further uncertainty in the scale of emissions attributed to peatlands. The timing of any such revisions is dependent on the UK GHG Inventory update process, which is externally managed and, therefore, introduces additional uncertainty regarding when corrections are formally incorporated into reported emissions.
Accuracy of pathway estimates will be maintained through ongoing review of inventory updates, methodological developments and emerging scientific evidence, ensuring future revisions reflect the best available understanding of peatland emissions dynamics.
Costs and benefits
Cost estimates for peatland restoration are subject to uncertainty due to incomplete and evolving evidence on the real costs of delivering restoration across different peatland types and site locations. Further uncertainty arises from the interaction between future policy design, supply‑chain capacity, and emerging private‑sector finance models. As the sector scales up, costs may shift due to contractor availability and investments in equipment. In addition, improvements to peatland mapping and emission factors might influence the estimated cost‑effectiveness of restoration.
Benefit estimates are subject to uncertainty based on future developments in the voluntary and compliance carbon markets, including the rate of uptake of the Peatland Code. Market fluctuation in carbon credits demand and prices has the potential to significantly shift the projected benefits, therefore, creating significant uncertainty around the magnitude of benefits. Demand could be further impacted by any changes to introduce more compliance or regulatory measures in Scotland.
Dependencies
The pathway estimates are dependent on the following:
- available public and private finance: sustained public funding, stable high-integrity private‑sector investment, increased participation via the Peatland Code, and the availability of blended finance models that enable long‑term project viability,
- operational and supply chain: skilled and scalable restoration supply chain, including contractor capacity and specialist machinery,
- land-use: land‑use decisions made with farmers, crofters and estate managers to ensure restoration aligns with land management priorities, and
- condition and emissions mapping: improvements to peatland mapping, emission factor refinement and the timing of UK GHG Inventory methodological updates, which influence both baseline estimates and the realisation of projected emissions savings.
Each of these factors have been considered as part of the approach to the estimation of the peatland pathway.
Delivery
Delivery considerations focus on existing grant funding and encouraging responsible high-integrity private investment, as well as regulatory and enabling conditions to meet the emissions pathway given under the peatland restoration targets.
CCP Policy List
Buildings (Residential and Public)
This table can be found within the supporting document PDF Annex 3 - Annalytical Annex.
Transport
This table can be found within the supporting document PDF Annex 3 - Annalytical Annex.
Waste
This table can be found within the supporting document PDF Annex 3 - Annalytical Annex.
Energy Supply
This table can be found within the supporting document PDF Annex 3 - Annalytical Annex.
Business and Industrial Process (including NETs)
This table can be found within the supporting document PDF Annex 3 - Annalytical Annex.
Agriculture
This table can be found within the supporting document PDF Annex 3 - Annalytical Annex.
LULUCF
This table can be found within the supporting document PDF Annex 3 - Annalytical Annex.
Contact
Email: ClimateChangePlan@Gov.Scot