Scotland's Carbon Footprint 1998 – 2019
Estimates of Scotland's greenhouse gas emissions on a consumption basis for the period 1998 to 2019.
Breakdown of Scotland's Carbon Footprint, 1998-2019
Table 1 outlines how the Carbon Footprint has been categorised for this publication.
| Main Category | Activity | Description |
|---|---|---|
| Greenhouse Gas Emissions from UK Produced Goods and Services | Scottish consumption of UK production | UK production emissions attributable to Scottish final consumption, including manufacturing and transport, international aviation and shipping provided by Scottish operators. |
Greenhouse Gas Emissions Embedded in Imported Goods and Services – By Region of Import
|
Imports used by UK businesses for Scottish consumption | Greenhouse Gas Emissions associated with the production of imports which are used by UK industry and attributable to Scottish final consumption |
| Imports directly used by Scottish consumers | Greenhouse Gas Emissions associated with the production of imports which are used by Scottish final consumers | |
| Greenhouse Gas Emissions Directly Produced By Scottish Residents | Private motoring | Greenhouse Gas Emissions generated directly by households through private motoring. |
| Household heating | Greenhouse Gas Emissions arising from households' use of fossil fuels for heating, households use of aerosols, etc. |
Chart 2 shows Scotland's carbon footprint, broken down into three main components, from 1998 to 2019.
- Greenhouse gas emissions embedded in imported goods and services from overseas. These accounted for 58.0 per cent of Scotland's carbon footprint in 2019; up from 48.7 per cent in 1998.
- Greenhouse gas emissions embedded in UK produced goods and services. These accounted for 25.6 per cent of Scotland's carbon footprint in 2019; down from 37.8 per cent in 1998.
- Greenhouse gas emissions directly produced by Scottish residents. These account for 16.4 per cent of Scotland's carbon footprint in 2019; up from 13.5 per cent of total consumption-based emissions in 1998.
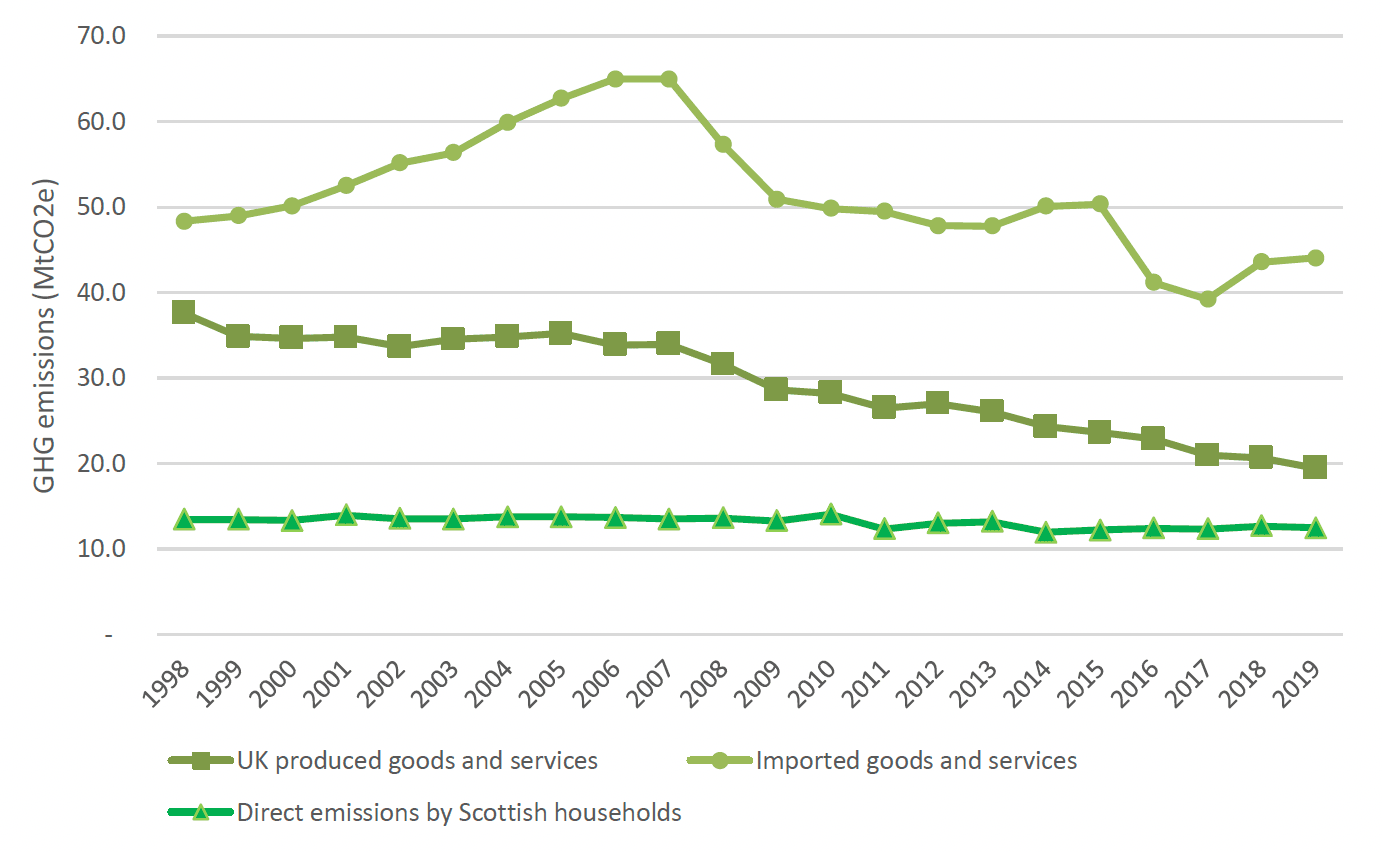
Additionally, Chart 2 shows that:
- Greenhouse gas emissions associated with imported goods and services increased from 48.3 MtCO2e in 1998 to their peak of 65.0 MtCO2e in 2007 (an increase of 34.4 per cent over this time period). These emissions accounted for 57.8 per cent of Scotland's carbon footprint in 2007.
- Between 2007 and 2019, greenhouse gas emissions embedded in imported goods and services fell by 32.3 per cent; this compares with a 8.9 per cent reduction in emissions embedded in imports over the whole time period from 1998 to 2019.
- Greenhouse gas emissions relating to the consumption of UK produced goods and services by Scottish residents fell from 37.6 MtCO2e in 1998 to 19.4 MtCO2e in 2019 – a fall of 48.3 per cent. There was a year-on-year fall in greenhouse gas emissions from this category over the majority of years in the time period.
- Greenhouse gas emissions generated directly by Scottish residents have fallen from 13.4 MtCO2e in 1998 to 12.4 MtCO2e in 2019 – a fall of 7.4 per cent over this time period.
Chart 3 shows the change in the components of Scotland's carbon footprint. In total, the carbon footprint fell by 23.4 MtCO2e (23.6 per cent) between 1998 and 2019.
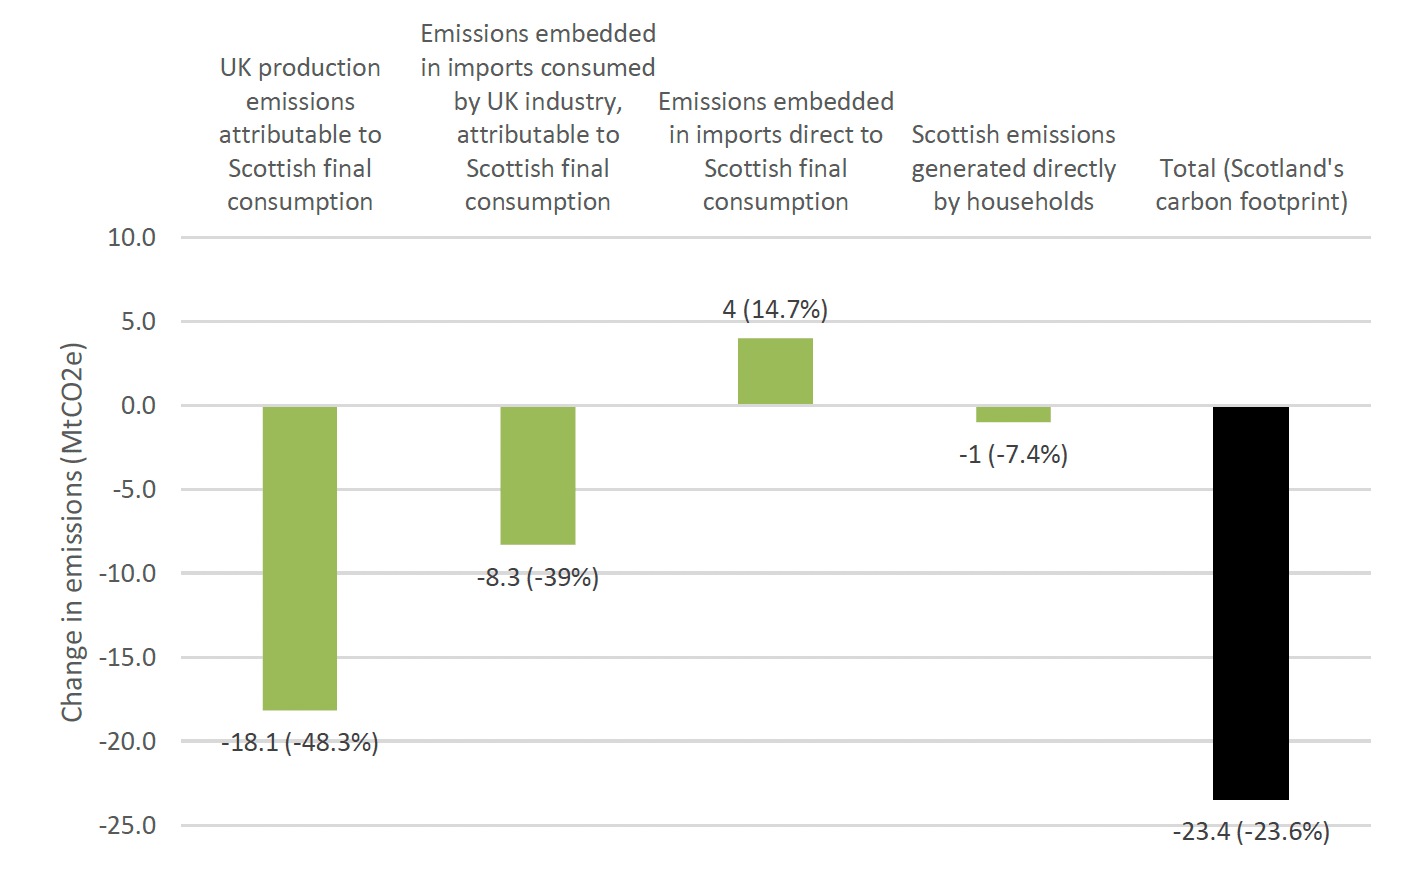
Chart 3 shows that between 1998 and 2019:
- Greenhouse gas emissions from Scottish consumption of UK production have seen the greatest absolute reduction over this time period (18.1 MtCO2e; a 48.3 per cent reduction), reflecting the emissions-reduction in territorial emissions seen in the Scotland and the rest of the UK over this period.
- Greenhouse gas emissions embedded in imports directly used by Scottish consumers have increased by 4.0 MtCO2e (a 14.7 per cent increase).
- Emissions embedded in imports used by UK businesses for Scottish consumption have decreased by 8.3 MtCO2e (a 39.0 per cent decrease).
- Greenhouse gas emissions generated directly by households (via heating and personal transport) have decreased by 1.0 MtCO2e (a 7.4 per cent reduction).
Chart 4 shows how Scotland's carbon footprint has changed from its peak in 2006 to 2019. Scotland's carbon footprint has fallen by 36.5 MtCO2e (32.5 per cent) over this time period.
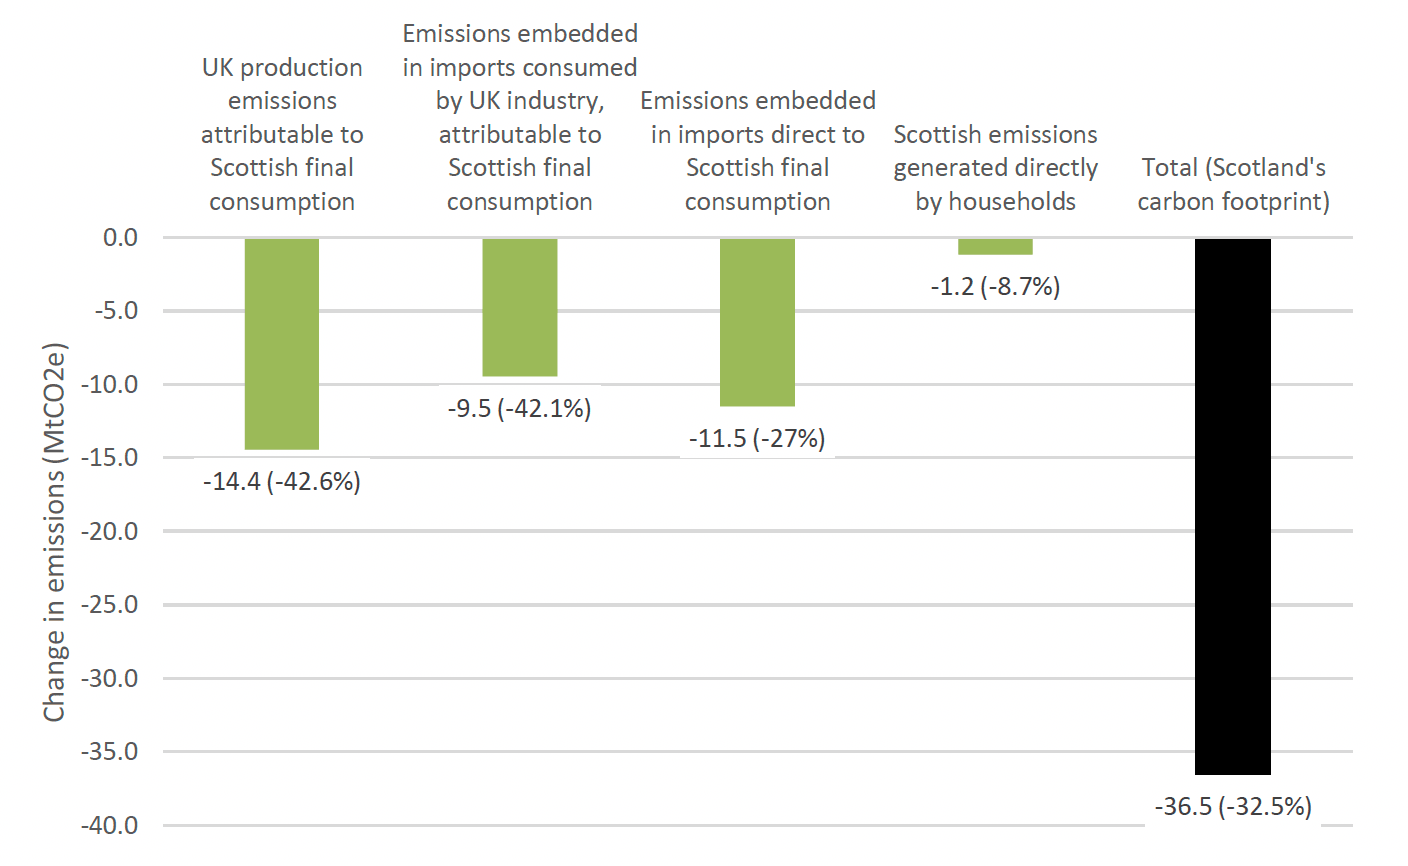
Chart 4 also shows that between 2006 and 2019:
- Greenhouse gas emissions associated with Scottish consumption of UK produced goods and services decreased by 14.4 MtCO2e ( a fall of 42.6 per cent).
- Emissions embedded in Scottish consumption of imports fell by 11.5 MtCO2e (27.0 per cent).
- Emissions embedded in imports used by UK businesses for Scottish consumption decreased by 9.5 MtCO2e ( a fall of 42.1 per cent).
- Greenhouse gas emissions directly emitted by Scottish households have seen smaller reductions of 1.2 MtCO2e ( a fall of 8.7 per cent).
Chart 5 shows that Scotland's carbon footprint fell by 1.0 MtCO2e (1.3 per cent) in the latest year.
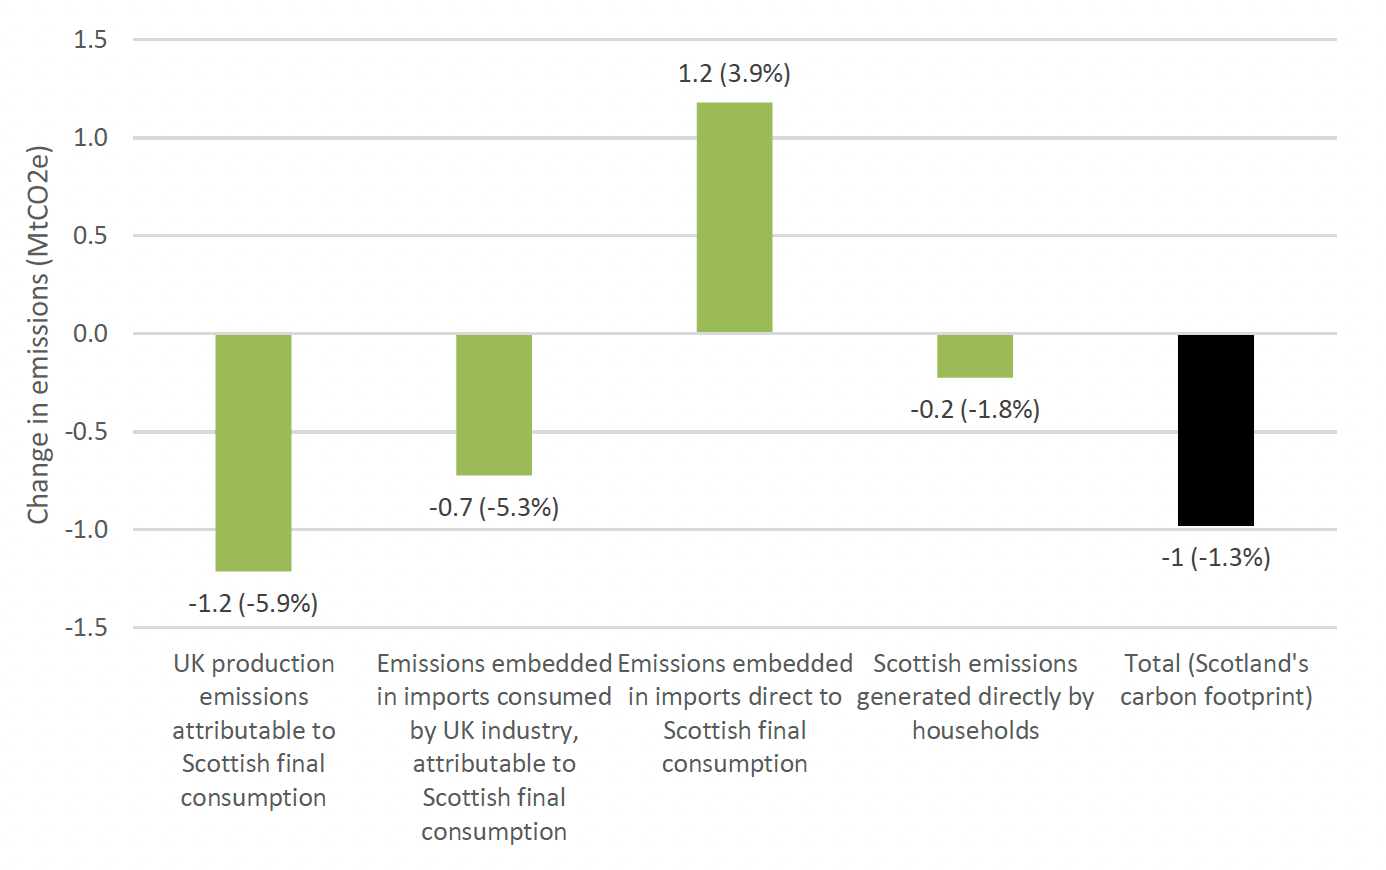
Chart 5 also shows that between 2018 and 2019, consumption of imported goods and services directly by Scottish consumers was the only component of Scotland's carbon footprint to rise in the latest year:
- Embedded emissions in imports directly consumed in Scotland rose by 1.2 MtCO2e (3.9 per cent).
- Emissions embodied in Scottish consumption of UK production fell by 1.2 MtCO2e (5.9 per cent).
- Emissions embedded in imports used by UK businesses for Scottish consumption also fell by 0.7 MtCO2e (5.3 per cent).
- There was a relatively minor reduction in the level of emissions directly generated by Scottish households of 0.2 MtCO2e (1.8 per cent).
Figure 1 below shows all flows of embedded emissions from country of origin to their final consumption sector, and the route taken, for 2019. The diagram shows that:
- Around 42 per cent of embedded emissions associated with the consumption of goods and services in Scotland, originate from the UK.
- Imported emissions account for around 58 per cent of total consumption-based emissions; with the European Union, China and Rest of World (excluding other named areas) being the largest sources.
- A substantial majority of imported emissions are directly "consumed" by Scottish households and other final demand sectors.
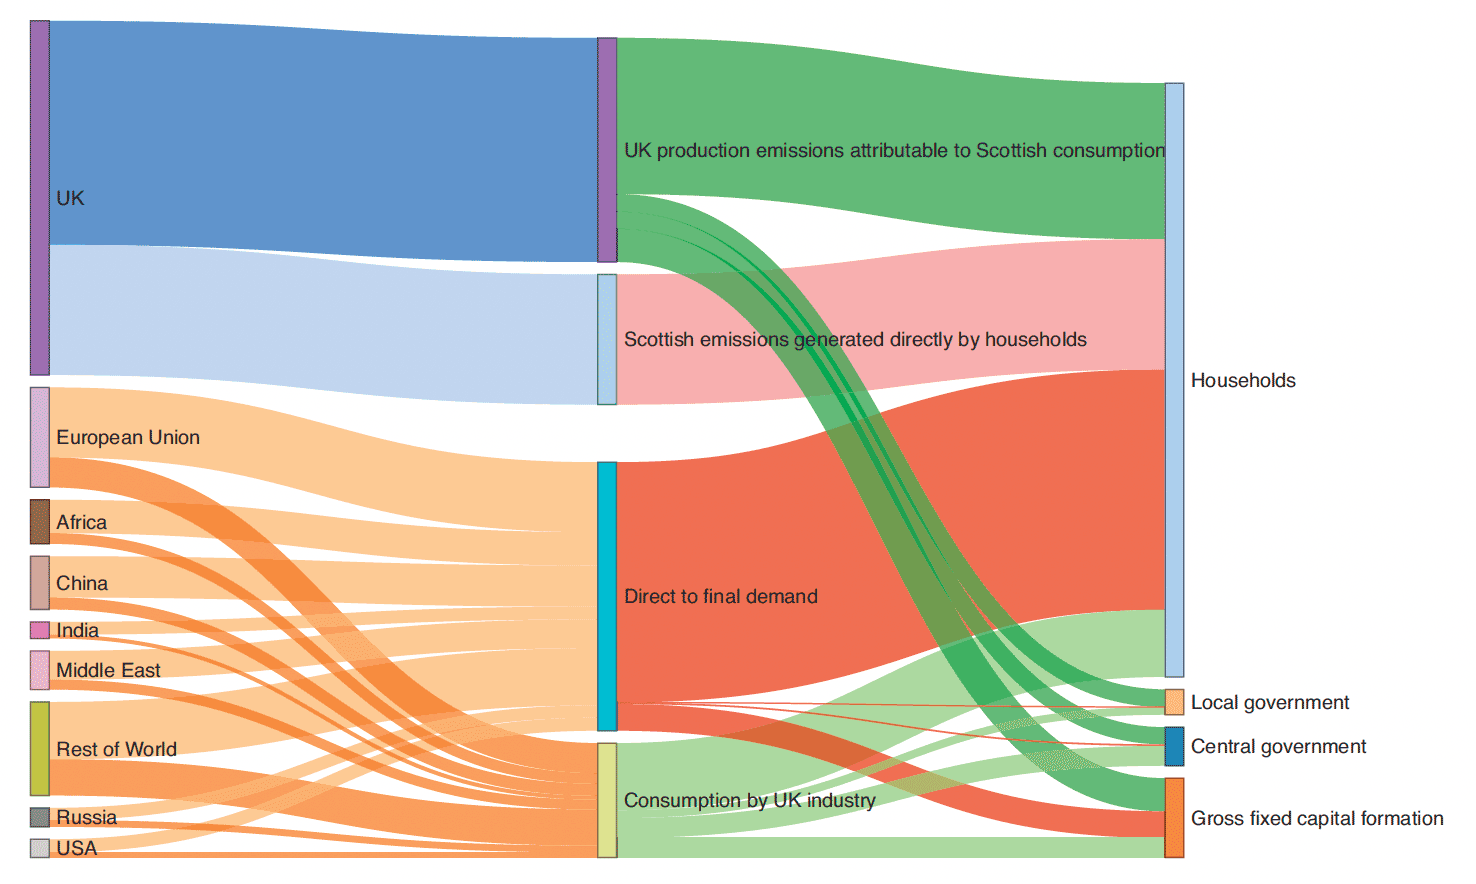
Additionally, figure 1 above shows that households account for the overwhelming majority (around 79 per cent) of consumption-based emissions. With capital investment and other types of capital formation accounting for around a further 15 per cent of total consumption-based emissions.
Chart 6 presents a breakdown of Scotland's embedded greenhouse gases by region of import over time.
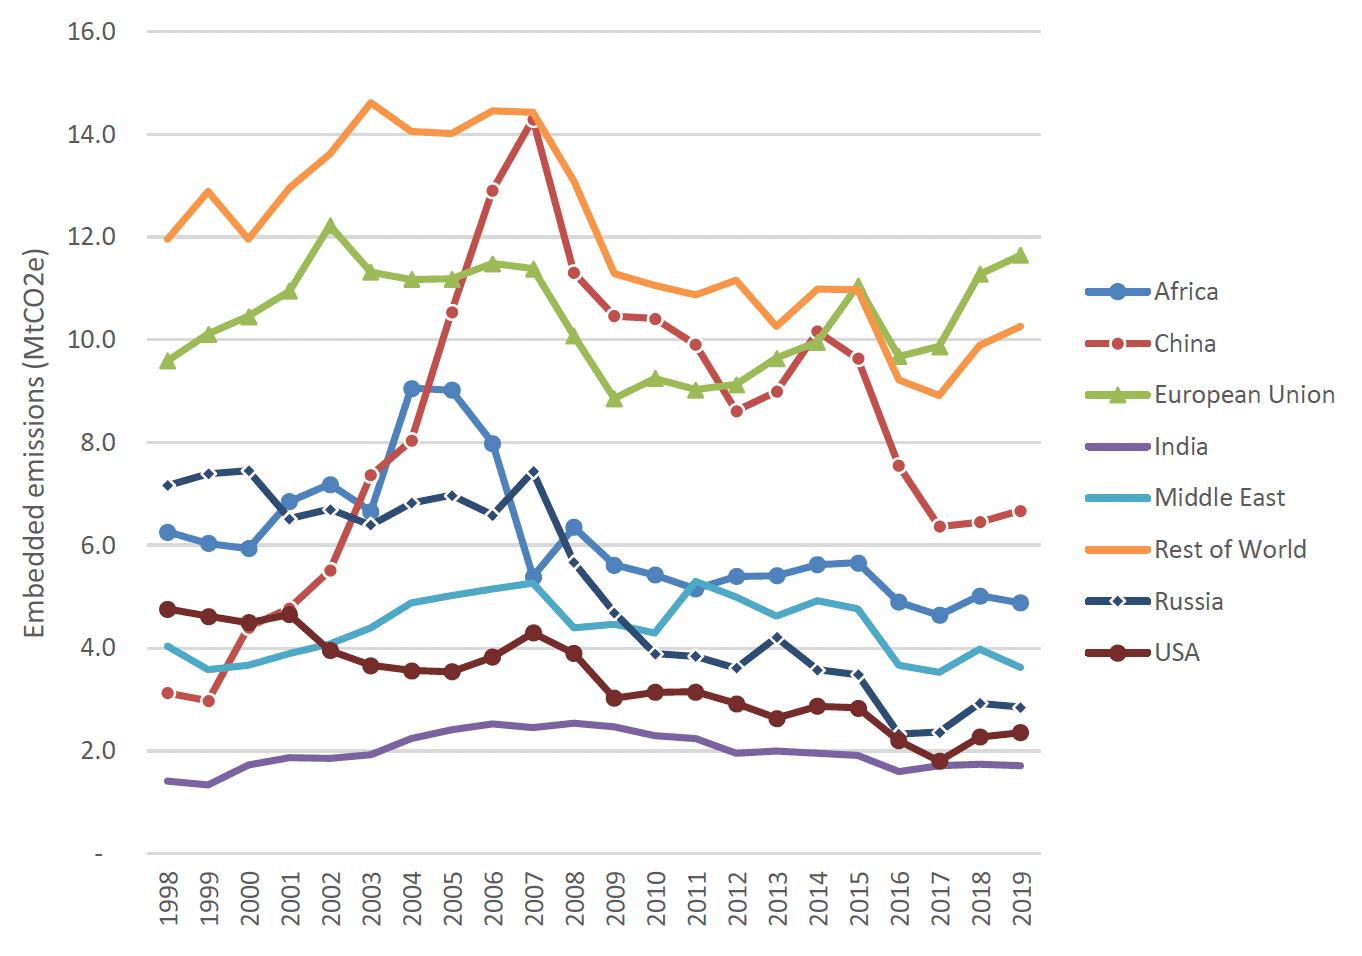
- The most striking aspect of the above chart relates to the very rapid increase in embedded emissions from China between 1999 and 2007, followed by a rapid reduction in the years immediately afterward until 2013. Between 2014 and 2017, these emissions decreased consistently but show modest growth in 2018-2019.
- Consumption emissions from Rest of world plateaued during the period 2003-2007 and have shown a declining trend since that time. Similarly to China there is some evidence of increased emissions in 2018 and 2019.
- Embedded emissions originating from Russia and the USA have shown considerable year-on-year volatility although they have shown a generally reducing trend across the time-series and have reduced by 60 per cent (Russia) and 50 per cent (USA) since 1998.
- Embedded emissions originating from China, European Union and India are the only regions to show increased emissions over the period 1998-2019.
Contact
Email: CCStatsModelling@gov.scot