Scotland's Carbon Footprint 1998 – 2019
Estimates of Scotland's greenhouse gas emissions on a consumption basis for the period 1998 to 2019.
Energy footprint for Scotland (Experimental Statistics)
All results in this section are designated as experimental statistics. These are defined as new official statistics undergoing development and testing. The methods, data sources and results in this section are open for ongoing consultation with users, and we welcome feedback on all aspects of the statistics. All users should be aware that the results in this section are provisional and will be revised and updated when further developments are made. They should therefore be used with appropriate caution at this time. We welcome any thoughts or views on this analysis, including intended uses and alternative presentations by users. Please contact andrew.mortimer@gov.scot
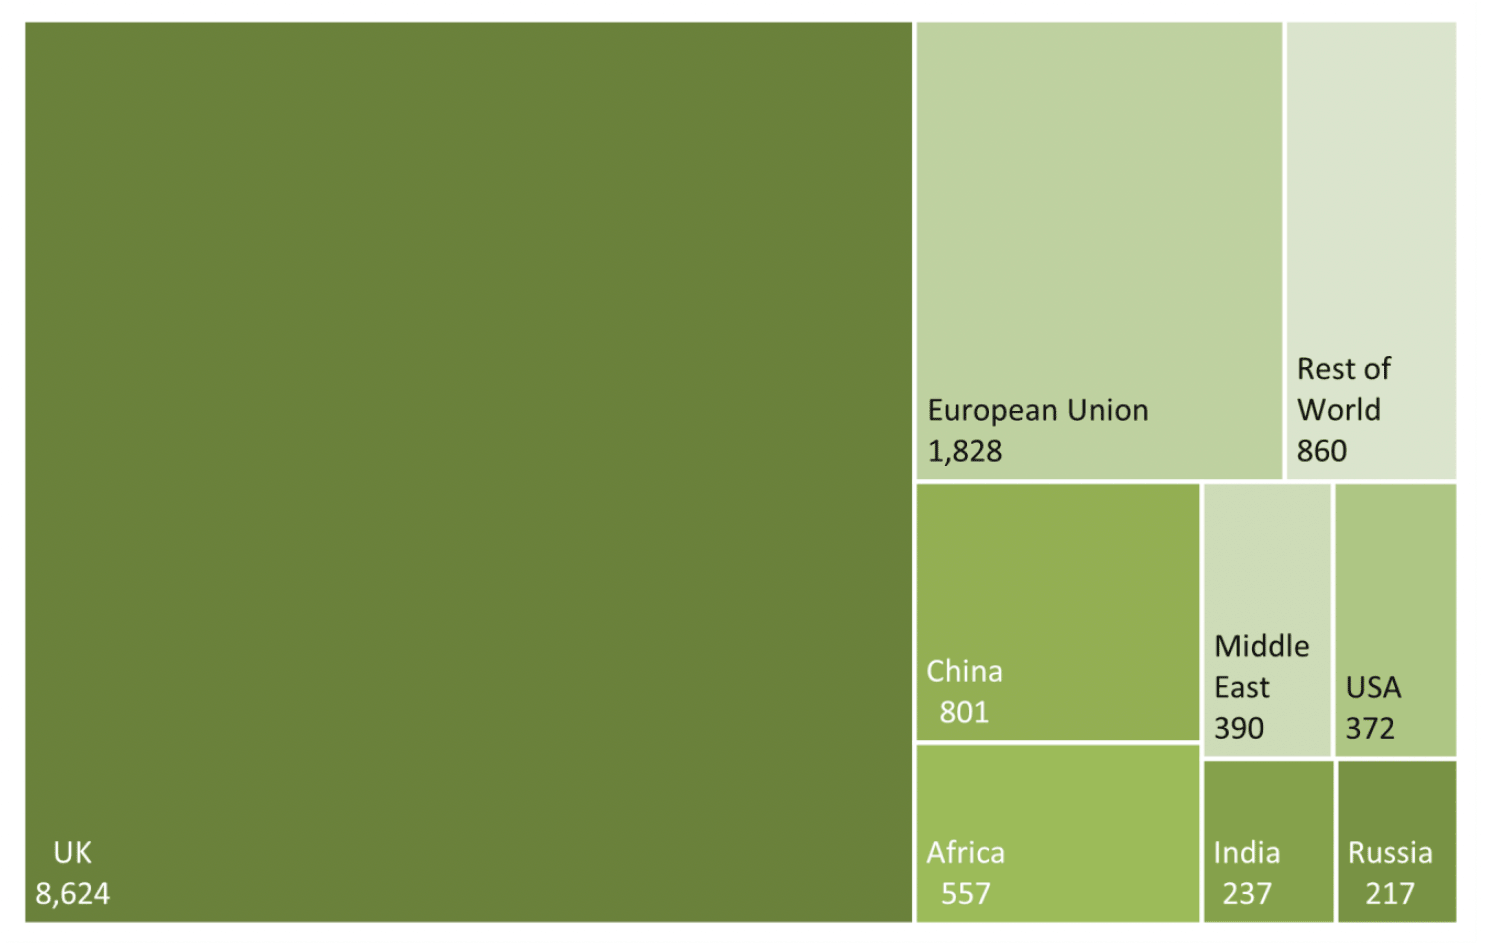
Chart 12 above shows the embedded energy use by country of origin in 2019 associated with final consumption in Scotland.
The UK provides the majority of energy used, or consumed indirectly, by Scottish consumers and in 2019, energy equal to around 8.6 million tonnes of oil was consumed from the UK. At the equivalent of around 1.8 million tonnes of oil, the European Union provided the next most substantial souce of embedded energy consumed in Scotland.
The data used to construct the energy footprint is conceptually very similar to the carbon footprint. As such, subject to further development, most of the analyses presented for the carbon footprint in this release could be replicated for this energy footprint and presented in future editions of this publication.
Contact
Email: CCStatsModelling@gov.scot