Scotland's Carbon Footprint 1998 – 2019
Estimates of Scotland's greenhouse gas emissions on a consumption basis for the period 1998 to 2019.
Material footprint for Scotland (Experimental Statistics)
All results in this section are designated as experimental statistics. These are defined as new official statistics undergoing development and testing. The methods, data sources and results in this section are open for ongoing consultation with users, and we welcome feedback on all aspects of the statistics. All users should be aware that the results in this section are provisional and will be revised and updated when further developments are made. They should therefore be used with appropriate caution at this time. We welcome any thoughts or views on this analysis, including intended uses and alternative presentations by users. Please contact andrew.mortimer@gov.scot
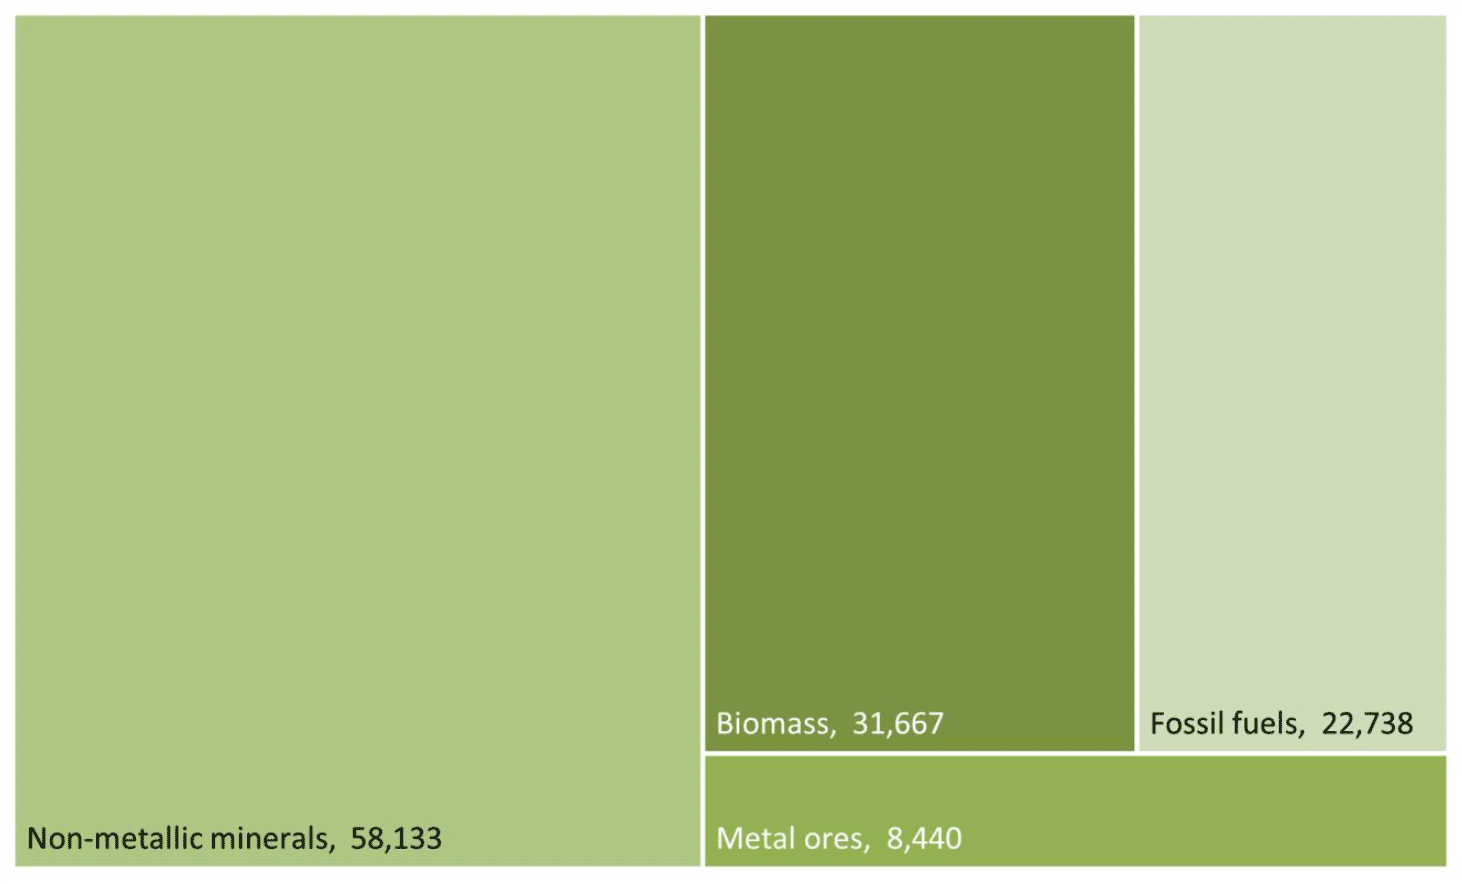
Chart 13 above shows the total materials used directly or indirectly by Scottish consumers, by the type of material used.
Non-metallic minerals (for example construction materials) are the single largest input required to meet final demand in Scotland. In 2019, around 58 million tonnes of these materials were used globally to meet Scottish demand. Biomass (for example, food, wood) had the second largest demand, with around 32 million tonnes of these materials were required to meet Scottish final demand. Fossil fuels (23 million tonnes) and Metal ores (8 million tonnes) made up the balance of the 121 million tonnes of total materials required globally to meet Scottish final demand.
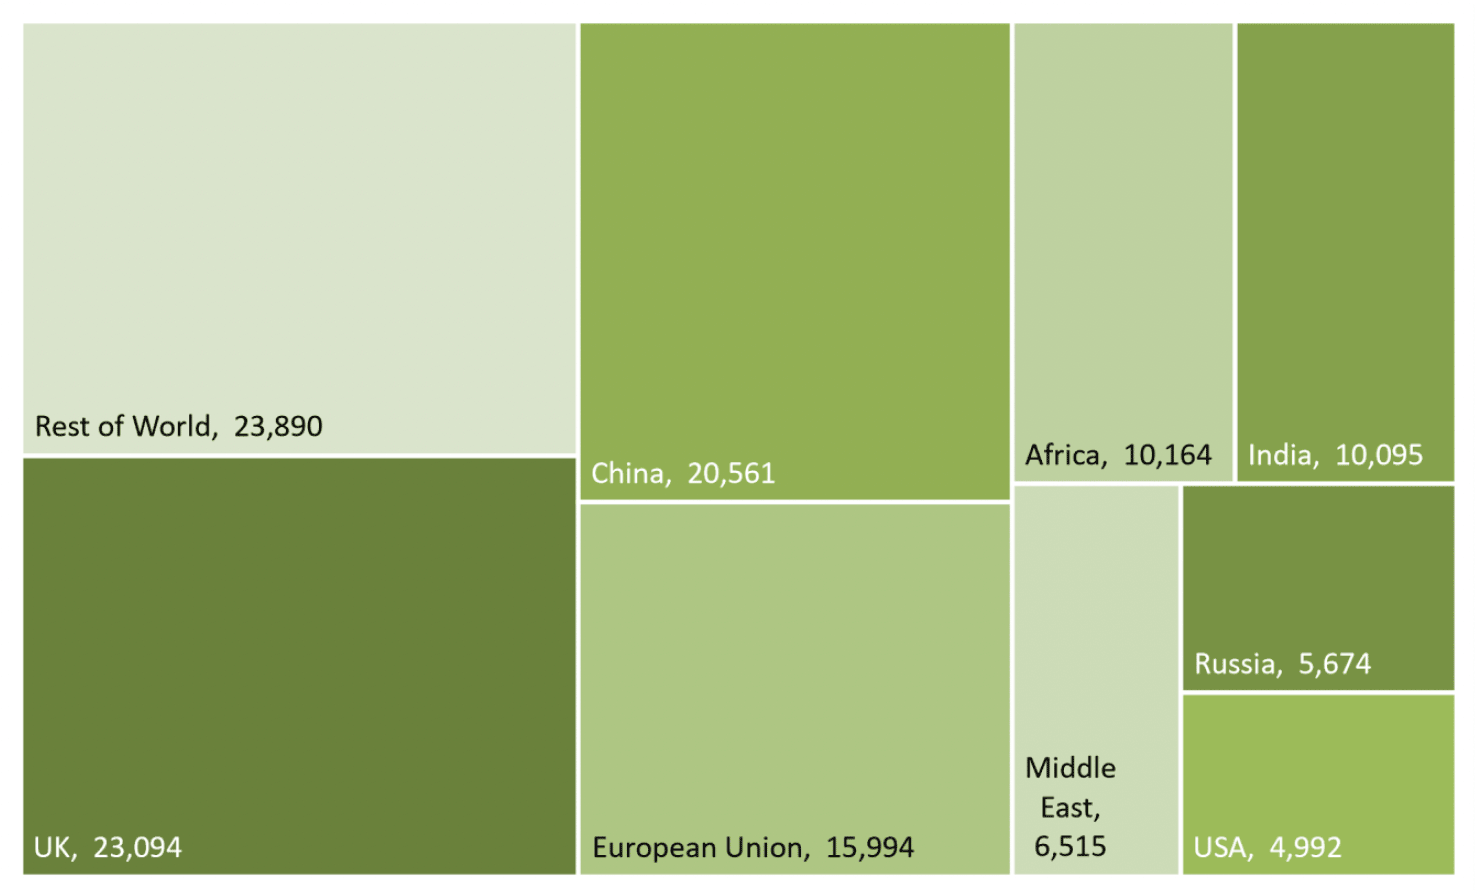
Chart 14 above shows the embedded material requirements by country of origin in 2019 associated with final consumption in Scotland.
The Rest of the world (exluding countries not elsewhere specified) was the single largest source of materials required to meet final demand in Scotland and required around 24 million tonnes of all materials.
In 2019, around half of all materials consumed in Scotland were sourced from the UK, China and the European Union combined.
Contact
Email: CCStatsModelling@gov.scot