Tuberculosis - RNOH/GIRFT review: national report
The GIRFT Tuberculosis (TB) report is a comprehensive, data-driven national review of TB services across Scotland.
10 Management of TB
This section includes the bulk of clinical activities related to TB management. The scene is set by looking at the infrastructure and activity of outpatient and inpatient work, recognising that the bulk of TB care is as an outpatient or in the community. A proportion of patients will receive inpatient care either as an admission that leads to a diagnosis or when admitted, potentially as a day case or short length of stay as part of a diagnostic pathway, e.g. fibre optic bronchoscopy.
The subsequent section looks at the important aspect of delays in management, while identifying patients for supportive treatment using enhanced case management tools is discussed in the context of directly (DOT) and video observed therapies (VOT). The key aspect of management is to ensure effective treatment and that issues of drug resistance are actively managed. This section is followed by one on medicines management that includes aspects of pharmacist staffing. The management section concludes by looking at the increasing pressures of non-tuberculous mycobacteria, aspects of inclusion health, and we have pulled the bulk of information generated into a specific children and young person’s (CYP) section, 10.12.
10.1 Outpatient Setting
In the pre-visit TB survey, some of the questions were designed to help us understand the outpatient department (OPD) clinic structures. There were few nurse led clinics undertaken weekly, as per Figure 17, with 27% being nurse-led as per Figure 7. It is worth noting that 67% of CYP services do not have nurse support, as shown in Figure 18.
There were more medical clinics, as per Figure 19, but with a greater distribution, reflecting the size of the service. A key aspect, especially in larger services, is the facility to review patients at short notice for either assessment of side effects or to initiate treatment. Unfortunately, as shown in Figure 20, only one provider had this level of flexibility, and we heard from colleagues in the deep dives that they would add extra patients onto ordinary clinics or attempt to see patients whenever and wherever a clinic room could be found. This added to the administrative burden and was not always at a time when the TB nurse could be present.
While additional clinics could be established at times of an outbreak, there were no routine weekend and evening clinics for the TB population in Scotland.
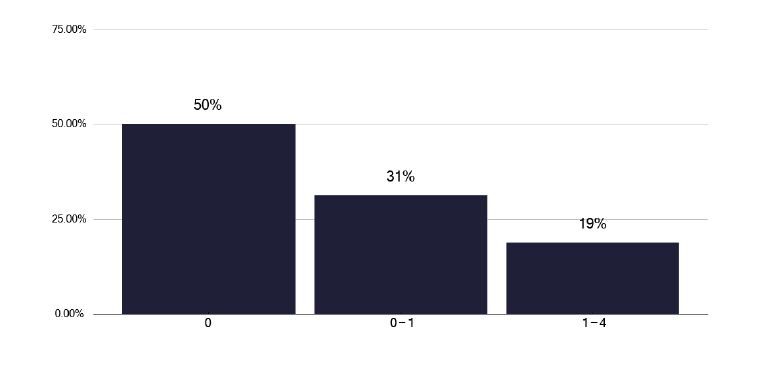
How many nurse-led clinics are there per week?
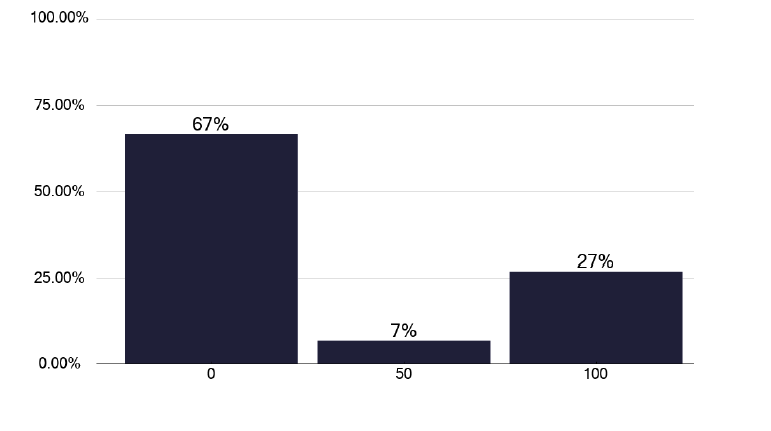
What proportion (%) of CYP have TB nurse support?
Do you have a dedicated TB clinic space that you can access at any time (i.e. that is not part of the general OPD service?)
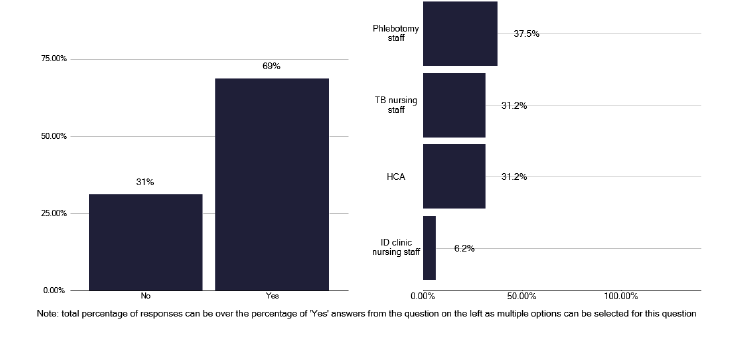
Access to phlebotomy is important for checking HIV status and monitoring liver function tests (LFTS). Within the actual clinic, as shown in Figure 21, 69% of services could access phlebotomy, but in one third of services, this was done by the TB nursing staff, which is not a good use of senior nursing time. Regarding checking for HIV, we noted in Figure 22 that there was a high percentage of tests done in notified patients and that the number of notifications did not make a difference to the number of tests performed. Likewise, there was good coverage for blood borne viruses as in Figure 23.
Checking the liver function tests is an important part of surveillance for potential side effects. As seen in Figure 24, there was some variability in when LFTs were checked and for some services a more standard approach should be considered, with a formal review to understand what resources are needed and available. We heard examples of good practice during the deep dive meetings where bloods were checked in community phlebotomy services and the patient phoned the nurse to say they had been done, and the nurse would check the results. This is a very effective way of monitoring to reduce patients attending the TB clinic, though much of this routine work could be undertaken by lower banded staff, to free up the more senior TB nurses.
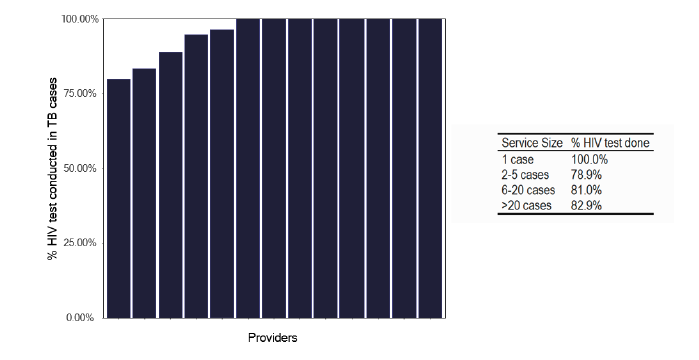
Percentage of HIV tests done in notified TB cases in 2022
Note: Time period includes notified cases between January 2022 and December 2022. The data source is Enhanced Surveillance of Mycrobacterial Infections (ESMI) system.
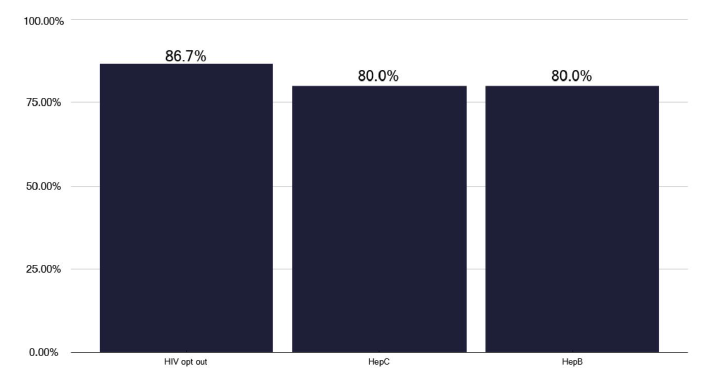
Does your service routinely offer BBV testing? Please indicate what are offered below.
Note: Total percentage of responses can be over 100% as multiple options could be selected for this question.
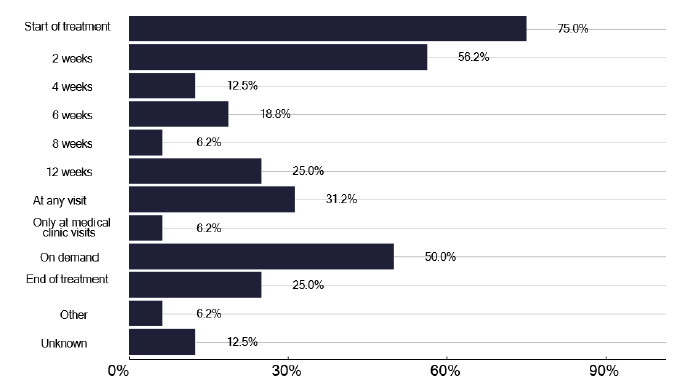
How often are liver function tests performed? (Select all that apply)
Note: Total percentage of responses could be over 100% as multiple options could be selected for this question.
We also asked about the frequency of eye checks, recognising the difficulty in some Health Boards with the geography and limitation of patients needing to re-attend for regular eye checks. Three quarters of services undertook some eye checks at different time points, as in Figure 25. Some services did the eye check in clinic, while other services referred patients to hospital-based ophthalmology services, potentially adding to the clinic wait for the patient, increasing the risk of infection transmission or creating a need to attend at a later time, adding to the patient burden of clinic visits. Whether opticians local to the patient could consider undertaking eye checks for those patients who live remote from the TB clinic was not discussed during deep dives.
We heard of good practice during several deep dives about alternative ways of managing patients with infectious disease, without attending clinics minimising risk to others. When patients did need to attend, attempts were made to minimise contacts with other patients, though this was not enshrined in SOPs. Unfortunately, not all services had dedicated TB clinics, where all the patients were seen and we heard that patients with TB could attend general respiratory and ID clinics, waiting in the same room as potentially immunocompromised patients, with the risk of disease transmission. To explore this further, we asked about the number of air exchanges in clinic, as seen in Figure 26. Only 20% knew if there was appropriate ventilation for potentially infectious patients and only one third of those who answered had sufficient air exchanges, highlighting the need for both understanding the potential air exchanges and the risks to patient and colleagues.
We welcome the ongoing work by the Antimicrobial Resistance and Healthcare Associated Infection (ARHAI) team that is part of NHS National Services Scotland, who are carrying out a literature review of transmission of respiratory infections, including reviewing the current classification of 'airborne' and 'droplet' transmission. They will recommend new definitions for modes of transmission along with considerations for infection prevention and control in healthcare settings. These will form the basis of recommendations for the National Infection Prevention and Control Manual which will include TB in their recommendations.
Clinic activity by doctors or nurses is not readily captured, and in contrast to England where some procedures may be coded and therefore lead to payment via a specific Health Resource Group, no such activity coding takes place for procedures such as DOT, BCG administration in Scotland. It is therefore difficult to identify clear funding for any activity undertaken as an outpatient activity.
Recommendations: Outpatient settings
22. Ideally nurses and medical staff should run joint clinics, with nurses also having their own nurse-led clinics. For CYP services, nursing time should be made available.
P, HB
23. Infrastructure needs to be in place for efficient running of clinics which includes ready access to clinic rooms when needed, supported by clinic booking staff or ideally TB administration staff to contact the patient.
P, HB
24. Phlebotomy services in clinics should be available without the need for qualified nursing staff to be involved.
P, HB
25. For patients living at a distance from the TB service, alternative models of Liver Function Tests (LFT) surveillance should be explored.
P, HB
26. Infection prevention issues should be explored for Outpatient Departments (OPDs) in all TB services to minimise the risk to all parties. This should include a clear understanding of clinic air exchanges per hour and mitigation of potential risks, documented in a formal protocol or SOP. The output from the review above will help inform discussion.
P, HB
27. To understand clinic activity and the procedures undertaken, data collection should be considered at a national level, possibly linked to a payment process.
P, HB, N
10.2 Inpatient Activity
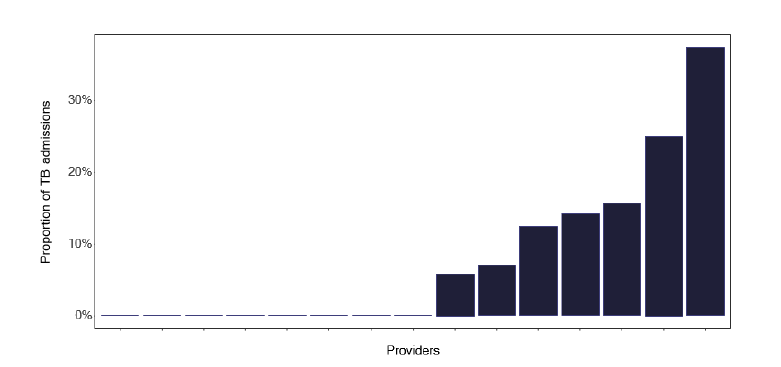
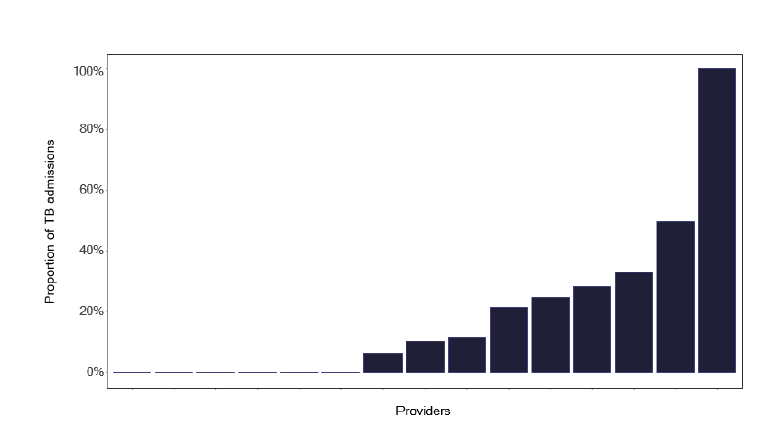
We explored admitted patient activity using SMR01 and survey data where tuberculosis was the main reason for admission. Some patients may be admitted following an acute presentation while for others it may be for diagnostic tests such as bronchoscopy or induced sputum. Figure 27 shows the absolute number of admissions in the 12-month study period, but, recognising the marked variation in notifications, Figure 28 shows the proportions admitted. This information is complex but each site specific data pack provided the granularity required for further review. Surprisingly, Figure 29 shows that there were few pulmonary cases, but in almost all deep dives, where there were sufficient admitted numbers, the attendees disagreed with this finding, suggesting that discharge letters or coding is not as accurate as it should be. This may be important if such data is used to map requirements for negative pressure facilities, see Figure 13 in the Diagnostics section 9.2 or for side rooms that are really needed if pulmonary disease is suggested.
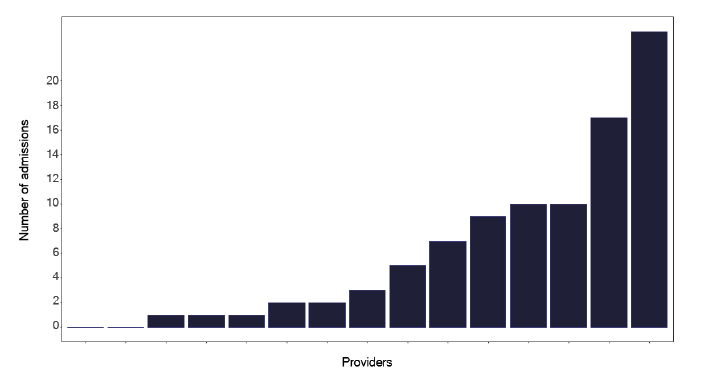
Note: Time period includes inpatient/day case admissions between January 2022 and December 2022. The source is the Scottish Morbidity Record (SMR01) dataset.

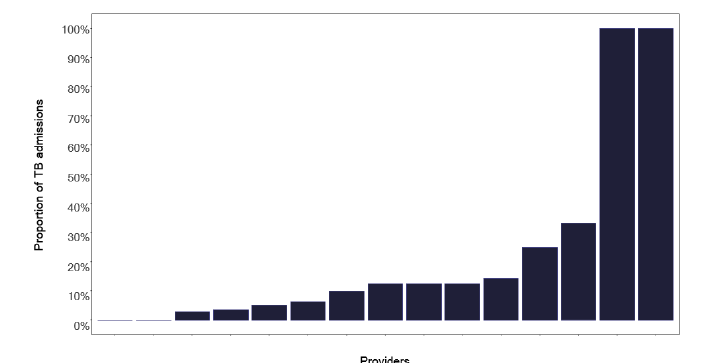
Note: Time period includes inpatient/day case admissions between January 2022 and December 2022. The source is the Scottish Morbidity Record (SMR01) dataset.
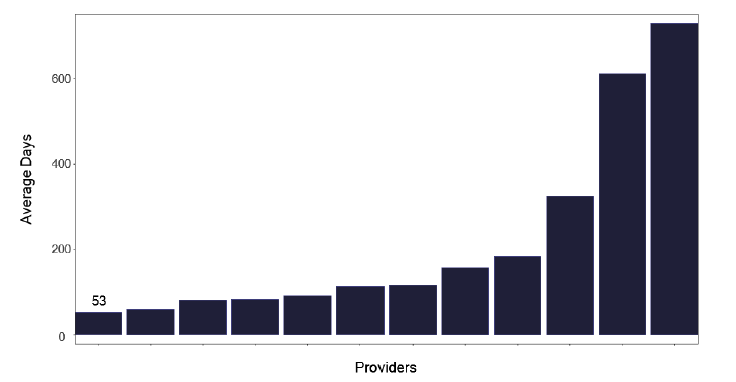
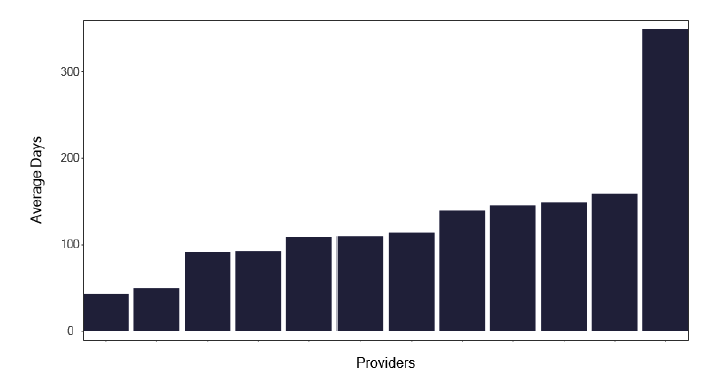
The average length of stay of patients with tuberculosis for each service is shown in Figure 30. We did identify outliers where individuals appear to have a long length of stay, as in Figure 31, which may distort this information.
Services and Health Boards should review their information to see if this is a data recording issue or whether some patients are hospitalised for greater than 28 days. If the information is confirmed as correct, the issues leading to the long delay should be addressed and form part of a cohort review discussion. We wondered if there were also patients with a short length of stay, who may have been attending for an investigative procedure. There was some variation, as in Figure 32, but generally, given the small numbers of notifications and subsequent admissions, it is difficult to draw too many conclusions.
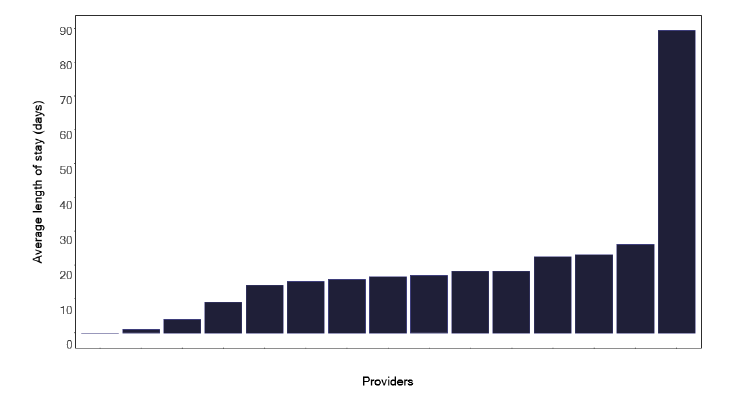
Notes: (1) A long stay admission is defined as a non-paediatric (17+ years) admission with a primary TB diagnosis lasting more than 28 days.
(2) Time period includes inpatient/day case admissions between January 2022 and December 2022. The source is Scottish Morbidity Records (SMR01) dataset.
Note: Time period includes inpatient/day case admissions between January 2022 and December 2022. The source is Scottish Morbidity Records (SMR01) dataset.
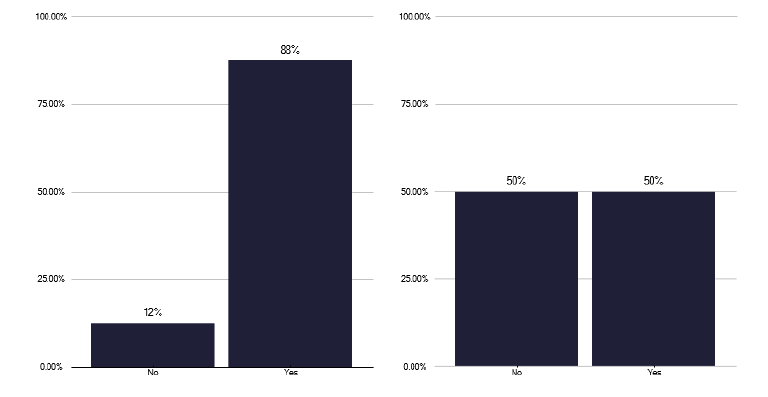
Perhaps the greatest cause for concern was which clinician patients were admitted under. While the activity for outpatients was acceptable with 88% of patients being under a TB clinician.
For those admitted, only half were under the care of a named TB physician, see Figure 33, a finding likely to have implications for management. Nursing input to admitted patients likewise was far from ideal, as shown in Figure 34 given that TB patients are hospitalised for a reasonable period as described in graph 277 in the data pack in Annex E.
At best only 50% of inpatients, under respiratory care, saw a TB nurse during their stay, recognising that for those with a length of stay <1 day this may not be appropriate. However, for admitted patients this is a missed opportunity to provide much needed explanation of the disease and management plan and to identify potential contacts and to develop rapport between patient and nurse with whom they may have regular contact thereafter. We did not ask the reason for these surprisingly low numbers but lack of TB nursing workforce and their need to deliver care in other settings e.g. community, clinic is the most likely factor.
Recommendations: Inpatient activity
28. Clinical teams should review the patient discharge letters to ensure they are accurate and where relevant discuss with the coding team to ensure that patients are correctly coded.
P, HB
29. Clinical teams and Health Boards should review the reasons why some patients have a long length of stay, defined as beyond 28 days, to address remediable factors. Such patients should be discussed at cohort reviews.
P, HB
30. All patients with tuberculosis need to be under a named TB physician if either outpatient or in patient, recognising TB patients may be admitted for other reasons. On such occasions the TB physician should be informed the patient is admitted, review them as an inpatient and provide ongoing advice.
P, HB
31. Patients admitted with proven TB should be reviewed by a TB nurse during their inpatient stay and ideally an interested pharmacist should review medication during the patients stay and /or prior to discharge.
P, HB
10.3 Delays in management.
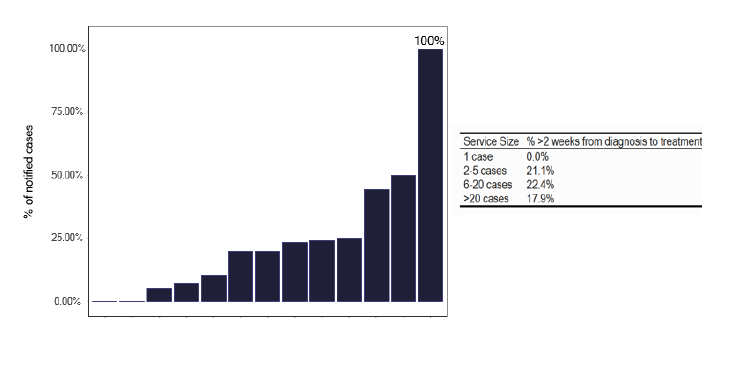
Management of tuberculosis involves a high index of suspicion for early diagnosis with appropriate adherence to therapy to obtain a cure. We reviewed the ESMI data which showed a delay between diagnosis and treatment. Figure 35 shows the proportion of patients who waited more than 2 weeks from diagnosis to start of treatment, with little variation based on the number of cases. If we explore this further for pulmonary Figure 36 and for non-pulmonary disease in Figure 37, we notice that there were considerable delays. Some of this may relate to definitions of symptom onset, so greater clarity in what constitutes ‘symptom onset’ in ESMI.
Note: Time period includes inpatient/day case admissions between January 2022 and December 2022. The source is Scottish Morbidity Records (SMR01) dataset.
Note: Time period includes inpatient/day case admissions between January 2022 and December 2022. The source is Scottish Morbidity Records (SMR01) dataset.
Note: Time period includes inpatient/day case admissions between January 2022 and December 2022. The source is Scottish Morbidity Records (SMR01) dataset.
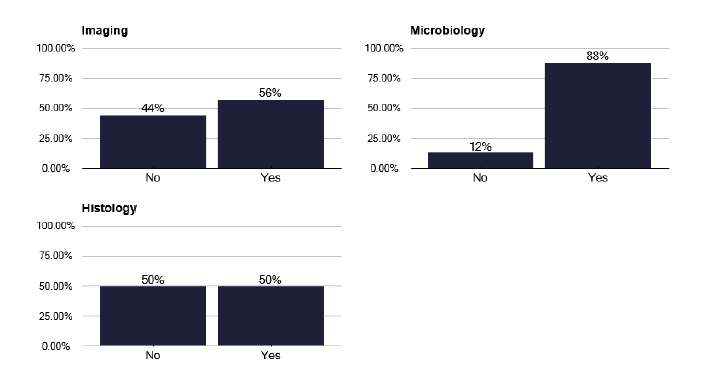
One factor that may produce delays is communication between services. We can see in Figure 38 that there is good communication between TB services and microbiology, but less so for imaging where 44% of TB services said they were not informed by imaging if there was potential TB. This is disappointing, as many imaging departments have an ‘alert’ system for suspected lung cancer.
We made uniform recommendations for this to improve during several deep dives in which it was suggested that software recognition of abnormalities may trigger a response to the TB service, though timelines for this were uncertain. Until such technological solutions are effective, a more manual approach should be developed, learning from services that already have these links.
Similarly, we found that potential TB identified in histological samples, be that granuloma or actual acid alcohol fast bacteria (AAFB), were not communicated to TB teams in 50% of services. This can add considerably to the delay of initiating treatment and TB services must work with their pathology colleagues to address this issue. Where solutions to the information transfer to the TB service is not forthcoming from imaging and histology, it should be resolved at provider Health Board or Medical Director Level.
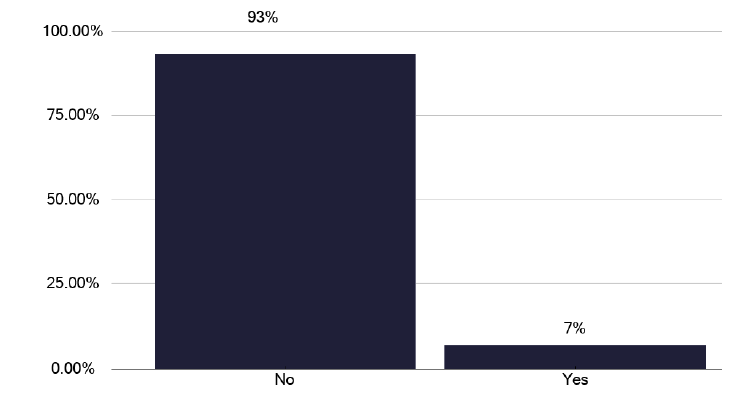
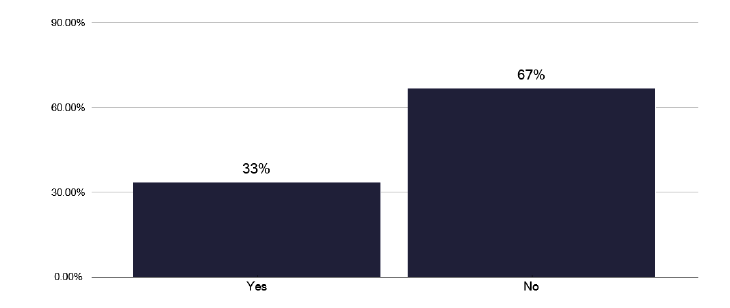
Perhaps of greater concern is that 67% of services stated they did not attempt to identify why there were delays in diagnosis, as in Figure 39, recognising that for some patients the reason was obvious and so there may have been no need to review.
We invited services to document the three top reasons for the delay in starting treatment and these are documented in Table 3. These have been grouped arbitrarily into:
- Delays or mis-directed presentation
- Healthcare system or provider challenges
- Social determinants of health and inequalities.
The findings tabulated are not surprising but are concerning and highlight several remedial factors.
- Attempts to address these systematic issues include general education to the public about tuberculosis and specific education to health care providers in both primary and hospital care.
- Time to deliver this education needs to be recognised in job plans, as per the workforce sections.
- Raising the profile of TB with acute providers can be aided by having a clear service that is identified with appropriate policies and practices that are recognised at Health Board level.
There are clear capacity issues in delivering care and the rural nature of some services exacerbate these issues.
The recommendations below include aspects for training and education with other areas around diagnosis and infrastructure covered through the report.
Table 3: Delays in patient presentation to healthcare services and late recognition of TB as a possible diagnosis by both patients and healthcare providers.
This includes factors like:
- Patients not coming forward for testing or not attending doctor appointments.
- Non-engagement or late presentation related to barriers in accessing care including social circumstances.
- Failure to recognise TB symptoms, leading to delays in seeking medical input.
- Investigations directed towards other medical issues before considering TB.
- The slow speed of the investigative pathway once TB is considered.
- Delayed confirmation of TB diagnosis.
- Issues specific to paediatrics such as lack of TB/PH (Public Health) nurse dedication and lack of dedicated TB space/clinic.
Healthcare System and Provider Challenges
Issues within the healthcare system itself and potential gaps in awareness or readiness among providers. This involves:
- Lack of TB awareness in primary care and lack of clear pathways in secondary care.
- Problems with the referral pathway between healthcare services.
- Delays due to waiting time for clinics with TB expertise.
- Late seeking of medical input into patient care, exacerbated by clinic availability.
- Healthcare professionals' failure to send appropriate microbiology samples or request CXR.
- The time to culture when smear-negative and asymptomatic also plays a role.
Social Determinants and Health Inequalities
Various socioeconomic factors contributing to health disparities affect prompt access and treatment. These include:
- Fear of stigma associated with TB.
- Health inequality and access to healthcare, particularly for individuals with language, social, and economic barriers.
- Issues related to living in rural areas, including transportation problems.
- Financial barriers to attending medical appointments.
- Complexities in the administration of paediatric TB medications like tube fitting.
- Vulnerabilities in specific groups impacting their access to healthcare.
Recommendations: Delays in management
32. For individuals, where there are significant delays in both symptom onset to clinical review, and to treatment, a detailed review of the reasons should be undertaken and modifications to the service made to address the issues. These notifications should also be included in cohort reviews
P, HB
33. Clear policies for managing TB should exist within the Health Board and acute providers, supported by regular multi-professional managerial meetings.
P, HB
34. There should be regular updates for primary care staff, at least bi-annually to general practitioners and primary care staff as part of their formal CPD program.
P, HB
35. The updates to Health Protection staff, as part of their training, as noted in the good practice should continue.
P, HB
36. Awareness of TB in the acute provider is essential in identifying patients promptly and therefore there should be at least an annual grand-round in the acute provider with specific bi-annual education to staff in the acute portals.
P, HB,
10.4 Enhanced case management, DOT & VOT therapy
Adherence to therapy is essential for curing tuberculosis, but some patients may take treatment intermittently or miss some drugs from the regimen, with the potential of failure to cure and emergence of drug-resistant mycobacteria. Minimising this risk is important, and can be achieved by ensuring patients understand the rationale for treatment, but some individuals, noted by using enhanced case management (ECM) tools, are at risk of poor adherence.
To address these issues, it is possible to observe the individuals taking the anti-tuberculosis drugs, either face to face through directly observed therapy (DOT), or by video observed therapy (VOT).
Treatment is given variably for DOTs, as in graph 212 in the data pack (see Annex E), usually between three and five days per week depending on the infrastructure and resources available. These factors are considered in the following sections.
Those individuals who have complex issues with TB, including potential adherence, and those who need additional support (enhanced case management (ECM)) can be identified by using dedicated assessment tools.
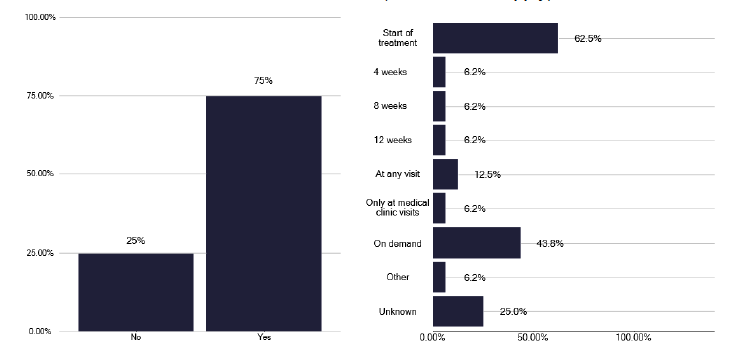
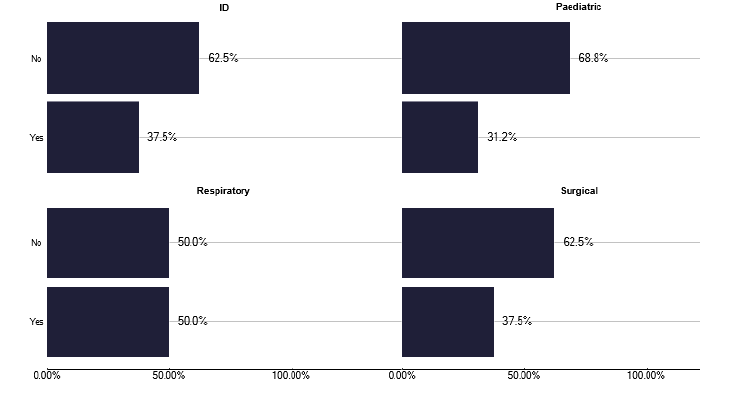
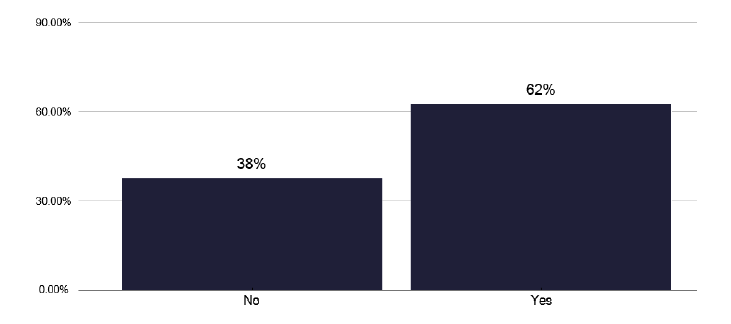
Figure 40 highlights that 62% of TB services use such a tool (e.g. The Royal College of Nursing, Case Management Tool RCN tool), though this does not appear to be standardised Figure 41 shows the number of individuals who needed ECM, noting 38% did not, and in Figure 42 the number that received ECM, which are broadly similar findings. This is displayed as notifications requiring ECM in Figure 43 where there seemed a great use of ECM, with increasing case numbers.
Whether this relates to availability of staff, greater awareness of the use of ECM or different case-mixes will depend on local factors, hence looking at site specific information as shown in graph 251 in the data pack in Annex E.
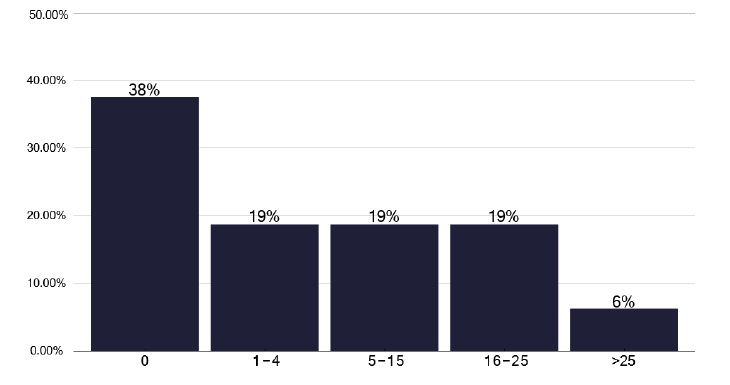
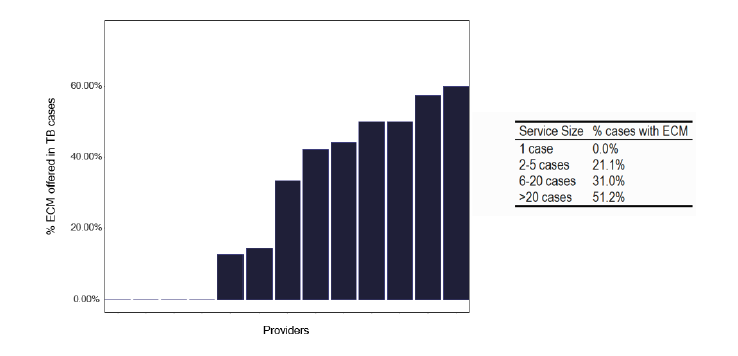
Note: Time period includes notified cases between January 2022 and December 2022. The data source is the Enhanced Surveillance of Mycobacterial Infections (ESMI) system
10.5 Directly Observed Therapy (DOT)
DOT can be administered by different personnel as shown in Figure 44. A scheme linking it to local pharmacies is helpful in remote areas where it is difficult for nurses to attend and may be linked to other substance misuse programs. During the deep dives, we found excellent examples where such a scheme had been deployed and these are contained in good practice via the link in Annex E.
An alternative in more urban areas, is for nurses to observe the individual taking the treatment, usually in their own environment or a mutually agreed place. It is important that a risk assessment is made to determine if either one or two nurses need to attend, but worth noting that staff shortages limit availability to deliver DOTs in half of services in graph 214 in the data pack in Annex E; hence, the benefit of considering lower banded staff to support the DOTs service.
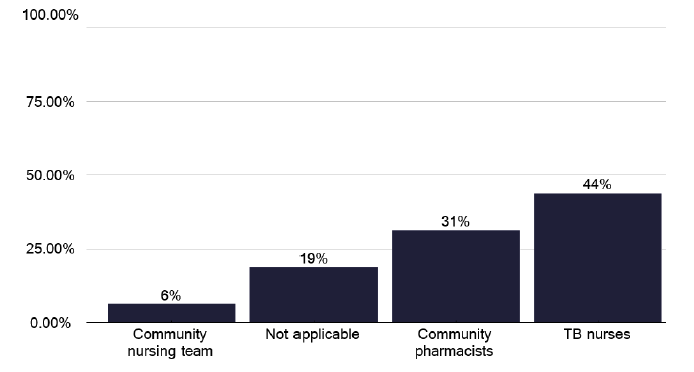
Note: Total percentage of responses can be over 100% as multiple options can be selected for this question.
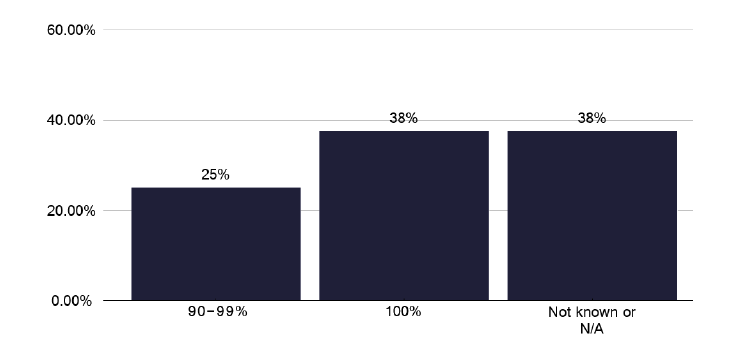
The numbers of patients, recognising the variation in notifications, who were assessed as needing DOTs, were offered it and accepted it are broadly similar as shown in graphs 207, 208 and 209 in the data pack in Annex E, with the proportions noted in graphs 252, 253 and 254 in the data pack in Annex E. In only just over one third of individuals was treatment completion 100% as shown in Figure 45.
10.6 Video Observed Therapy (VOT)
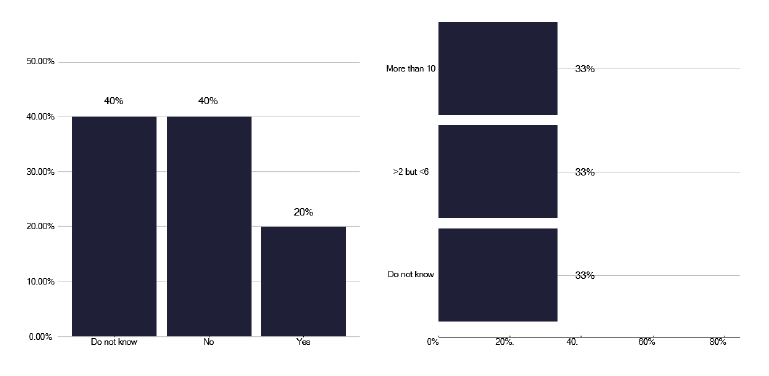
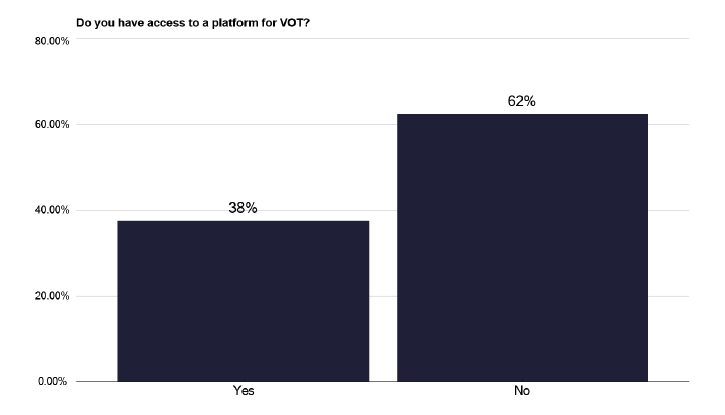
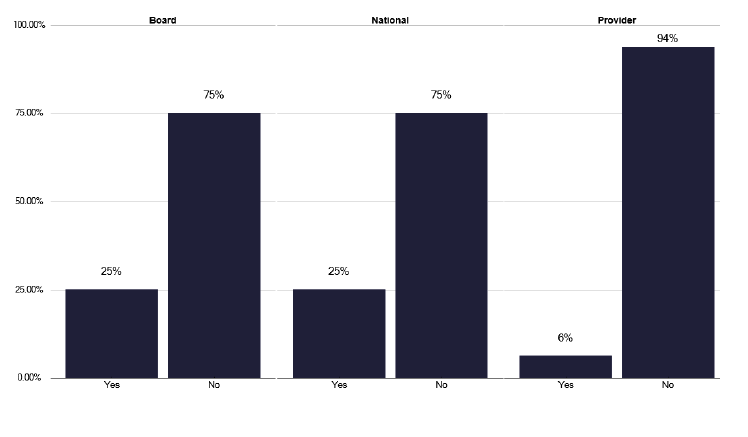
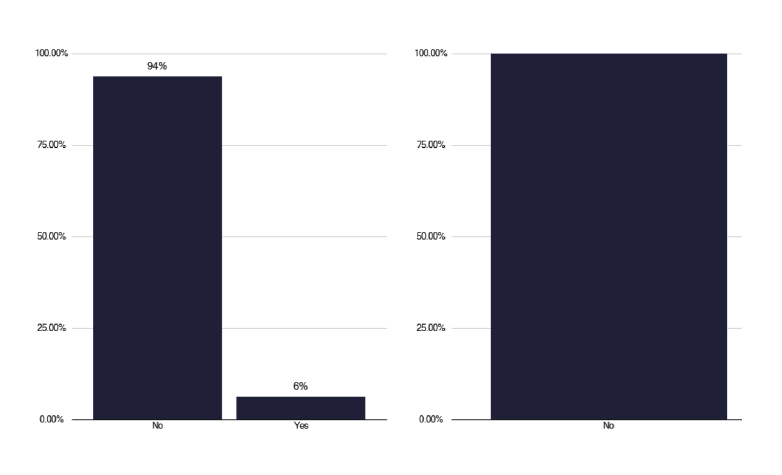
Video observed therapy has the advantage in the rural areas of not needing staff to travel. However, to deliver this, appropriate technology is required. This may include the availability of mobile phones, which were absent in 62% of responses as in graph 255 in the data pack in Annex E, or another appropriate platform, which was found in only 38% of providers, shown in Figures 46 & 47.
Of those with a platform, all but one (from the deep dives) used ‘Near me’, which we heard was a very unsatisfactory tool, due to its inflexibility and is not seen as useful for VOT. One service used a commercial platform, as shown in Figure 48, but there were issues around its governance.
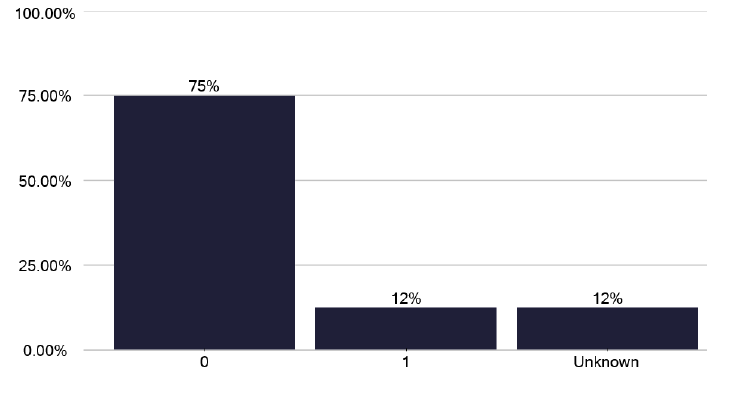
Where VOT was delivered, this was by TB nurses, but it is used infrequently, with only two patients being offered and accepting VOTs in the time period of the review, as shown in Figure 49 and in the data pack graph 218 in Annex E. Whether this low use is due to staff shortages, as in graph 222 in the data pack in Annex E, patient case-mix, lack of infrastructure, or “not deemed as required” are service specific issues. However, in the patients it was used for, it had a high completion rate, as in graph 220 in the data pack in Annex E and was delivered over either 5 or 7 days, as per graph 221 in the data pack in Annex E.
Is the VOT Platform commercial? If ‘yes’ is this the London ‘Find & Treat’ service?
Recommendations: DOT and VOT
37. A standardised tool to assess who would benefit from ECM should be used. This will allow consistency if patients move to different Health Boards’ TB services.
P, HB
38. DOT: Where DOT is required, appropriate staffing needs to be available i.e. using potentially lower banded staff. A risk assessment should always be performed to determine the number of staff required.
P, HB
39. DOT: Community pharmacists, who are appropriately reimbursed are an alternative source of staff, where staffing or travel times limit nurse delivered DOT.
P, HB, N
40. VOT: A platform should be available throughout Scotland to allow VOT to be delivered. This needs appropriate governance, and must be effective and easy to use for both patients and clinical staff.
N
41. VOT: VOT seems to have a low use despite its potential advantages in rural areas of minimising staff travel. This may relate to the patient case-mix, lack of staff or availability of infrastructure or a platform. Each service should consider the benefits of VOTs when appropriately supported.
P, HB
10.7 Treatment of Tuberculosis including Multi-Drug-Resistant TB (MDR)
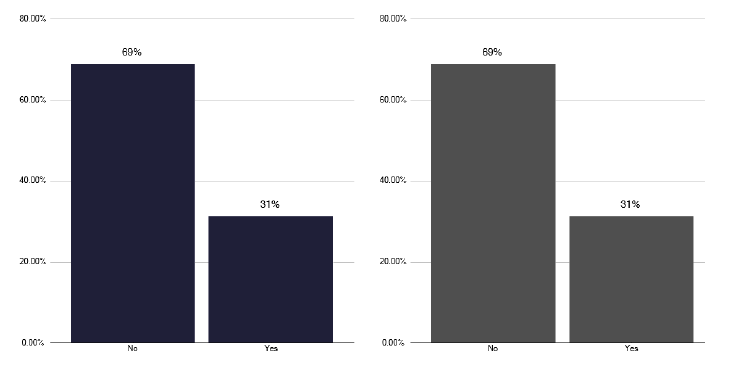
Management of TB is associated with delays, as noted in the previous section, though actual treatment completion is excellent. An 85% threshold is achieved for several services, as in Figure 50, though as can be seen from this anonymised service, this is not uniform. An aspect of support for patients who start treatment is the requirement for regular contact but this was not in the form of a home visit for 69% of services, irrespective if this was pulmonary or extra-pulmonary Figure 51.
However, this does not acknowledge that for some individuals a home visit is not needed, as they were seen as an inpatient, or the geography would limit such a visit. We were assured during all the deep dives (irrespective of the data shown in graph 202 in the data pack in Annex E) patients are well supported and this is an undoubted factor in the high completion rates.
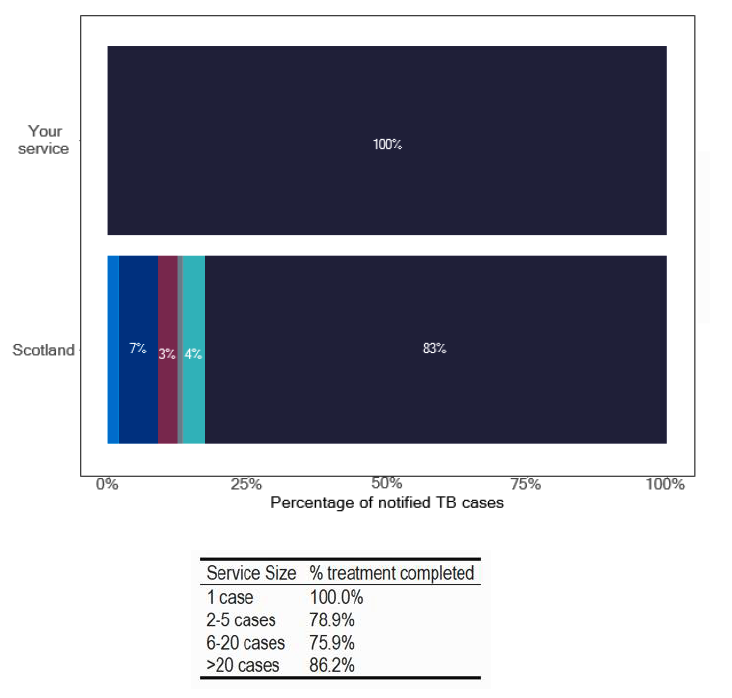
Note: Time period includes notified cases between January 2022 and December 2022. The data source is the Enhanced Surveillance of Mycobacterial Infections (ESMI) system
Fortunately, there have been only two notifications with MDR in the review period and none for extensively drug resistance (XDR). However, other drug resistance patterns are problematic, as shown in Figure 52, and we heard during one deep dive, where isoniazid resistance has been endemic in one locality for several years, complicating the management and workload of the service.
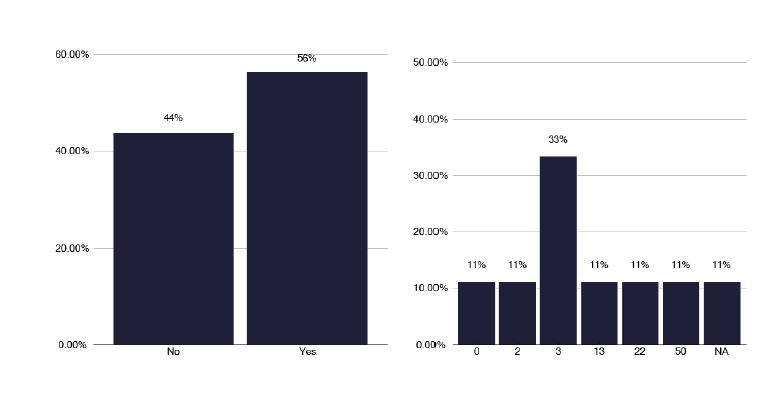
To help manage MDR and to support clinicians, NHS England supported the development of the British Thoracic Society run, MDR service. This has not been used by 56% of services in Scotland, shown in Figure 53, and when it was used, it was usually for other reasons, as in Figure 54. A quarter of services stated they had used the service for non MDR (Multi drug resistant mycobacteria) / XDR (Extensively drug-resistant tuberculosis) reasons, as shown in graph 263 of the data pack in Annex E.
| Resistance | Scotland - Number | Scotland - Percent | Your Service - Number | Your Service - Percent |
|---|---|---|---|---|
| Isoniazid Resistant | 13 | 6.53% | 0 | 0% |
| Rifampicin Resistant | 3 | 1.51% | 0 | 0% |
| Ethambutol Resistant | 2 | 1.01% | 0 | 0% |
| Pyrazinamide Resistant | 4 | 2.01% | 0 | 0% |
| MDR/XDR | 2 | 1.01% | 0 | 0% |
Note: Time period includes notified cases between January 2022 and December 2022. The data source is the Enhanced Surveillance of Mycobacterial Infections (ESMI) system
Recommendations: Treatment
42. All services should strive to achieve 12-month treatment outcomes of 'Treatment Success' for over 85% of culture-confirmed pulmonary tuberculosis cases and where they fail to do so, a root cause analysis as part of a cohort review, should take place.
P, HB
43. Patients on treatment for TB (and those receiving preventative therapy) require ongoing support that is tailored to them. This should include information in different formats (written, spoken) and different languages.
P, HB
10.8 Medicines Management
We note the wide geographical area covered by some TB services and Health Boards and this poses a potential risk for prescribing errors, especially in light of the drug shortages which exist, with the need for drug regimen modification and the infrequent need for primary care to prescribe.
From the deep dives we noted excellent practice by several services to reduce this risk, where the TB clinicians, nurses or pharmacists, would write the prescription for the appropriate therapy and this would be dispensed by the pharmacy in the acute provider. Subsequent prescriptions would follow the above process. For some services with wide geographical issues, the treatment from the hospital dispensary would be transported to the patient's general practise surgery for collection, minimising the patient's need to travel.
Additionally, we found an individual in the dispensary, overseen by a pharmacist, who maintained a spreadsheet of patients on different regimens and would notify if drugs were running out. Likewise, adherence support, such as blister packs, could be produced, but this was a little more variable in some hospital pharmacies and we noted the key role that pharmacists/dispensary played in providing patient education.
The relationship between primary care, pharmacy, and TB nursing meant if patients fail to collect their treatment, the TB service was usually notified. The above practice is especially applicable to those services where there is a wide geographical footprint.
We also noted excellent practice in two services where the clinical lead in one service, and a senior pharmacist in another, went on to the electronic patient record (EPR) for that patient and updated any changes in therapy, so all parties involved in the patient's care could see what treatment the patient was taking. This minimises the risk of treatment being inadvertently stopped or potential drug interactions.
10.9 Pharmacist workforce
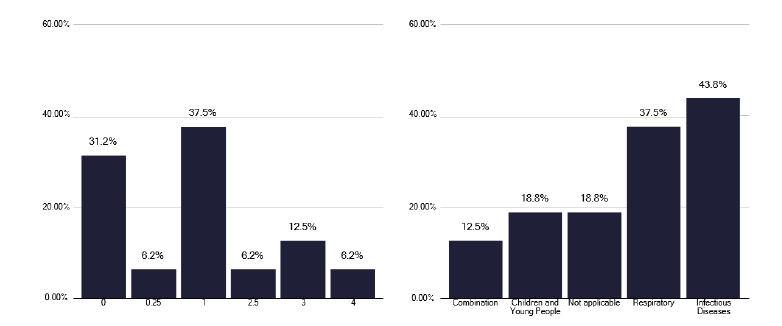
Pharmacist time is essential in supporting TB services for standard TB therapy, preventative therapies and especially the complex interactions in those receiving treatment for non-tuberculous mycobacteria. Unfortunately, only 20% of services had any dedicated pharmacist time for the TB service and, as shown in Figure 55, the number of hours was very limited. These internal meetings or MDTs were often not attended by pharmacists. Only two services had senior Band 8a input and they contributed to the good practice noted above and were not in high notification services.
Clearly, pharmacy input is essential to TB services and this needs to be at a sufficiently senior banding to contribute to the service i.e. a minimum of a Band 7 but ideally at a Band 8a. The time should be pro-rata to the workload based on notifications, preventative therapies issues and supporting NTM (Non-tuberculous mycobacteria) care. This must also recognise the need to attend clinical MDTs, as well as the performance of other tasks such as prescribing, supporting education and having oversight of dispensary actions.
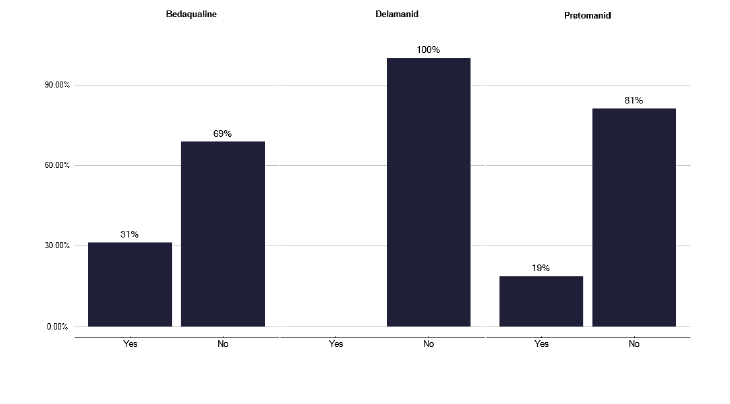
Furthermore, drug shortages have a significant impact on services, as shown in graph 258 in Annex E, with 60% of services being impacted in the last 12 months. This included the need to change regimens, prioritise patent care and issue shorter durations of treatment. With changing drug regimens for MDR and XDR, using treatment that clinicians may be less familiar with, as in Figure 56, pharmacist input is important to assess potential interactions. Clearly, pharmacists working within providers and across Scotland have a role in supporting these important issues. For low incidence services, this can be delivered by an antimicrobial or a ward based pharmacist with dedicated time, which was seen to be effective during the deep dive engagements.
We understand an excellent pharmacy service was previously provided from Glasgow to many TB services, but that individual has now retired. Consideration should be given for a ‘Scottish pharmacy network’ to allow pharmacists, prescribers and clinicians access to TB advice around potential interactions, and drug shortages, so the consequences can be mitigated as far as possible. This could be delivered by pharmacy input from the larger services.
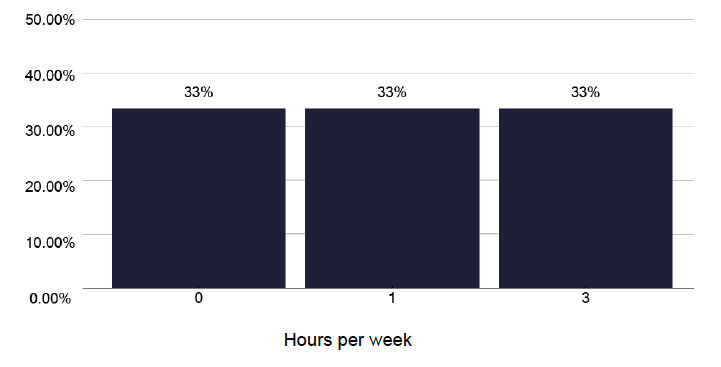
Hours per week
Recommendations: Medicines Management
44. All services should have a robust prescribing system to minimise drug errors, especially if prescribing is devolved to primary care.
P, HB
45. Pharmacist and pharmacy technician time is essential in TB services, providing advice, support to clinicians and patients, tracking medication use and advising around drug shortages. Attendance at TB MDTs and cohort reviews should be part of their job plan. Staff of appropriate seniority and experience / knowledge should support the service on a pro rata basis, depending upon the size of the service. All services should review their pharmacy infrastructure and support as needed.
P, HB
46. Consider the setting up of a ‘Scottish pharmacy network’ to support TB, including CYP, and NTM, providing advice and support for the use of less commonly prescribed drugs, potential interactions when patients are taking anti TB drugs for long periods and to help manage TB drug shortages.
P, HB, N
10.10 Non-tuberculous mycobacteria (NTM)
Non-tuberculous mycobacteria, previously considered as ‘atypical mycobacteria’ are forming an increasing volume of work due to an apparent increase in the number of patients, the availability of new and different treatment regimens and the duration of such treatment. This increasing pressure has led to the development of guidelines which can be accessed here ‘management of NTM’.
Whilst NTM can occur in a variety of tissues, including the skin, it is pulmonary disease where the management is often more problematic. This relates usually to an elderly population with multiple comorbidities, including underlying respiratory disease who are already taking polypharmacy for other illnesses and are then invited to take toxic anti-tuberculosis drugs with all their potential drug interactions for a protracted period.
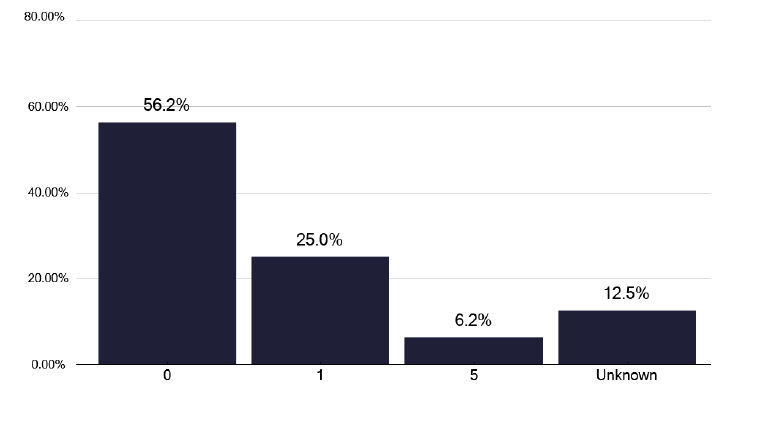
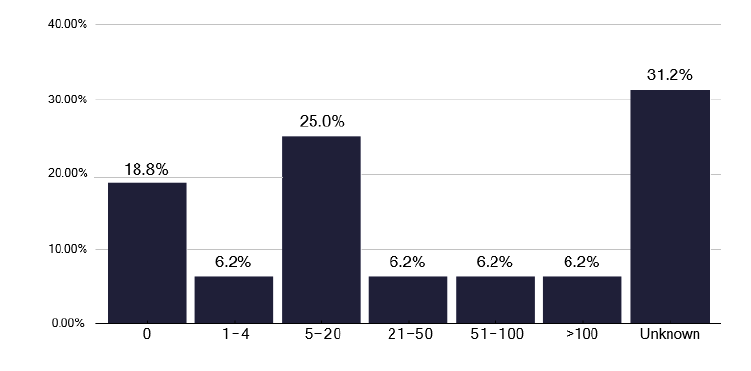
Issues with NTM were apparent during the review with some 38% of TB services, setting up NTM services within the actual TB clinic, to cohort the patients into one service, as shown in graph 264 in the data pack in Annex E. While beneficial, this may have an impact on the capacity to deliver standard TB care, as in half of the NTM services it is the TB nurses who are involved, as shown in Figure 57. This is necessary to support patients, but NTM represents a significant volume of work for some services, as shown in Figure 58, where two services have seen over 50 NTM patients in the last year, and one third of services are unsure of the number of cases seen.
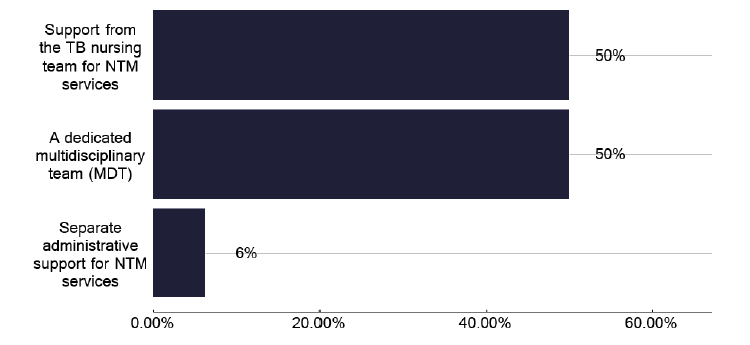
For all NTM services, which of the followng do you have in place? (Select all that apply) Image
Note: total percentage of responses can be over 100% as multiple options can be selected for this question
Only one service has funding for medical staff and only a quarter of TB services are looking to develop a business case for additional funding, however, from the deep dives none seem to have progressed this to approval so far. We made strong recommendation that services should be developing a business case for additional resources that should include medical, nursing, pharmacist time, on a pro-rota basis, together with appropriate administration to support data capture. Depending upon the service, physiotherapy support should be available for high sputum producers and access to dietetic advice for those who are underweight or malnourished.
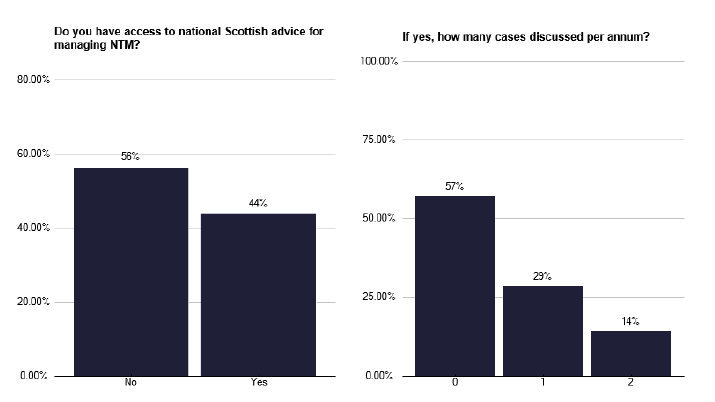
Management of these patients is difficult and there is often need for external advice. There is no UK NTM service, so some colleagues are using the British Thoracic Society BTS MDR service (as aforementioned) to discuss patients’ care. There were comments from the survey that a Board or national NTM advice service existed, but this did not seem to be funded and was purely based upon colleague interest and enthusiasm, as seen in Figure 59 and Figure 60.
Recommendations: NTM
47. Infrastructure should be developed to comply with the national NTM guidelines.
P, HB
48. Services should be developing a business case, as noted above, to support these patients.
P, HB
49. A funded national NTM advice service which is multi-professional and includes pharmacist and administration time should be developed with a fortnightly MDT that individuals can refer into along the lines of the BTS MDR service.
N
10.11 Inclusion Health
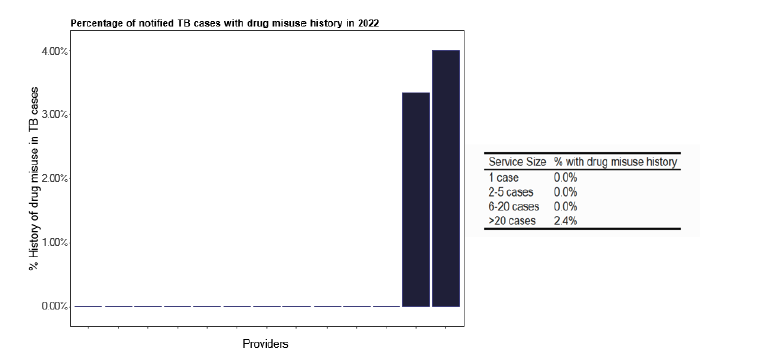
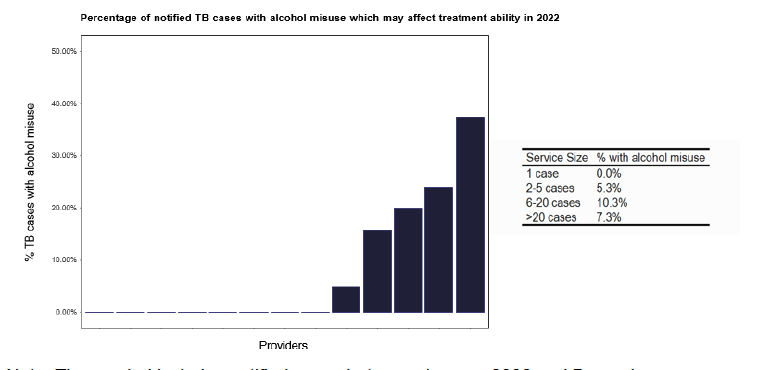
Inclusion health is an important consideration that covers a range of aspects that can impact on clinical care. Surprisingly, given the issues of drug misuse in areas of Scotland, only two services in ESMI data recorded such issues, as in Figure 61, and neither of these were in low notification services. However, we did hear during our deep dives that this is a changing scenario. The number of individuals where alcohol misuse featured was greater and seems to be distributed across all the notifications as shown in Figure 62.
We asked specifically about outreach services which were available to support patients with inclusion health issues, as shown in Figure 63, and a quarter of services said they did not have access to holistic care. During the deep dives it was apparent that access for patients for all aspects of inclusion health, as listed, were available. Unfortunately, there was not often a named individual for contact when needed, leading to the TB nursing staff spending considerable time identifying the correct person to provide help and support for that patient. For some of the services, we noted an excellent infrastructure with a ‘safety net’ to catch these vulnerable groups.
Although there is no information in ESMI data on prisons, we had only one comment during our deep dives, of a prison within the Health Board catchment, and that access was not an issue as the TB service worked in conjunction with Health Protection nursing staff who had access into the prison environment. Issues of screening for patients with potential TB within this population were not a feature of the review.
Note: Time period includes notified cases between January 2022 and December 2022. The data source is the Enhanced Surveillance of Mycobacterial Infections (ESMI) dataset.
Note: Time period includes notified cases between January 2022 and December 2022. The data source is the Enhanced Surveillance of Mycobacterial Infections (ESMI) dataset.
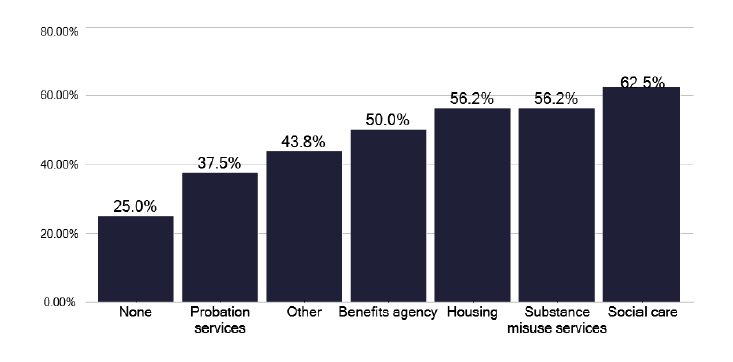
What mechanisms (if any) does the service have for linking socially complex cases to other servces to help to address needs such as housing, drug use or access to benefits? (Select all that apply)
Note: Total percentage of responses can be over 100% as multiple options can be selected for this question
Recommendation: Inclusion health
50. It is important to acknowledge the changing epidemiology and patient groups who will have issues of inclusion health, especially around substance misuse and homelessness. Services need to be in place to address these social risk factors.
P, HB
10.12 Children and young person’s (CYP) TB services
While children and young people contribute a relatively small number of notifications, the contacts generated from adult notifications, together with any preventative work, constitute a variable but significant workload. To highlight CYP, we specifically pulled all such information into graphs 337- 349 in the data pack in Annex E, as a dedicated CYP section of the data pack.
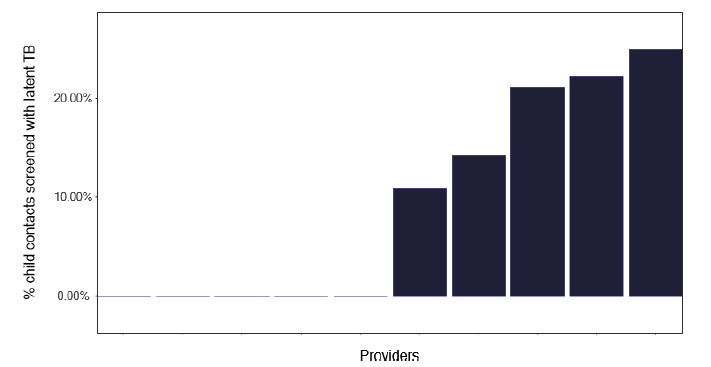
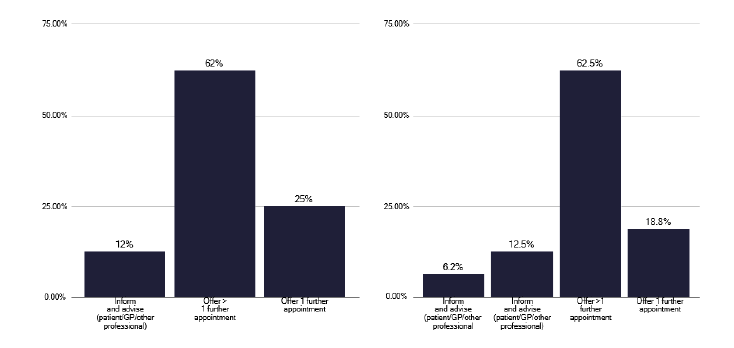
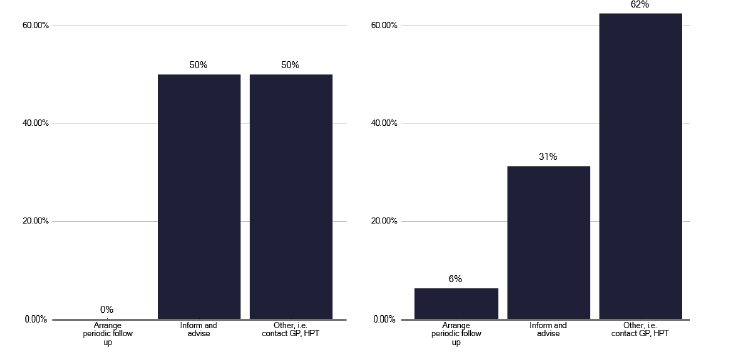
While there is a relatively low volume of TB inpatient work, there is a considerable amount of work from contact tracing, with Figure 64 highlighting the number of contacts with latent TB and Figures 65 and 66 showing the procedures followed for contacts who fail to attend or decline treatment.
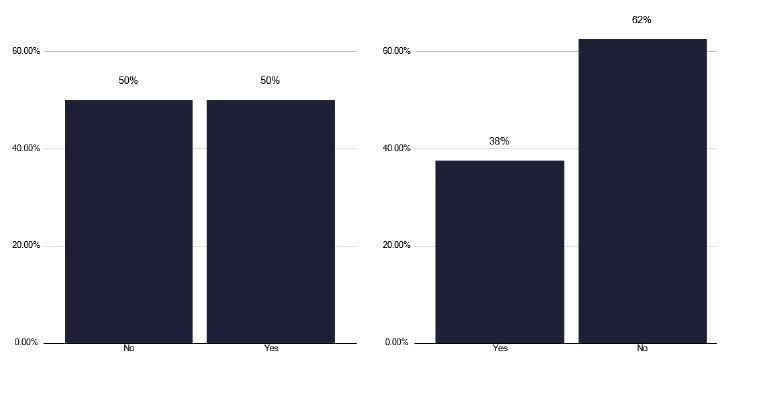
We noted that there were few sessions for both SPA and DCC time in CYP and the recommendations we made in the medical section for appropriate time are also true for CYP medical staff. Over half of CYP TB services do not have specific paediatrician input, as show in Figure 67, which is inadequate for the delivery of effective CYP. Depending on the activity, nursing time to support CYP care is important. This may be dedicated CYP clinic staff, dedicated CYP TB nursing, community health protection nurses, or form part of the TB nurse duties. Ideally the TB nurses should be trained in child health care.
In smaller volume services where experience may be limited, support for both nurses and medical staff is needed, a fact we heard repeatedly during the deep dives. We noted the informal network that the Glasgow paediatricians have established, with a monthly MDT to discuss cases, including management of latent TB. This should be formally established as a Scotland service, with funding, and include colleagues with expertise from other Health Boards e.g. Lothian. It should include dedicated nursing and pharmacist input and be supported by administration to ensure that robust communication of discussed outcomes are shared with referring teams. The frequency of these meetings should be every 2 weeks and be open to all clinicians.
Note: Time period includes notified cases between January 2022 and December 2022. The data source is the Enhanced Surveillance of Mycobacterial Infections (ESMI) dataset.
Recommendations: CYP
51. Health Boards should recognise the need for appropriate staff numbers, with time in their job plans, and access to training for managing CYP TB and any associated preventative treatments that occur after contact tracing.
P, HB
52. A multi-professional Scotland CYP TB network needs to be established and funded.
P, HB, N
53. If Scotland Government decides to develop a preventive strategy for latent TB, a specific infrastructure needs to be in place for CYP and unaccompanied adults.
N
Contact
Email: healthprotection@gov.scot