Publication - Independent report
Land and Buildings Transaction Tax: review
An independent analysis of certain aspects of Land and Buildings Transaction Tax (LBTT) policy.
Appendix 2: Materiality analysis graphs and figures
Non-residential and mixed-use treatment
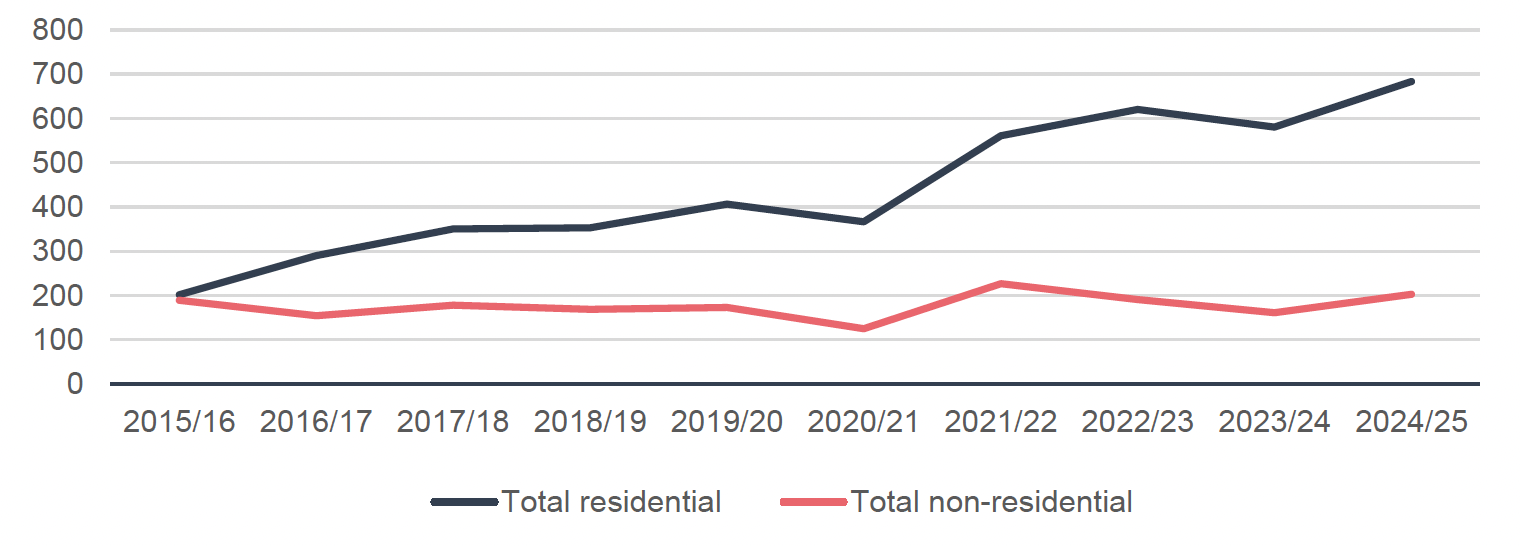
| Year | Total residential LBTT declared (£m) | Total non-residential LBTT declared (conveyances) (£m) | Percentage residential | Percentage non-residential |
|---|---|---|---|---|
| 2015/16 | 202 | 189.6 | 52% | 48% |
| 2016/17 | 290.2 | 154.9 | 65% | 35% |
| 2017/18 | 350.8 | 178.1 | 66% | 34% |
| 2018/19 | 353.5 | 168.8 | 68% | 32% |
| 2019/20 | 406.5 | 173.1 | 70% | 30% |
| 2020/21 | 366.4 | 125.3 | 75% | 25% |
| 2021/22 | 560.7 | 227 | 71% | 29% |
| 2022/23 | 620.6 | 190.8 | 76% | 24% |
| 2023/24 | 581 | 161.5 | 78% | 22% |
| 2024/25 | 683.5 | 202.7 | 77% | 23% |
Source: Revenue Scotland (2025c)
Source: Revenue Scotland (2025c)
| Year | Total residential conveyance returns | Total non-residential conveyance returns | Percentage residential | Percentage non-residential |
|---|---|---|---|---|
| 2015/16 | 103,680 | 6,220 | 94% | 6% |
| 2016/17 | 100,500 | 6,810 | 94% | 6% |
| 2017/18 | 103,930 | 6,880 | 94% | 6% |
| 2018/19 | 103,750 | 7,160 | 94% | 6% |
| 2019/20 | 105,110 | 6,440 | 94% | 6% |
| 2020/21 | 96,850 | 5,930 | 94% | 6% |
| 2021/22 | 110,120 | 7,080 | 94% | 6% |
| 2022/23 | 102,580 | 7,050 | 94% | 6% |
| 2023/24 | 94,050 | 6,520 | 94% | 6% |
| 2024/25 | 102,100 | 7,470 | 93% | 7% |
Source: Revenue Scotland (2025c)
| Year | Total residential LBTT relief claims | Total non-residential LBTT relief claims[24] | Percentage residential | Percentage non-residential |
|---|---|---|---|---|
| 2015/16 | 900 | 700 | 56% | 44% |
| 2016/17 | 1,050 | 770 | 58% | 42% |
| 2017/18 | 1,190 | 840 | 59% | 41% |
| 2018/19 | 9,180 | 840 | 92% | 8% |
| 2019/20 | 14,740 | 790 | 95% | 5% |
| 2020/21 | 2,310 | 730 | 76% | 24% |
| 2021/22 | 16,950 | 760 | 96% | 4% |
| 2022/23 | 17,010 | 840 | 95% | 5% |
| 2023/24 | 17,360 | 870 | 95% | 5% |
| 2024/25 | 21,360 | 1,070 | 95% | 5% |
Source: Revenue Scotland (2025c)
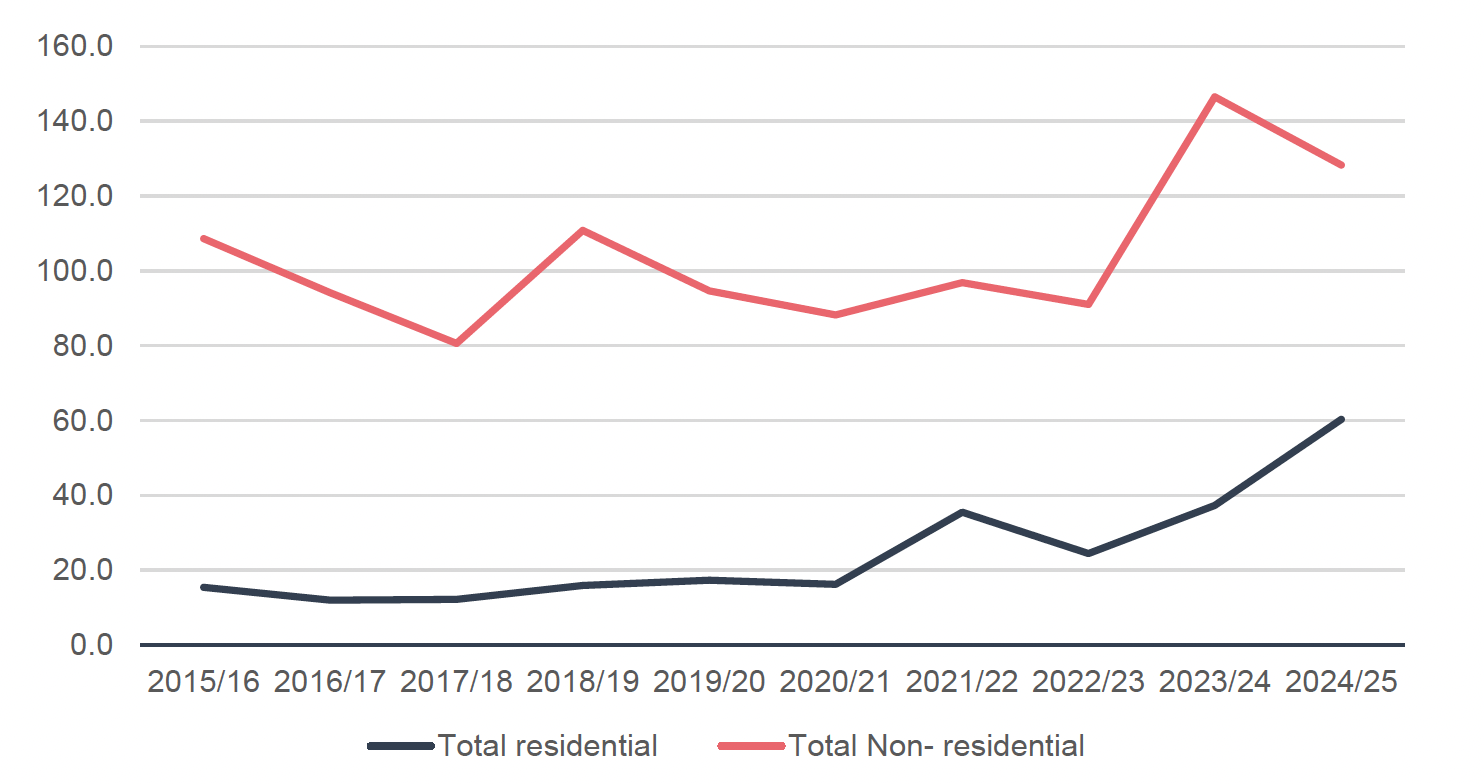
| Year | Total residential LBTT forgone earnings (£m) | Total non-residential LBTT forgone earnings (£m) | Residential percentage | Non-residential percentage | Residential forgone earnings as percentage of residential revenue | Non-residential forgone earnings as percentage of non-residential revenue |
|---|---|---|---|---|---|---|
| 2015/16 | 15.4 | 108.6 | 12% | 88% | 8% | 57% |
| 2016/17 | 12.0 | 94.1 | 11% | 89% | 4% | 61% |
| 2017/18 | 12.2 | 80.6 | 13% | 87% | 3% | 45% |
| 2018/19 | 15.9 | 110.8 | 13% | 87% | 4% | 66% |
| 2019/20 | 17.3 | 94.6 | 15% | 85% | 4% | 55% |
| 2020/21 | 16.2 | 88.2 | 16% | 84% | 4% | 70% |
| 2021/22 | 35.5 | 96.8 | 27% | 73% | 6% | 43% |
| 2022/23 | 24.5 | 91.0 | 21% | 79% | 4% | 48% |
| 2023/24 | 37.3 | 146.5 | 20% | 80% | 6% | 91% |
| 2024/25 | 60.3 | 128.3 | 32% | 68% | 9% | 63% |
Source: Revenue Scotland (2025c)
Source: Revenue Scotland (2025c)
Reliefs and exemptions (MDR, 6+ dwellings ADS exemption and first-time buyer relief)
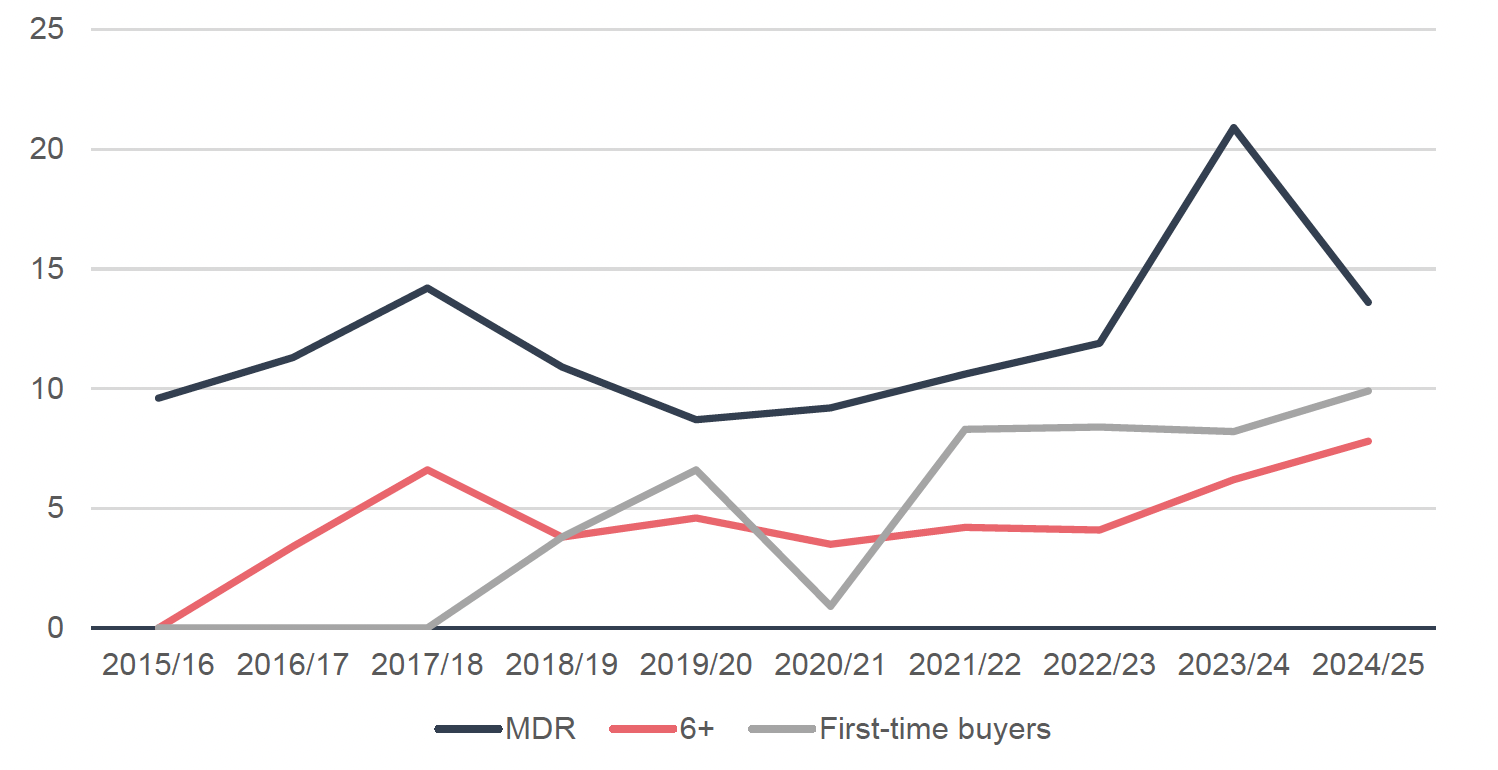
| Year | MDR forgone revenue (£m) | MDR forgone revenue as percent of total forgone revenue | 6+ exemption forgone revenue (£m) | 6+ exemption forgone revenue as percent of total forgone revenue | First-time buyer relief forgone revenue (£m) | First-time buyer relief forgone revenue as percent of total forgone revenue |
|---|---|---|---|---|---|---|
| 2015/16 | 9.6 | 8% | - | - | - | - |
| 2016/17 | 11.3 | 11% | 3.4 | 3% | - | - |
| 2017/18 | 14.2 | 15% | 6.6 | 7% | - | - |
| 2018/19 | 10.9 | 9% | 3.8 | 3% | 3.8 | 3% |
| 2019/20 | 8.7 | 8% | 4.6 | 4% | 6.6 | 6% |
| 2020/21 | 9.2 | 9% | 3.5 | 3% | 0.9 | 1% |
| 2021/22 | 10.6 | 8% | 4.2 | 3% | 8.3 | 6% |
| 2022/23 | 11.9 | 10% | 4.1 | 4% | 8.4 | 7% |
| 2023/24 | 20.9 | 11% | 6.2 | 3% | 8.2 | 4% |
| 2024/25 | 13.6 | 7% | 7.8 | 4% | 9.9 | 5% |
Source: Revenue Scotland (2025c)
| Year | MDR forgone revenue as percent of total LBTT revenue | 6+ exemption forgone revenue as percent of total LBTT revenue | First-time buyer relief forgone revenue as percent of total LBTT revenue |
|---|---|---|---|
| 2015/16 | 2% | - | - |
| 2016/17 | 2% | 1% | - |
| 2017/18 | 3% | 1% | - |
| 2018/19 | 2% | 1% | 1% |
| 2019/20 | 1% | 1% | 1% |
| 2020/21 | 2% | 1% | 0% |
| 2021/22 | 1% | 1% | 1% |
| 2022/23 | 1.4% | 0.5% | 1.0% |
| 2023/24 | 2.7% | 0.8% | 1.1% |
| 2024/25 | 1.5% | 0.8% | 1.1% |
Source: Revenue Scotland (2025c)
Source: Revenue Scotland (2025c)
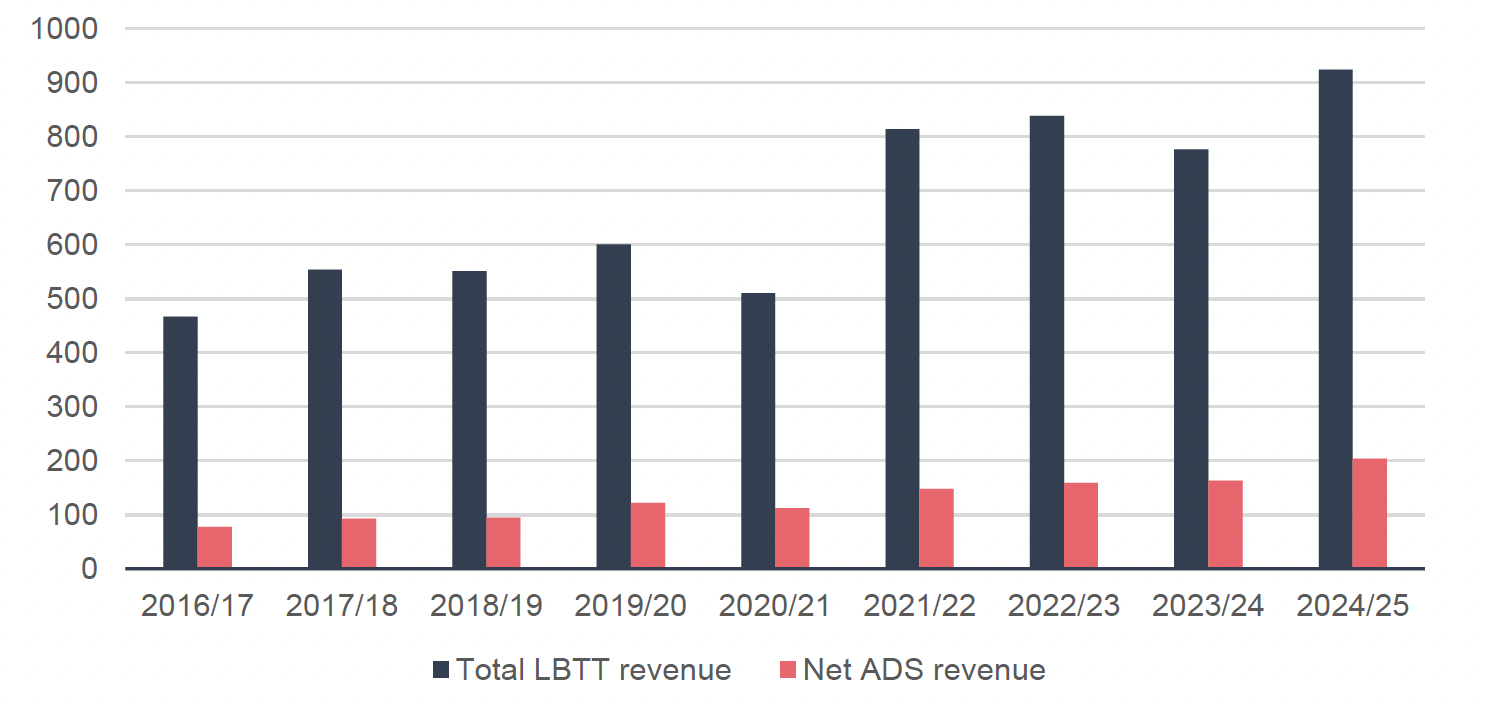
| Year | Net ADS revenues (£m) | Number of residential claims including ADS after repayment | Percentage of LBTT revenue from ADS | Percentage of total residential LBTT claims including ADS |
|---|---|---|---|---|
| 2016/17 | 77.3 | 17,190 | 17% | 17% |
| 2017/18 | 92.6 | 19,480 | 17% | 19% |
| 2018/19 | 94.5 | 19,260 | 17% | 19% |
| 2019/20 | 122 | 19,130 | 20% | 18% |
| 2020/21 | 112.4 | 16,970 | 22% | 18% |
| 2021/22 | 147.5 | 21,410 | 18% | 19% |
| 2022/23 | 159 | 20,960 | 19% | 20% |
| 2023/24 | 163.1 | 17,250 | 21% | 18% |
| 2024/25 | 204.3 | 18,620 | 22% | 18% |
Source: Revenue Scotland (2025c)
Source: Revenue Scotland (2025c)
| Year | ADS revenue forgone (£m) | Returns which include forgone ADS revenue | ADS forgone revenue as percentage of total forgone revenue | Percent of relief claims including ADS exemption |
|---|---|---|---|---|
| 2015/16 | - | - | - | - |
| 2016/17 | 3 | 210 | 3% | 11% |
| 2017/18 | 6.2 | 250 | 7% | 12% |
| 2018/19 | 4.3 | 310 | 3% | 3% |
| 2019/20 | 5.7 | 410 | 5% | 3% |
| 2020/21 | 3.6 | 240 | 3% | 8% |
| 2021/22 | 5.3 | 310 | 4% | 2% |
| 2022/23 | 13.2 | 870 | 11% | 5% |
| 2023/24 | 27.1 | 1,780 | 15% | 10% |
| 2024/25 | 43.3 | 2,670 | 23% | 12% |
Source: Revenue Scotland (2025c)
Source: Revenue Scotland (2025c)
| Year | Number of first-time buyer relief claims | Percentage of total relief claims | Percentage of total LBTT returns |
|---|---|---|---|
| 2019/20 | 13,230 | 85% | 11% |
| 2020/21 | 1,940 | 64% | 2% |
| 2021/22 | 16,220 | 92% | 13% |
| 2022/23 | 16,070 | 90% | 14% |
| 2023/24 | 15,650 | 86% | 14% |
| 2024/25 | 18,810 | 84% | 15% |
Source: Revenue Scotland (2025f)
Contact
Email: devolvedtaxes@gov.scot