Research Data Scotland – Full Business Case
The Research Data Scotland (RDS) Full Business Case (FBC) sets out proposals for the establishment of a new national service that has the potential to save time, money and lives.
Financial Case
Introduction
The Financial Case focuses on the viability and financial sustainability of the preferred option given RDS's strategic objectives and mission. It presents the predicted income and expenditure totals for RDS by financial year, from FY 2021/22 to FY 2025/26. The Financial Case is based on a detailed financial model developed specifically for RDS with consultation taking place with partners and oversight provided by a Finance Working Group (FWG).
A brief summary of past and existing financial arrangements for the service model coming under RDS is also set out. This highlights some of the constraints and weaknesses of existing funding arrangements.
A scan of the wider landscape is conducted. This reveals how similar entities elsewhere in the UK have structured their financial activities. This helps identify risks and points of similarity/difference, which will need to be considered further in the context of RDS.
The chapter also addresses affordability of the preferred option and presents choices for consideration in order to ensure a sustainable financial approach to resource investment for RDS going forward.
As such, based on the preferred option, the Financial Case will:
- Provide a description of how the financial model was developed
- Estimate the total cost of the solution over a 5-year period
- Calculate how much the preferred option costs each year, with a split across key cost categories
- Identify funding sources
- Set out the key financial risks
- Undertake sensitivity analysis to identify how changes in key assumptions influence the overall financial position
- Set out a budget for RDS for FY21/22.
Financial Case Summary
In order to be acceptable to its partners, the financial case for RDS must be positive, sustainable and with financial risk carefully managed. Due to the ending of some grant funding, the current SILC financial model will increasingly show a deficit position: if the RDS financial model were to be based only on the SILC funding model it is likely that this too would show a deficit situation, making it more difficult to involve partners. Consequently, the SG Health portfolio has approved a funding request for £5m in each of the five financial years from FY 21/22.
This blend of SG core grant augmented by other funding streams is an essential condition of RDS's viability: it not only makes RDS financially sustainable, but also mitigates the financial risk to partners.
Financial Modelling Approach
A financial model was developed for the OBC and has been refined for the FBC: It sets out potential future income and expenditure for RDS. The model forecasts future demand and project volumes coming through RDS based on consultation with key service partners and research programme funders (ADR-S, HDR-UK, ESRC), as well as SG and PHS. Other activity associated with RDS's objectives is also identified.
The modelling takes account of the significant upsurge in research and analysis required to support the evidence base around the Covid 19 pandemic – including clinical research, treatments, drugs and vaccines trials, and wider research exploring variation in outcomes for those testing positive for the virus and other impacts on health and non-health outcomes resulting from the pandemic.
A set of services and activities are modelled to meet this demand and the costs of these resources are estimated. This exercise is presented for the current financial year and for each year to FY 2025/26. The financial modelling includes a transition period with associated start-up/transition costs. The figures are being developed in close consultation with service partners and all assumptions tested with the FWG.
In developing the Financial Case, the following components have been included:
- Baseline costs and income for the relevant activities undertaken in the current data linkage system based on the SILC (status quo) model
- Outline costs for the preferred option (a new body established as a joint venture). This has been based on an assumption that RDS will operate through a commissioning model, managed by its own staff of approximately 15
- Income from both revenue and grant funding streams, is based on forecast project volumes and demand
- A more detailed analysis of the costs used in the OBC, particularly for staffing, accommodation and transition
- Conversations with key stakeholders in relevant partner organisations such as eDRIS, EPCC and NRS
- Benchmark data on outline costs sourced from organisations offering a similar service such as NHS Digital, SAIL, and ONS, UK Data Service/Archive
- A core SG grant of £5m per annum for five years commencing FY 21/22
- Estimates of service development costs, necessary to improve the service.
Finance Working Group
A FWG was established to input to and support the development of the financial modelling underpinning the set-up of RDS, to inform the OBC, FBC and applications for further funding and financial support.
SILC (2014) and Historic and Existing Funding Sources
Figures detailing the costs and funding of the existing data linkage service model have been compiled as part of this Financial Case. These capture recent and current year income and expenditure and provide a contemporary baseline account of activity which is expected to come through RDS.
The current data linkage model under SILC is intended to operate as a balanced budget based on an aggregate income from grants and revenue of approximately £4m pa and with costs relating to staff, data infrastructure, building costs and other costs totalling a similar amount. The actual figures for FY 19/20 and FY 20/21 can be seen in the following table:
Table 13: SILC Income & Expenditure
| FY 19/20 | FY 20/21 | |
|---|---|---|
| Income | £ | £ |
| Grant funding from SG | 1,147,768 | 1,172,362 |
| Grant funding from ESRC | 1,346,873 | 1,640,935 |
| Grant funding from CSO | 150,000 | 150,000 |
| Grant funding from ADR S | 251,817 | 190,000 |
| Other grant funding | 556,835 | 503,189 |
| eDRIS income | 510,000 | 620,000 |
| Other income | - | - |
| Total | 3,963,293 | 4,276,486 |
| Expenditure | ||
| Staff costs | 2,556,621 | 3,359,078 |
| Non staff costs | 1,228,004 | 833,793 |
| Transition & set up costs | - | - |
| Commissioning costs | - | - |
| Total | 3,784,625 | 4,192,871 |
| Surplus/(deficit) | 178,668 | 83,615 |
The SILC service model relies upon various grant income and research council funding streams, along with revenue generated from charging for the service of the eDRIS team. SG and NHS NSS also contributed to some of the costs of setting up SILC in 2014. This mixed funding model remains in place, with some users (who grant fund SILC) accessing the service for free, at the point they undertake a research project, and others paying on a project-by-project basis.
As SILC was not constituted as a legal entity, the financial flows funding the data linkage service were supported by a set of bilateral MoAs, SLAs and other agreements between each of the funders and service partners. These arrangements, which exist still, do not lend themselves to ready appraisal of the cost effectiveness of the system as a whole in meeting its objectives, or of the individual parts therein. Due to the ending of some grants, it is likely that the SILC model will move to a worsening deficit position from FY 22/23. A predicted income and expenditure analysis is shown in the following table:
| FY 21/22 | FY 22/23 | FY 23/24 | FY 24/25 | FY 25/26 | |
|---|---|---|---|---|---|
| Income | £ | £ | £ | £ | £ |
| Grant funding – SG | 1,100,000 | 1,111,000 | 1,122,110 | 1,133,331 | 1,144,664 |
| Grant funding – ESRC | 1,817,000 | 1,485,000 | 1,485,000 | 1,485,000 | 1,485,000 |
| Grant funding – CSO | 150,000 | - | - | - | - |
| Grant funding - ADR S | 190,000 | 190,000 | 190,000 | 190,000 | 190,000 |
| Other grant funding | 563,549 | 320,215 | 86,882 | 86,882 | 58,597 |
| eDRIS income | 521,383 | 700,763 | 763,459 | 839,059 | 927,410 |
| Other income | - | - | - | - | - |
| Total | 4,341,932 | 3,806,978 | 3,647,451 | 3,734,272 | 3,805,672 |
| Expenditure | |||||
| Staff costs | 3,606,499 | 3,711,784 | 3,815,647 | 3,937,551 | 4,051,955 |
| Non staff costs | 601,858 | 696,316 | 696,316 | 696,316 | 696,316 |
| Transition & set up costs | - | - | - | - | - |
| Commissioning costs | - | - | - | - | - |
| Total | 4,208,357 | 4,408,100 | 4,511,963 | 4,633,866 | 4,748,271 |
| Surplus/deficit | 133,575 | (601,122) | (864,512) | (899,594) | (942,599) |
Alignment of these various funding sources through RDS, with single contracts for activity, is expected to promote more efficient and effective service provision, to better align incentives and to realise non-cash releasing efficiencies. In addition, it will allow for surpluses to be carried over and reinvested in the service and support access to public sector data for research with public benefit.
To achieve these benefits through the establishment of RDS will require a different model: modelling for RDS has been predicated on similar levels of grant funding as per the status quo but costs are based on a commissioning model. RDS has additional costs over the SILC model in respect of service development, staffing and transition costs relating to its establishment.
RDS Income
The income of RDS over the next five years is shown in the following table:
| FY 21/22 | FY 22/23 | FY 23/24 | FY 24/25 | FY 25/26 | |
|---|---|---|---|---|---|
| Income | £ | £ | £ | £ | £ |
| SG core grant | 5,000,000 | 5,000,000 | 5,000,000 | 5,000,000 | 5,000,000 |
| Grant funding from SG | 1,100,000 | 1,111,000 | 1,122,110 | 1,133,331 | 1,144,664 |
| Grant funding from SG (ADR UK/ADR-S)[12] | 1,011,000 | 578,325 | 593,355 | 608,386 | 623,750 |
| Grant funding from ESRC | 1,747,743 | 1,416,590 | 1,417,446 | 1,418,311 | 1,419,184 |
| Grant funding from CSO | 150,000 | 0 | 0 | 0 | 0 |
| Grant funding from ADR S | 190,000 | 190,000 | 190,000 | 190,000 | 190,000 |
| Grant funding from HDRUK | 466,667 | 233,333 | 0 | 0 | 0 |
| Other grant funding | 96,882 | 86,882 | 86,882 | 86,882 | 58,597 |
| eDRIS income | 521,383 | 700,763 | 763,459 | 839,059 | 927,410 |
| Total | 10,283,675 | 9,316,894 | 9,173,253 | 9,275,969 | 9,363,606 |
Forecast demand and volumes of work
The RDS income figures include estimates of likely demand for eDRIS. The demand modelling uses actual figures from previous years to develop ratios that allow prudent predictions on future project numbers, revenue and staffing requirements in future years.
The eDRIS calculations represent a 'stock and flow' approach: the model starts with an opening balance of projects to which new enquiries are added and closed projects/enquiries subtracted to give a closing balance for each year, which becomes the opening balance for the following year. The model shows increasing demand with progressively higher number of projects/enquiries. The increased demand is based on Covid 19 work, RDS having a growing number of datasets available, and greater efficiency reducing the average duration of projects and so increasing throughput.
| FY 21/22 | FY 22/23 | FY 23/24 | FY 24/25 | FY 25/26 | |
|---|---|---|---|---|---|
| Live enquiries & projects brought forward | 600 | 656 | 695 | 746 | 808 |
| New enquiries pa | 345 | 345 | 380 | 418 | 460 |
| Assumed growth rate of enquiries | 10% | 0% | 10% | 10% | 10% |
| Total enquiries/projects handled eDRIS pa | 945 | 1002 | 1075 | 1164 | 1268 |
| Project closure % pa | 30.6% | 30.6% | 30.6% | 30.6% | 30.6% |
| Enquiries & projects closed pa | 289 | 306 | 329 | 356 | 388 |
| Projects carried forward pa | 656 | 695 | 746 | 808 | 880 |
| % of completing projects issued fees pa | 20.8% | 20.8% | 20.8% | 20.8% | 20.8% |
| Number of projects issued fees | 60 | 64 | 68 | 74 | 81 |
| Average fee | £8.7k[13] | £11.0k | £11.2k | £11.3k | £11.5k |
| Revenue from projects | £522k | £701k | £763k | £839k | £927k |
RDS Expenditure
For the Financial Case, RDS's costs have been developed based on:
1. Ongoing operational costs – including staff costs and non-staff costs (eg premises, utilities, technology, and other equipment).
2. Transition and set up costs – the cost of setting up the new RDS organisation including one off transition costs such as website creation, development of systems, transition staff costs, and legal costs.
3. Commissioning costs – the costs to RDS of 'buying' services from RDS's partners such as EPCC, eDRIS, and NRS
4. Service development costs – the costs of service improvements (mainly enhancements such as synthetic data, case tracking system, analytical workbench, interoperability, support for the RSHs, geospatial data access, digital access platform) relating to RDS's transition to its Target Operating Model (TOM)
Based on the above categories, the financial model has predicted RDS's expenditure for the first five years of operations as follows:
| FY 21/22 | FY 22/23 | FY 23/24 | FY 24/25 | FY 25/26 | |
|---|---|---|---|---|---|
| Expenditure | £ | £ | £ | £ | £ |
| Staff costs | 1,394,181 | 1,360,138 | 1,383,887 | 1,571,409 | 1,597,304 |
| Non staff costs | 666,484 | 724,329 | 725,043 | 725,895 | 726,905 |
| Transition & set up costs | 475,000 | 215,000 | 90,000 | 90,000 | 90,000 |
| Commissioning costs | 4,512,935 | 4,636,714 | 4,759,257 | 4,900,027 | 5,033,486 |
| Service develop costs | 3,795,616 | 2,553,519 | 1,457,428 | 1,569,900 | 1,693,716 |
| Total expenditure | 10,844,216 | 9,469,701 | 8,415,614 | 8,857,231 | 9,141,412 |
| Surplus/(deficit) | (560,542) | (152,807) | 757,639 | 418,737 | 222,194 |
The financial modelling shows that RDS has a deficit of £561k in year one, a deficit of £153k in year two and has a surplus of £758k, £419k and £222k in years three, four and five respectively. In total, over the five years, the surplus is £685k with an average annual surplus of approximately £137k per year.
To test the robustness of this position, the financial model has included sensitivity analysis with various scenarios modelled to test their impact on the surplus position.
Sensitivity and Optimism Biases
The Financial Case offers a prudent and tested set of scenarios to draw out the nature and consequence of different financial risks:
- An end to the ESRC main grant in March 2022 (this is the biggest single grant) or an equivalent reduction in the SG core grant
- An end to all grant funding (except SG core grant/internal eDRIS grant funding)
- To mitigate optimism bias, an increase in costs (30% for staff costs, 20% for all other costs)
- A drop in eDRIS project volumes by 15%
- An increase in eDRIS project volumes by 15%
The different scenarios have been modelled and shown in the following table:
| Scenario | FY 21/22 | FY 22/23 | FY 23/24 | FY 24/25 | FY 25/26 |
|---|---|---|---|---|---|
| £ | £ | £ | £ | £ | |
| As modelled RDS I&E | (560,542) | (152,807) | 757,639 | 418,737 | 222,194 |
| As modelled SILC I&E | 133,575 | (601,122) | (864,512) | (899,594) | (942,599) |
| ESRC grant funding ends (or SG core grant reduces) Mar 2022 | (560,542) | (1,483,807) | (573,361) | (912,263) | (1,108,806) |
| All grant funding ends Mar 2022 | (560,542) | (1,759,397) | (849,808) | (1,189,574) | (1,386,990) |
| Staff costs +30%, other costs +20% | (2,475,181) | (1,793,068) | (677,900) | (1,129,335) | (1,389,944) |
| Volume -15% pa from FY 21/22 | (524,847) | (96,277) | 857,932 | 571,147 | 425,517 |
| Volume +15% pa from FY 21/22 | (567,681) | (179,194) | 707,467 | 341,131 | 115,922 |
This can also be seen in the following graph:
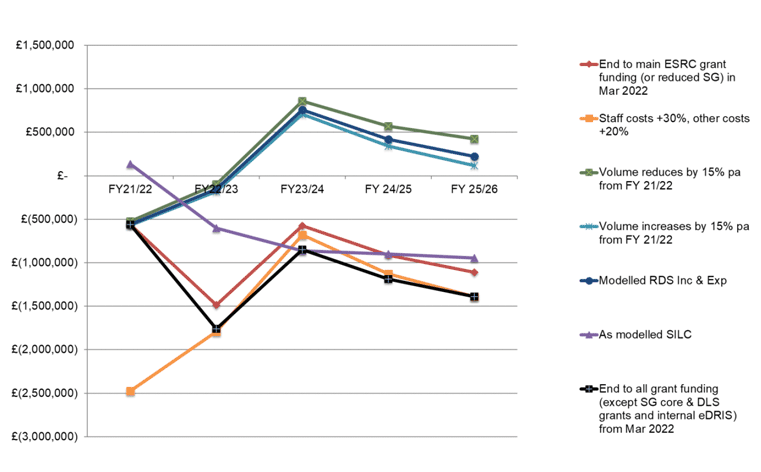
Financial Sustainability and Risk
As shown above, whilst the base case is positive, some of the sensitivities are in a deficit position. This includes the scenario whereby the current ESRC budget is cut from March 2022 (average deficit of £0.9m pa), and the scenario whereby all grant funding (with the exception of the DSLS, which is in the control of SG) is cut (average deficit of £1.1m pa). In these scenarios, RDS could be returned to a surplus position by reducing/delaying the amount spent on service development.
The other sensitivity showing a deficit position assesses an increase in staff costs of 30% and an increase in other costs of 25%: this scenario has an average deficit of £1.5m pa. This scenario is included to counter optimism bias but again the deficit could be returned to a surplus position by reducing/delaying the amount spent on service development. Many of the costs in the financial model are based on actual costs, so optimism bias is not believed to be an issue for RDS's financial position; however, RDS has started to recruit staff and, based on the reality in the current jobs market, staff costs have been increased and this is reflected in these figures. This this risk should be monitored carefully.
The financial model has shown that, at present, based on the assumptions used, there is a surplus position and RDS would be financially sustainable. The sensitivity analysis highlights the reliance of RDS on SG core grant funding. Once established, the financial position will be improved through greater efficiency, cost reduction, increased revenue, and through securing further grant funding. Whilst these actions are aligned to the benefits of RDS, it is unlikely that RDS will be able to achieve them in the short term. Consequently, the core SG grant is vital to underwrite RDS.
Factors affecting RDS's costs:
Experience delivering data driven research highlights the significant costs associated with supporting researchers and provisioning high-quality linkage-ready datasets. Efforts to improve consistency in data quality and metadata standards across the Scottish public sector will work to drive down the costs of conducting research. In addition, making better information about existing data sources available publicly will also help manage the burden on the service (research co-ordinators and data controllers) and support a more informed user community.
Other efficiencies along the data pipeline are being tested both in Scotland and elsewhere and learnings from this can inform changes to RDS processes to improve efficiency and drive down costs.
Charges levied on users arguably do not reflect the full cost of provision and continue to be supported by grant funding. Preliminary analysis of management information from the existing service model suggests significant time is spent on pro-bono work that is not invoiced. A review of charging structures and fees will be undertaken in the first year of RDS's operations.
The financial figures have been further developed during the development of the FBC and have been presented to the Transition Board.
Other financial risks facing RDS and the Financial Case modelling include:
- Accuracy of the baseline costs, although most are based on historic actual costs
- Ability to forecast demand and revenue – historically this has been a problem for the whole service model (linkage and non-linkage) and has had direct implications for staff capacity and ability of the entire journey to be managed, free of bottle-necks while also ensuring staff are always fully utilised. This is particularly relevant as RDS increases the number of datasets that are available for research
- Complexity of projects to be undertaken and estimated time required from staff members
- Optimal staff resource – level of resourcing, skills, expertise, turnover and capacity
- Costs and resource estimates.
How could RDS be funded?
UK-wide Public Sector Data Access
An assessment of the wider UK landscape reveals considerable variation in how data access arrangements for public sector data are delivered via institutional and financial frameworks.
A number of the data access platforms/services are located within academic institutions and/or public sector bodies. In all cases, these rely on some level of ongoing public sector funding. This is the case for the SAIL databank (Swansea University), which is part-funded by Health and Care Wales and the Welsh Government. The Secure Research Service within Office of National Statistics (ONS), the UK Data Service and NHS Digital all receive support via research councils and central government departments to commission relevant services for making public sector data available for public benefit research. Some of these institutions are able to supplement service provision with income from commercial activity in other parts of their business model.
The analysis of fees charged for services in other parts of the UK suggests these are subsidised and not representative of the full economic cost of providing them. This mixed model of funding is typical and represents how the service model in Scotland has worked to date.
Further work in the coming year will explore an acceptable compromise on fees and charges – such that RDS remains an attractive offer to researchers and others wishing to access public sector data, while remaining on a healthy financial footing.
Income Generation
RDS will have opportunities to generate income from:
- Charging for its research co-ordinator service and for the costs associated with accessing datasets
- Charging for analytical support
- Annual subscription fees to potential users
- Profit-sharing arrangements where proceeds from IPR over products derived from accessing the data could potentially be shared with RDS in order to reinvest in the services and data
- Developing synthetic data.
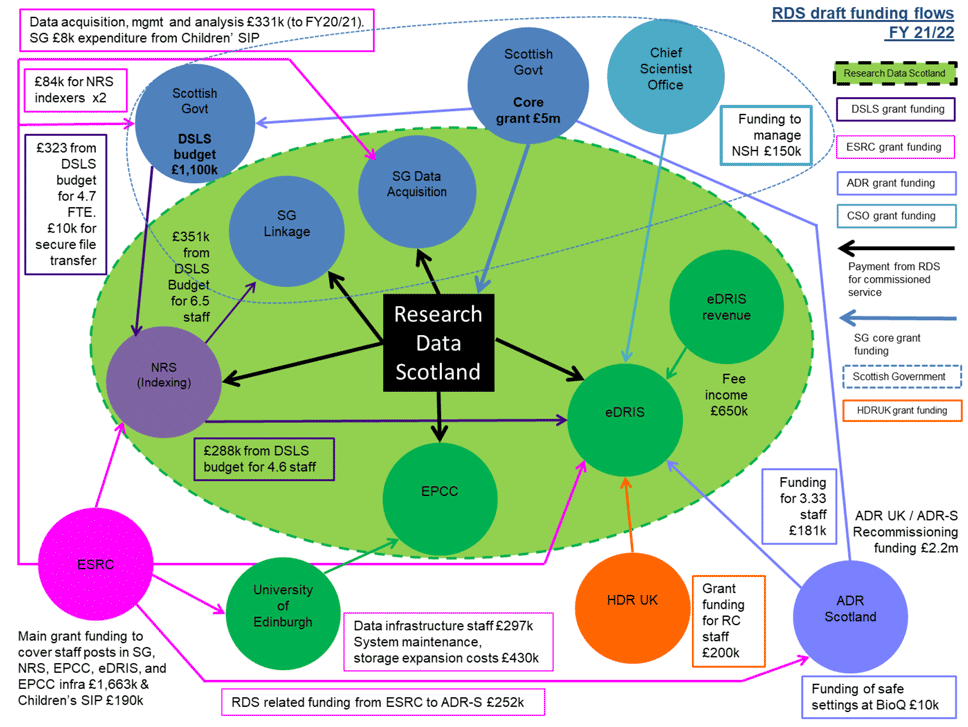
Future funding flows
The future funding flows are shown in the following diagram. Funding mechanisms will be updated once commissioning arrangements have been established. This includes the newly secured grant funding from ADR UK/ADR-S to SG.
FY 21/22 Budget
Based on the financial model's income and expenditure, an initial budget has been developed for FY 21/22 and is shown in Appendix Five.
Conclusion
The Financial Case presents the income and expenditure estimates for RDS, based on past and recent business activity and estimates of forward demand, presenting a set of 5-year income and expenditure positions and net financial position. This analysis includes conversations with service providers and funders and with those involved in delivering the Covid 19 research data service.
The setup of RDS is based on the current data linkage service model, which will gradually transition into the new data linkage and access model based on the commissioning of services from existing partners.
The financial model has shown that, at present, based on the assumed future service model, which includes development of the service, and a core grant of £5m from SG, there is an average surplus position of approximately £137k per annum (compared to an average deficit for the status quo of £635k) and RDS would be sustainable. This financial position remains sensitive to increased costs and this will require to be monitored once RDS is operational.
Contact
Email: researchdata@gov.scot