
Programme for International Student Assessment 2025: national report for Scotland
This report presents Scotland’s results from the OECD’s Programme for International Student Assessment (PISA), examining the performance and experiences of 15 year old pupils and how these compare internationally and over time.
4 Performance in science
4.1 How science was assessed
Science was the major domain in PISA 2025. This means science received more assessment time than mathematics or reading, which were assessed as minor domains. Science was previously the main domain in the 2015 and 2006 PISA cycles.
The science assessment measures pupils’ ability to engage with science related issues and use scientific knowledge, information and evidence to make informed decisions.
The PISA 2025 science framework builds on those from 2006 and 2015, while introducing several important changes. There were four major changes to the science assessment framework for PISA 2025:
- Two previous competencies were combined into a single competency covering scientific enquiry and the interpretation of scientific evidence.
- A new competency was introduced on researching, evaluating and using scientific information for decision making and action.
- The framework broadened its focus beyond scientific literacy to reflect the wider aims of science education.
- A new environmental science component (‘Agency in the Anthropocene’) was introduced.
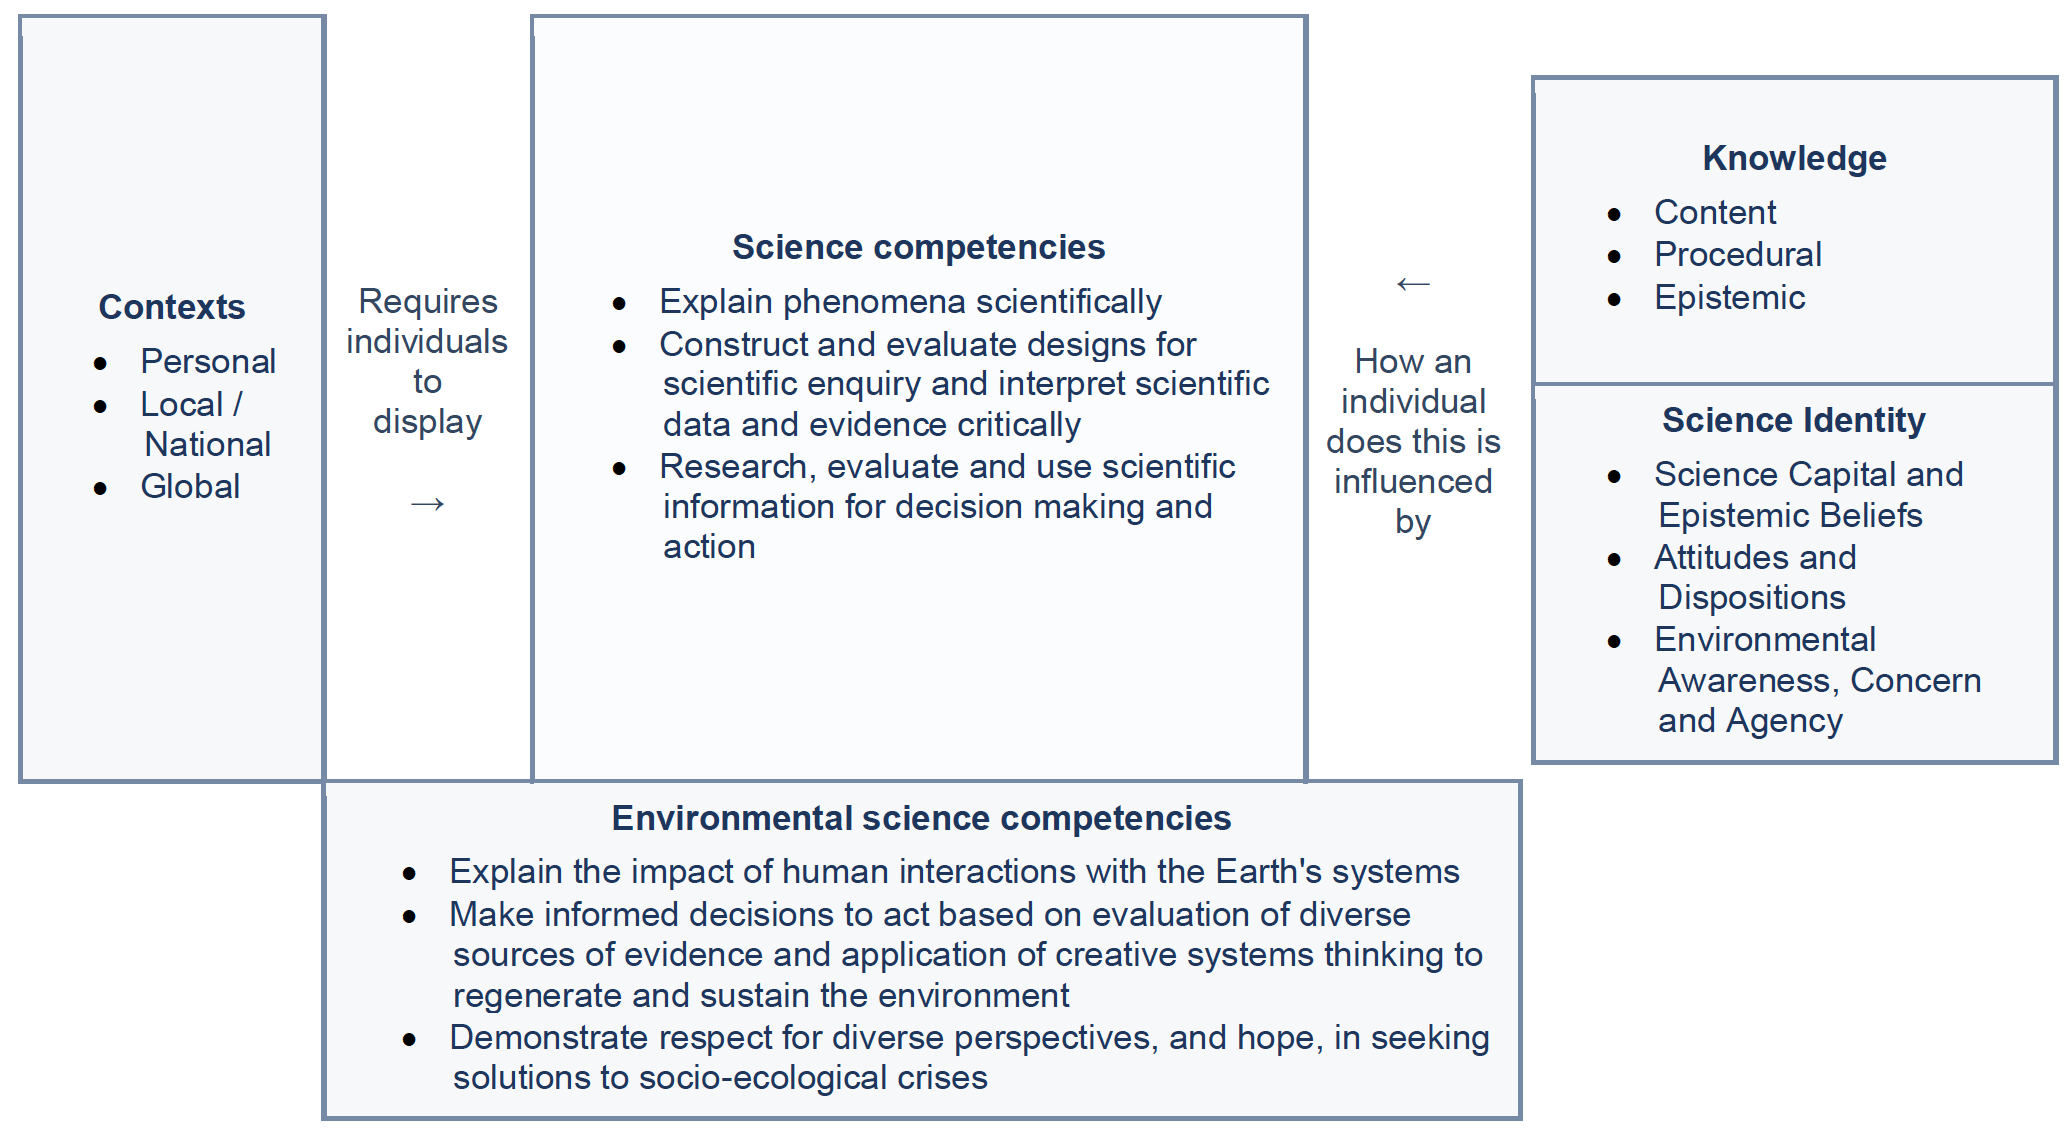
Overall, the framework assessed pupils’ ability to apply scientific thinking to environmental and societal challenges, distinguish evidence from opinion, and use scientific knowledge to inform decisions and action. See Figure 4.1 below.
Graphic text below:
Contexts
- Personal
- Local / National
- Global
Requires individuals to display
Science competencies
- Explain phenomena scientifically
- Construct and evaluate designs for scientific enquiry and interpret scientific data and evidence critically
- Research, evaluate and use scientific information for decision making and action
How an individual does this is influenced by
Knowledge
- Content
- Procedural
- Epistemic
Science Identity
- Science Capital and Epistemic Beliefs
- Attitudes and Dispositions
- Environmental Awareness, Concern and Agency
Environmental science competencies
- Explain the impact of human interactions with the Earth's systems
- Make informed decisions to act based on evaluation of diverse sources of evidence and application of creative systems thinking to regenerate and sustain the environment
- Demonstrate respect for diverse perspectives, and hope, in seeking solutions to socio-ecological crises
4.1.1 Science competencies
PISA 2025 assessed three science competencies in personal, local, national and global contexts.
The first science competency, ‘Explain phenomena scientifically’, was also assessed in 2006 and 2015, when science was the major domain. It focuses on pupils’ ability to explain natural and technological phenomena using scientific knowledge.
For PISA 2025, two competencies used in earlier cycles - ‘Evaluate and design scientific enquiry’ and ‘Interpret data and evidence scientifically’ - were combined into a single competency: ‘Construct and evaluate designs for scientific enquiry and interpret scientific data and evidence critically’. This assesses pupils’ ability to evaluate the design of scientific investigations and interpret scientific evidence critically.
A third competency was introduced in PISA 2025: ‘Research, evaluate and use scientific information for decision making and action’. It assesses pupils’ ability to locate, evaluate and use scientific information when making decisions.
4.1.2 Environmental science competencies
PISA 2025 also introduced three environmental science competencies, relating to how pupils use scientific knowledge to understand and respond to environmental and sustainability issues. The OECD refers to this component as ‘Agency in the Anthropocene’. It describes pupils’ capacity to understand the effects of human activity on the environment and to use scientific knowledge, critical thinking and collaboration to support sustainable futures.
The three main environmental science competencies for PISA 2025 included the ability to:
- explain the effects of human interactions with the Earth’s systems
- make informed decisions and take action by evaluating diverse sources of evidence and applying creative and systems thinking to regenerate and sustain the environment
- demonstrate respect for diverse perspectives when seeking solutions to socio-ecological crises
Detailed findings on pupils’ performance in environmental science are presented in Chapter 8, alongside findings on their environmental awareness, attitudes and actions.
4.2 Scotland’s performance in science
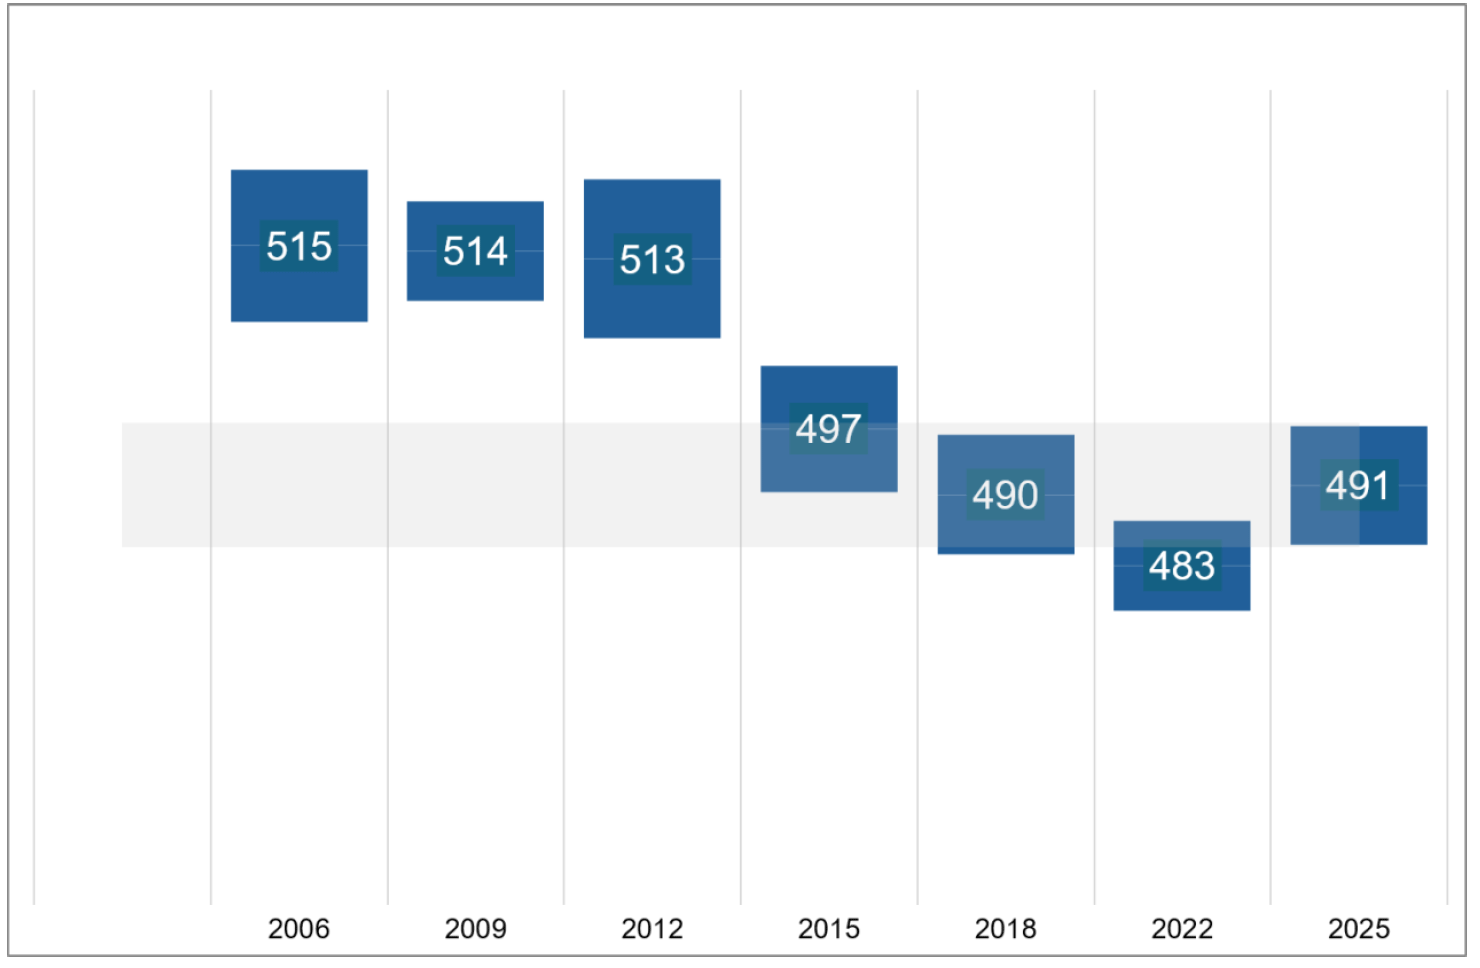
Scotland’s average score in science in PISA 2025 was 491 points. This was not statistically significantly different from its score of 483 points in 2022, indicating that science performance has remained broadly stable since the previous assessment cycle.
Despite this stability in the most recent cycle, Scotland’s science performance has declined over the longer-term. Scotland’s average science score was 515 points in 2006, when science was first assessed as the major domain. Performance remained at a similar level in 2009 (514 points) and 2012 (513 points), before falling to 497 points in 2015. The score declined further to 490 points in 2018 and 483 points in 2022, before rising to 491 points in 2025.
Scotland’s average science score in PISA 2025 was significantly lower than in 2006, 2009 and 2012. However, there was no statistically significant difference between Scotland’s performance in 2025 and its performance in 2015, 2018, or 2022.
Figure 4.2 shows trends in Scotland’s average science performance since 2006. Overall, Scotland’s science performance in 2025 was significantly lower than in the first three PISA science cycles, but was not significantly different from any of the three previous assessment cycles.
4.3 Science performance by sex
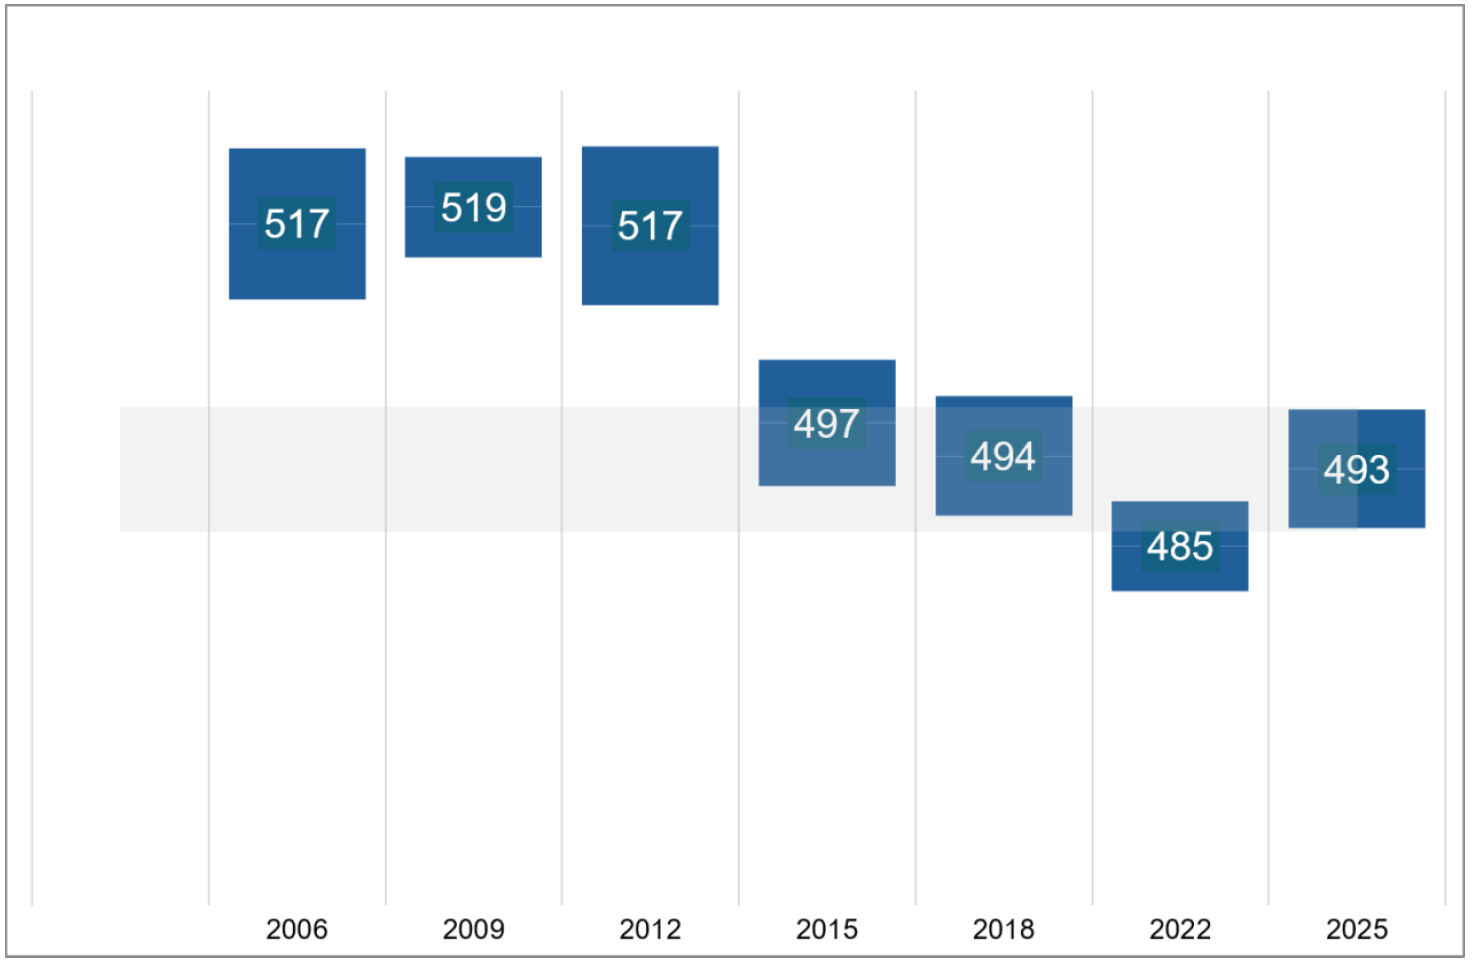
In PISA 2025, boys in Scotland achieved a mean science score of 493 points, compared with 490 points for girls. The difference was not statistically significant, indicating no significant difference in science performance between boys and girls.
Science performance among both boys and girls was significantly lower in 2025 than in the earliest PISA science cycles. Among boys, the mean science score was 493 points in 2025. This was significantly lower than boys’ performance in 2006, 2009 and 2012, but was not significantly different from their performance in 2015, 2018 or 2022.
A similar pattern was observed among girls. The mean science score for girls was 490 points in 2025. This was significantly lower than girls’ performance in 2006, 2009 and 2012, but was not significantly different from their performance in 2015, 2018 or 2022.
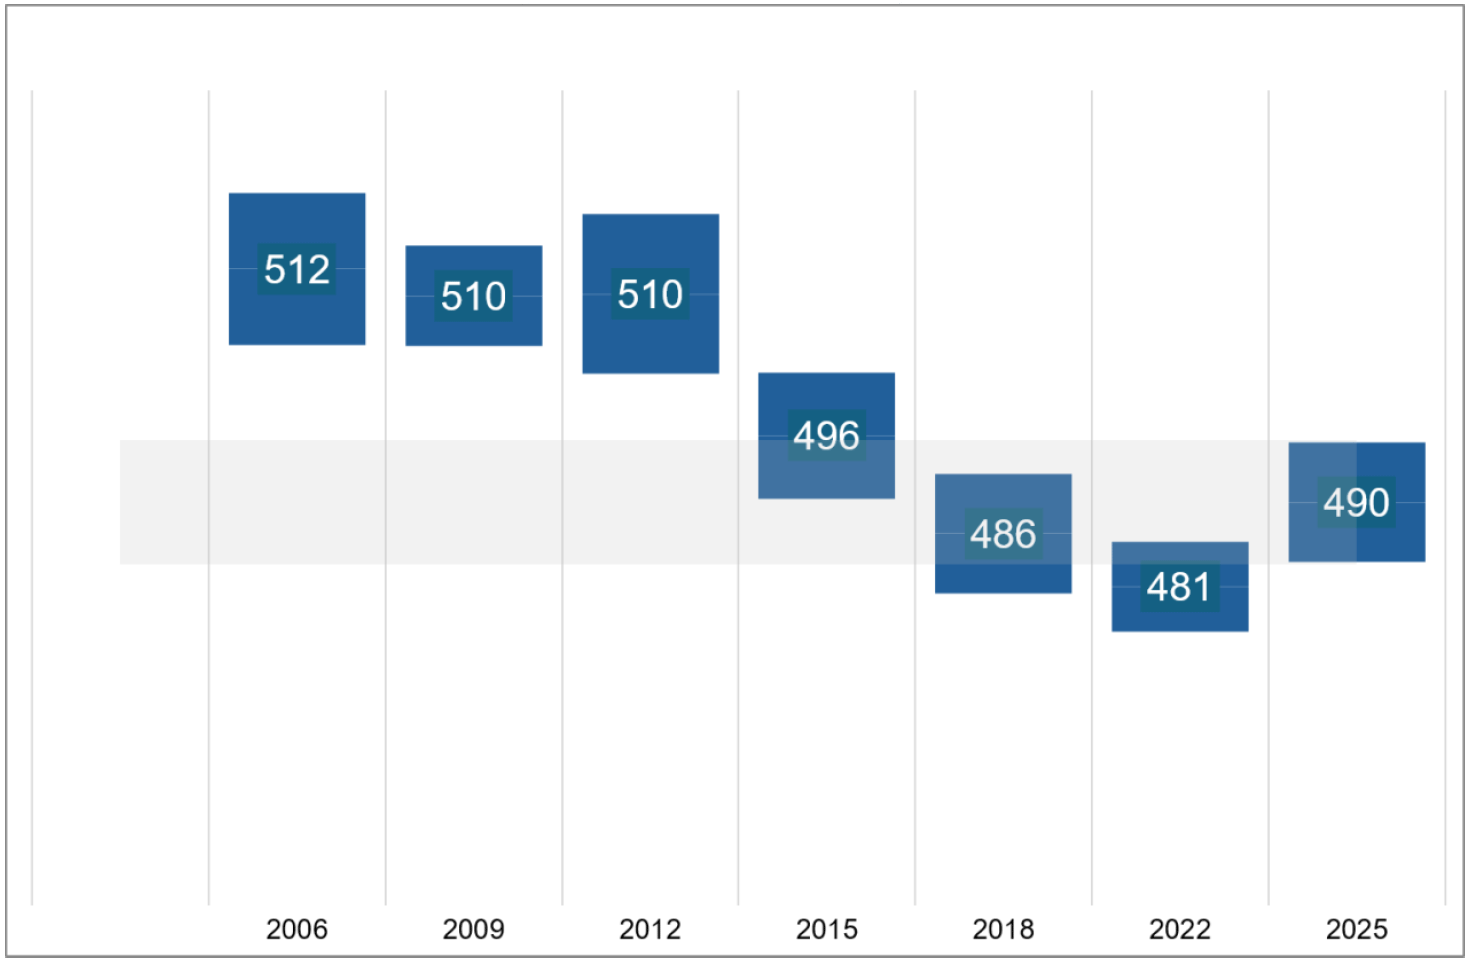
Overall, the longer-term decline in science performance has been evident among both boys and girls. For both groups, performance in 2025 was significantly lower than in 2006, 2009 and 2012, but was not significantly different from performance in 2015, 2018 or 2022.
4.4 Science performance across the United Kingdom
Scotland achieved a mean science score of 491 points, compared with 511 points for the United Kingdom as a whole. Scotland’s performance was significantly lower than the UK average and England (516 points), significantly higher than Wales (476 points), and not significantly different from Northern Ireland (492 points).
The same pattern was evident for both boys and girls. Among girls, Scotland’s mean science score was 490 points. This was significantly lower than the mean score for girls in England, significantly higher than in Wales, and not significantly different from Northern Ireland. Among boys, Scotland’s mean score was 493 points. This was significantly lower than the mean score for boys in England, significantly higher than in Wales, and not significantly different from Northern Ireland.
Overall, Scotland’s science performance was significantly lower than England and the UK average, significantly higher than Wales, and not significantly different from Northern Ireland. The same pattern was evident for both boys and girls.
4.5 How Scotland’s science performance compares internationally
Across all pupils, Scotland achieved a mean science score of 491 points. This was significantly higher than the OECD average of 482 points.
Scotland’s science performance was significantly lower than 10 countries and UK administrations, including Japan, Estonia, Korea, Australia, Finland and Ireland. The highest-performing countries were Japan, Estonia and Korea.
Scotland performed at a statistically similar level to 14 countries and UK administrations, including Austria, Poland, and Sweden.
Scotland performed significantly higher than 16 countries and UK administrations, including Denmark, Greece, and Spain.
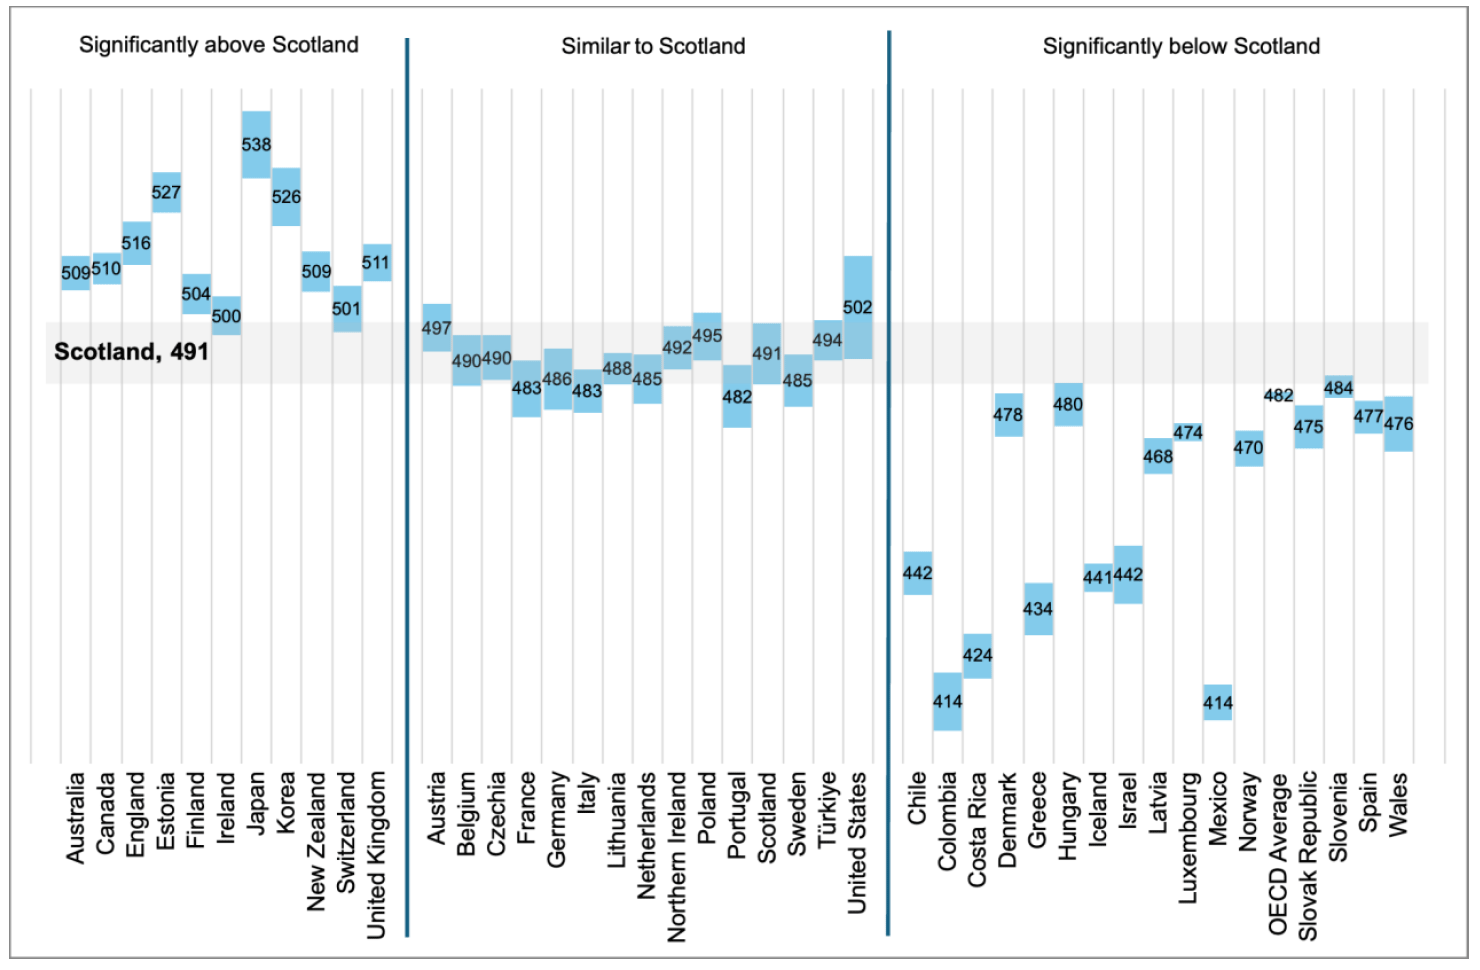
Table 4.1: OECD countries and UK administrations, higher than, similar to and lower than Scotland in science, PISA 2025
Higher score than Scotland
- Australia (509)
- Canada (510)
- England (516)
- Estonia (527)
- Finland (504)
- Ireland (500)
- Japan (538)
- Korea (526)
- New Zealand (509)
- Switzerland (501)
- United Kingdom (511)
Similar score to Scotland
- Austria (497)
- Belgium (490)
- Czechia (490)
- France (483)
- Germany (486)
- Italy (483)
- Lithuania (488)
- Netherlands (485)
- Northern Ireland (492)
- Poland (495)
- Portugal (482)
- Scotland (491)
- Sweden (485)
- Türkiye (494)
- United States (502)
Lower score than Scotland
- Chile (442)
- Colombia (414)
- Costa Rica (424)
- Denmark (478)
- Greece (434)
- Hungary (480)
- Iceland (441)
- Israel (442)
- Latvia (468)
- Luxembourg (474)
- Mexico (414)
- Norway (470)
- OECD Average (482)
- Slovak Republic (475)
- Slovenia (484)
- Spain (477)
- Wales (476)
Across the OECD, science performance was broadly stable between 2022 and 2025, with no significant change in the average across countries and no significant change in most participating systems. This is consistent with Scotland’s recent pattern. However, the wider OECD picture also shows a longer-term decline and a widening gap between lower- and higher-performing pupils, with particularly weak trends among those at the lower end of the performance distribution. This provides important context for Scotland, where the longer-term decline and the proportion of pupils below baseline proficiency remain more significant concerns than the change since 2022.
4.6 International comparisons by sex
The pattern of international comparisons differed somewhat between boys and girls.
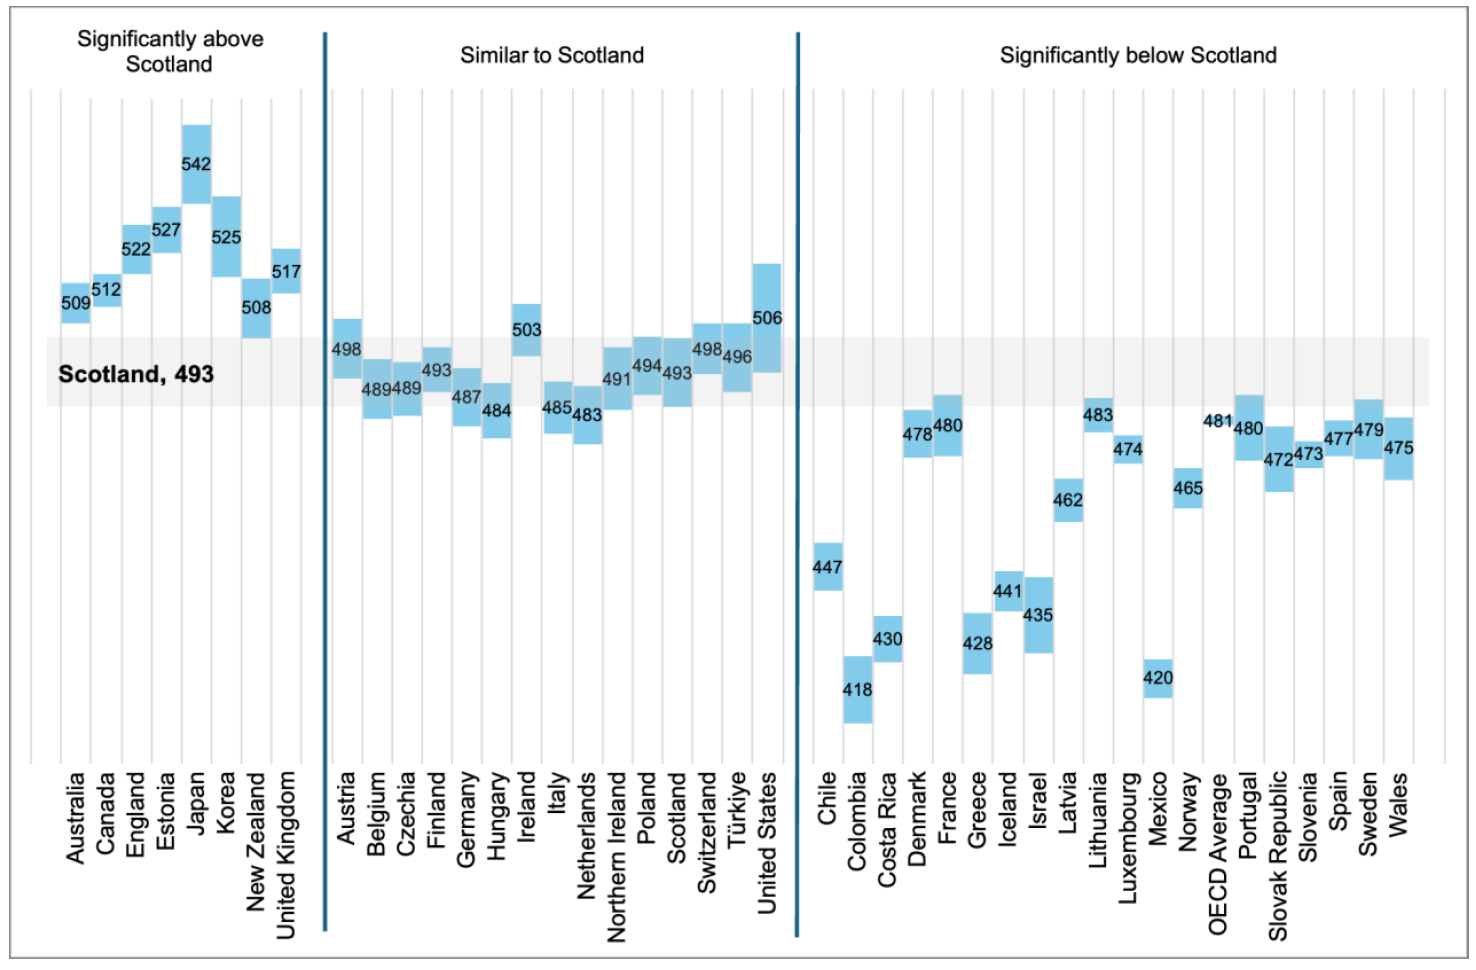
Among boys, Scotland achieved a mean science score of 493 points, which was significantly higher than the OECD average for boys (481 points). Scotland’s performance among boys was significantly lower than 7 countries and UK administrations, including Australia, Estonia and Japan; statistically similar to 14, including Austria, Belgium and Ireland; and significantly higher than 19, including Denmark, France and Wales.
Among girls, Scotland achieved a mean science score of 490 points, which was statistically similar to the OECD average for girls (483 points). Scotland’s performance among girls was significantly lower than 9 countries and UK administrations, including Estonia, Finland and Australia; statistically similar to 16, including Poland, Germany and Ireland; and significantly higher than 15, including Denmark, Latvia and Spain.
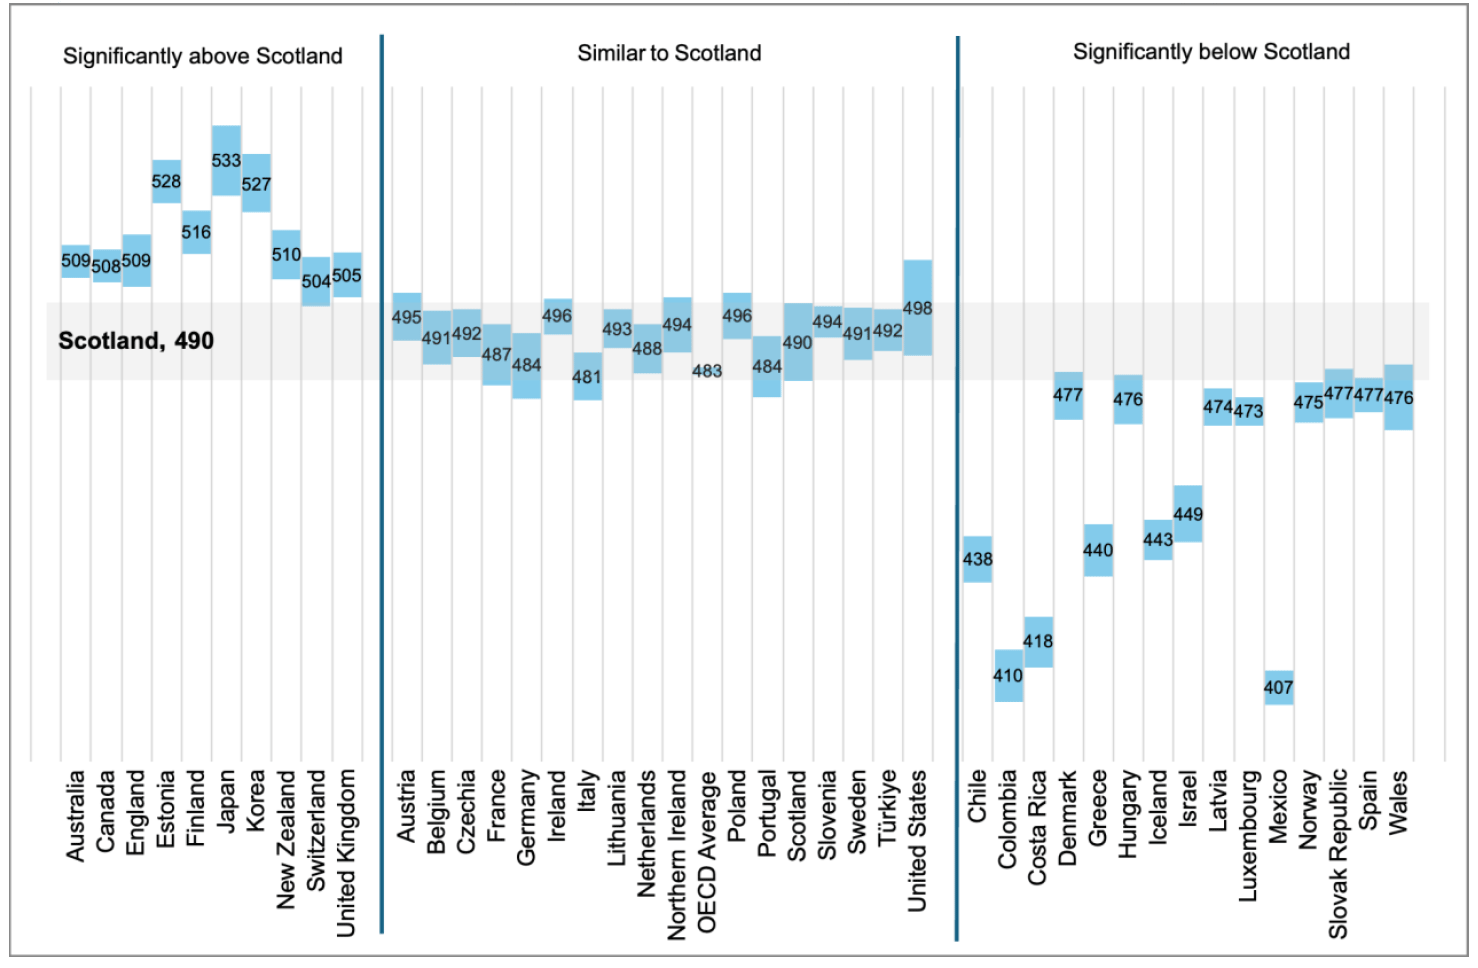
Relative to other participating systems, the results for Scottish boys were somewhat stronger than those for Scottish girls. Boys scored significantly above the OECD average, while girls performed at a statistically similar level. However, both remained below the highest performing education systems.
4.7 Science performance by proficiency level
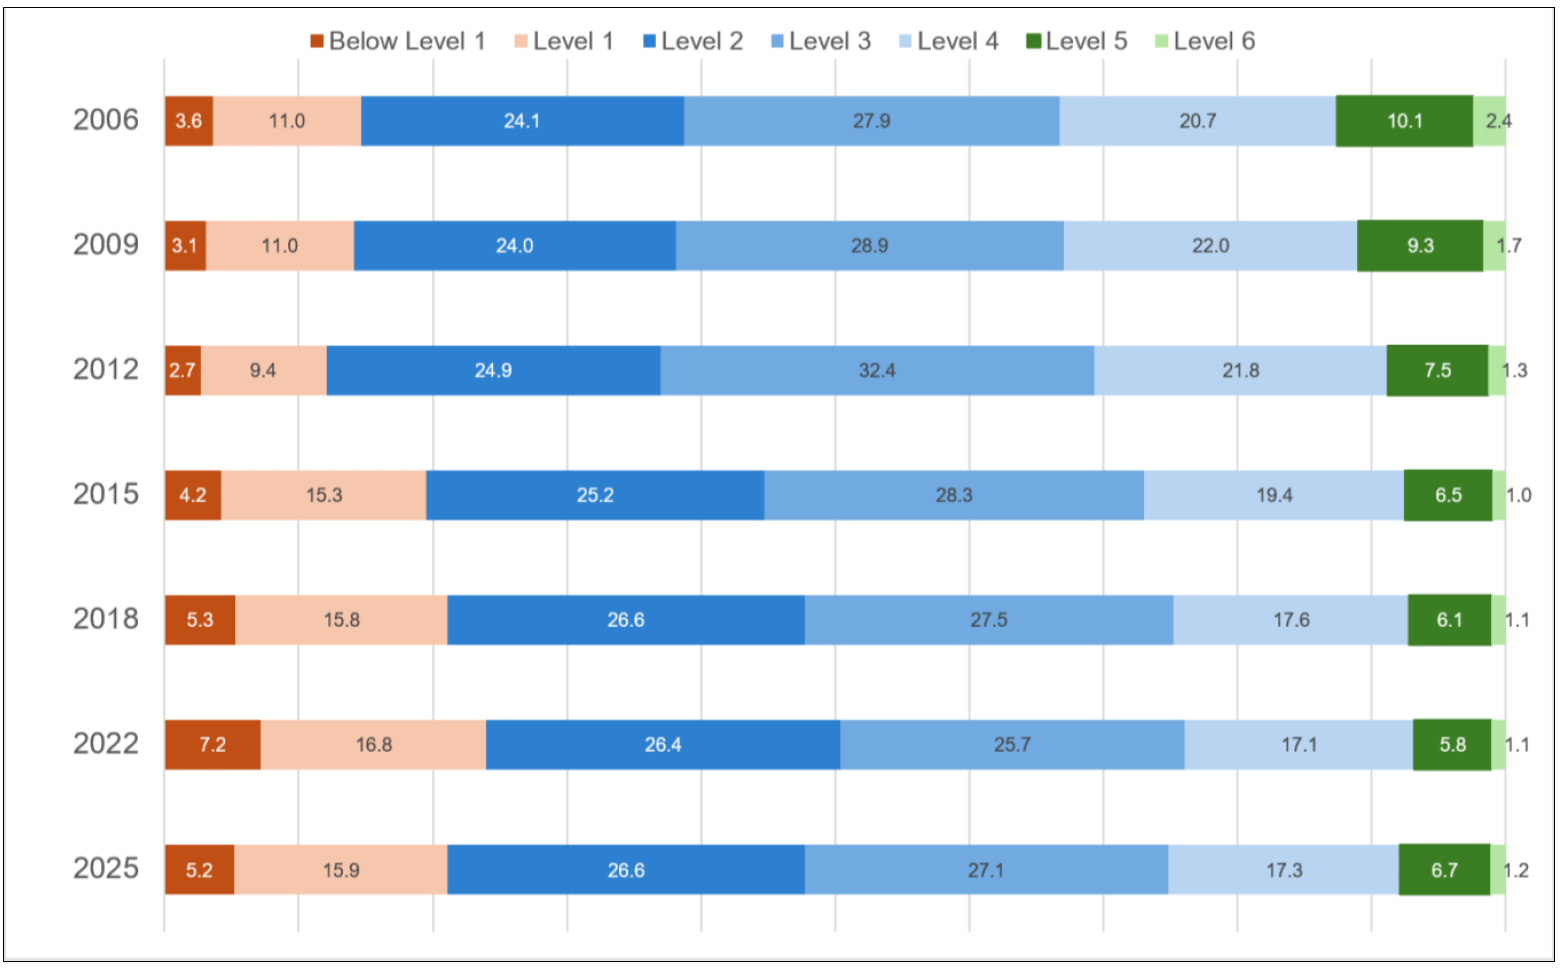
PISA reports performance using a series of proficiency levels that describe the types of scientific tasks pupils can typically complete. Pupils performing at Level 2 or above are considered to have achieved the baseline level of scientific proficiency required to engage effectively with science-related issues and situations. Pupils performing below Level 2 are more likely to face difficulties applying scientific knowledge and reasoning in everyday contexts. Pupils performing at Level 5 or above are considered high performers.
In 2025, 21.1% of Scottish pupils performed below Level 2. This was significantly higher than in 2006 (14.6%), 2009 (14.1%) and 2012 (12.1%), but was not significantly different from 2015, 2018 or 2022. Although the proportion was lower in 2025 than in 2022 (24.0%), this difference was not statistically significant.
At the upper end of the proficiency scale, 7.9% of pupils performed at Level 5 or above in 2025. This was significantly lower than in 2006 (12.6%), but was not significantly different from 2009, 2012, 2015, 2018 or 2022.
Overall, compared with the earliest PISA science cycles, a significantly higher proportion of pupils performed below the baseline level of science proficiency in 2025. The proportion of high performers was also significantly lower than in 2006. However, there was no statistically significant change in either the proportion performing below Level 2 or the proportion performing at Level 5 or above between 2022 and 2025.
4.7.1 International comparison of science proficiency levels
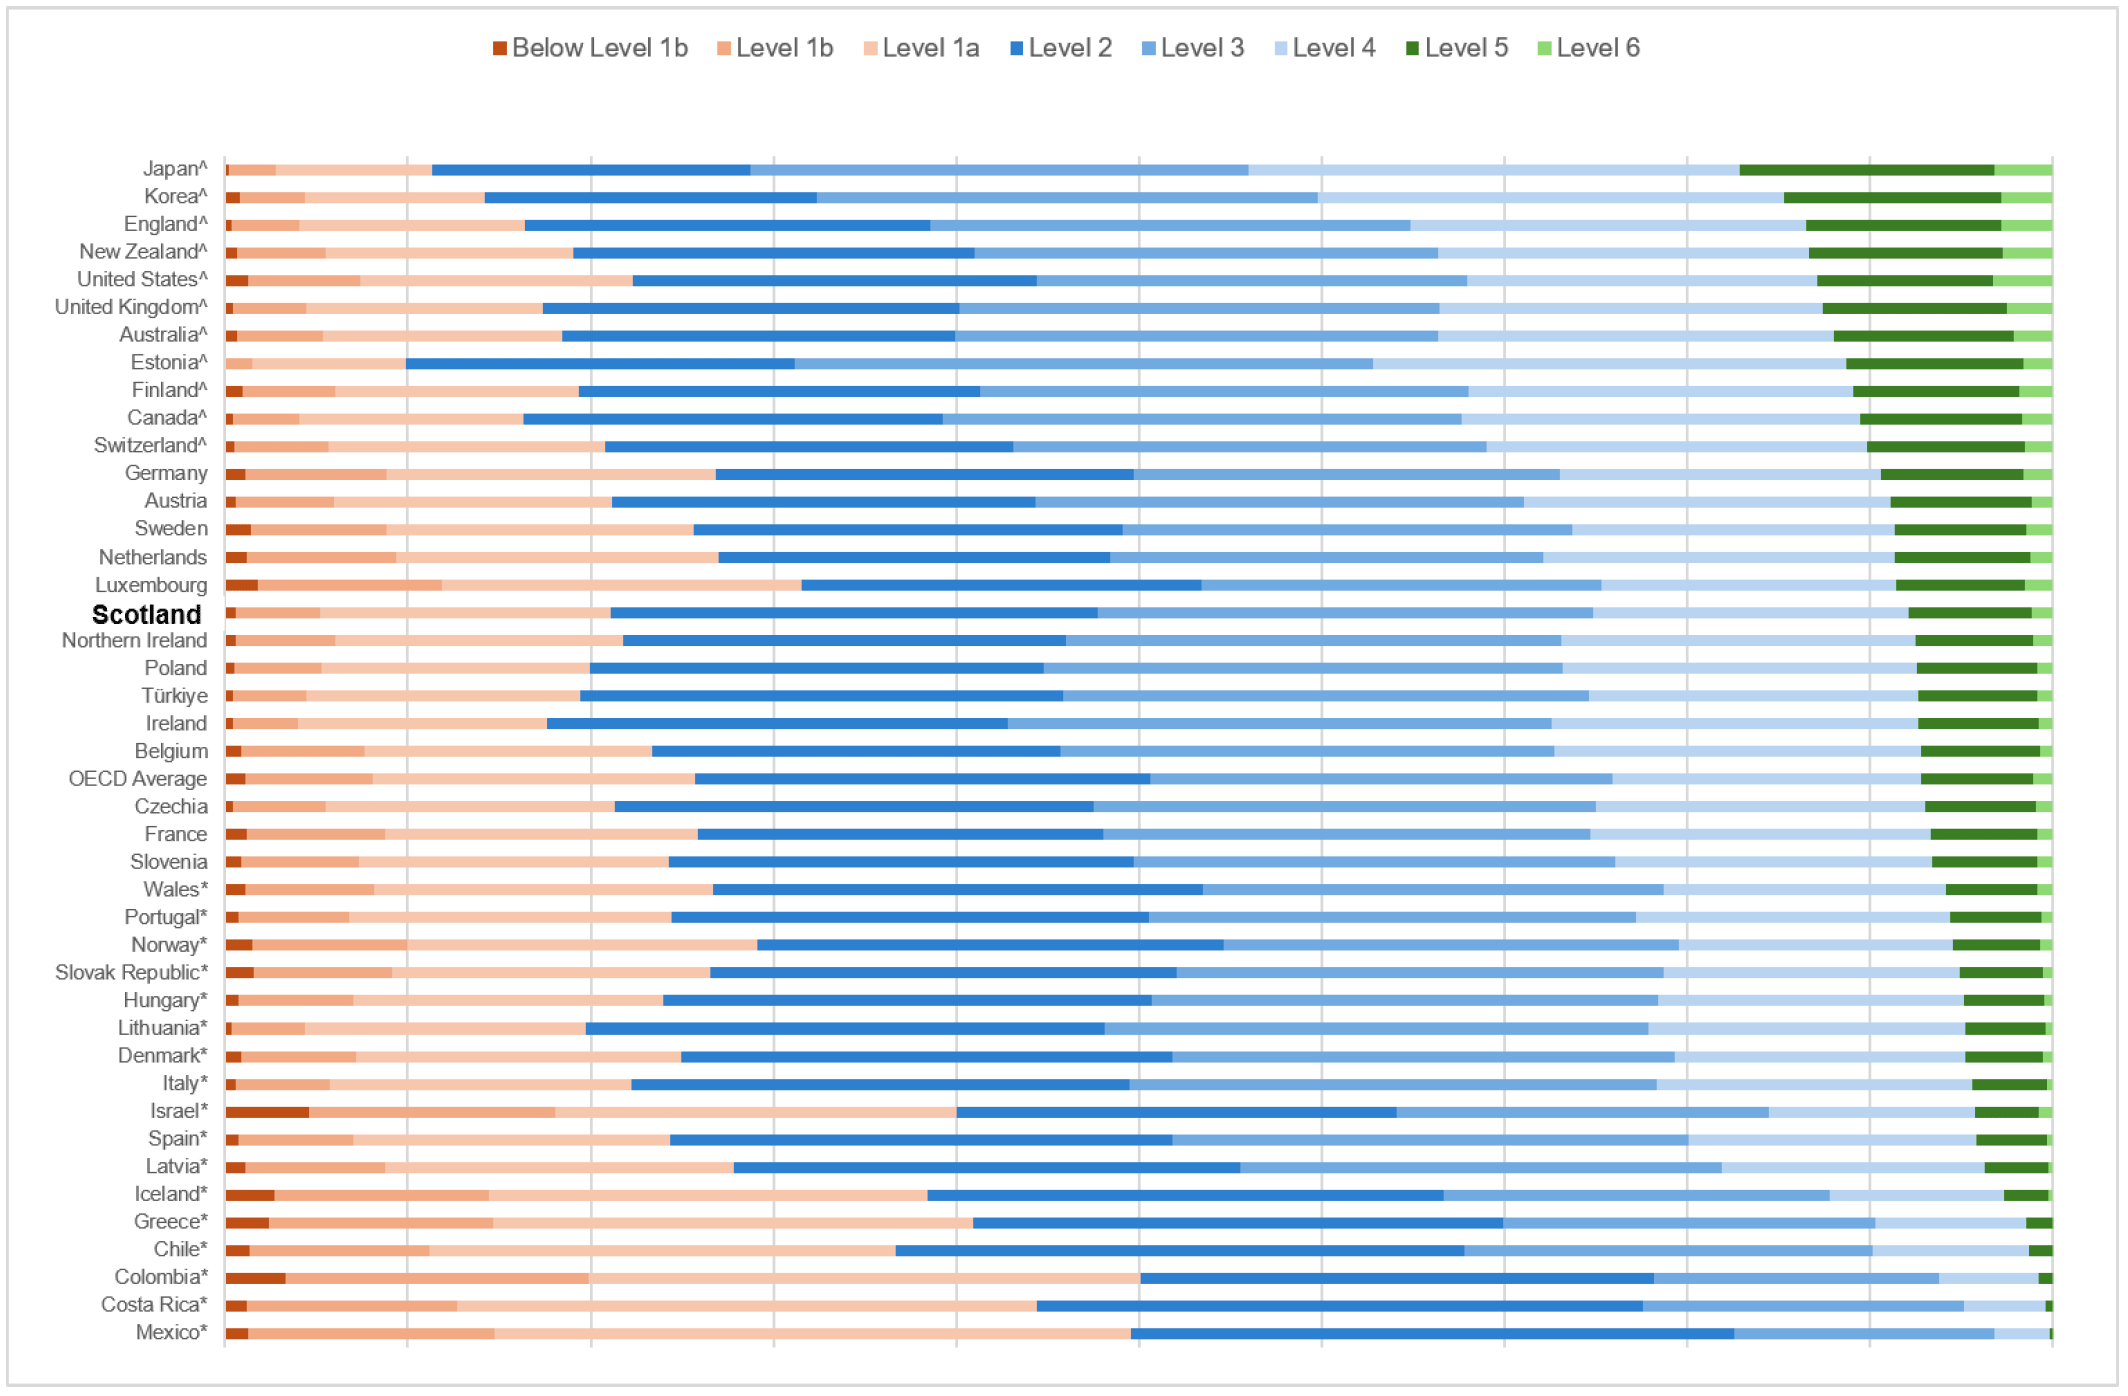
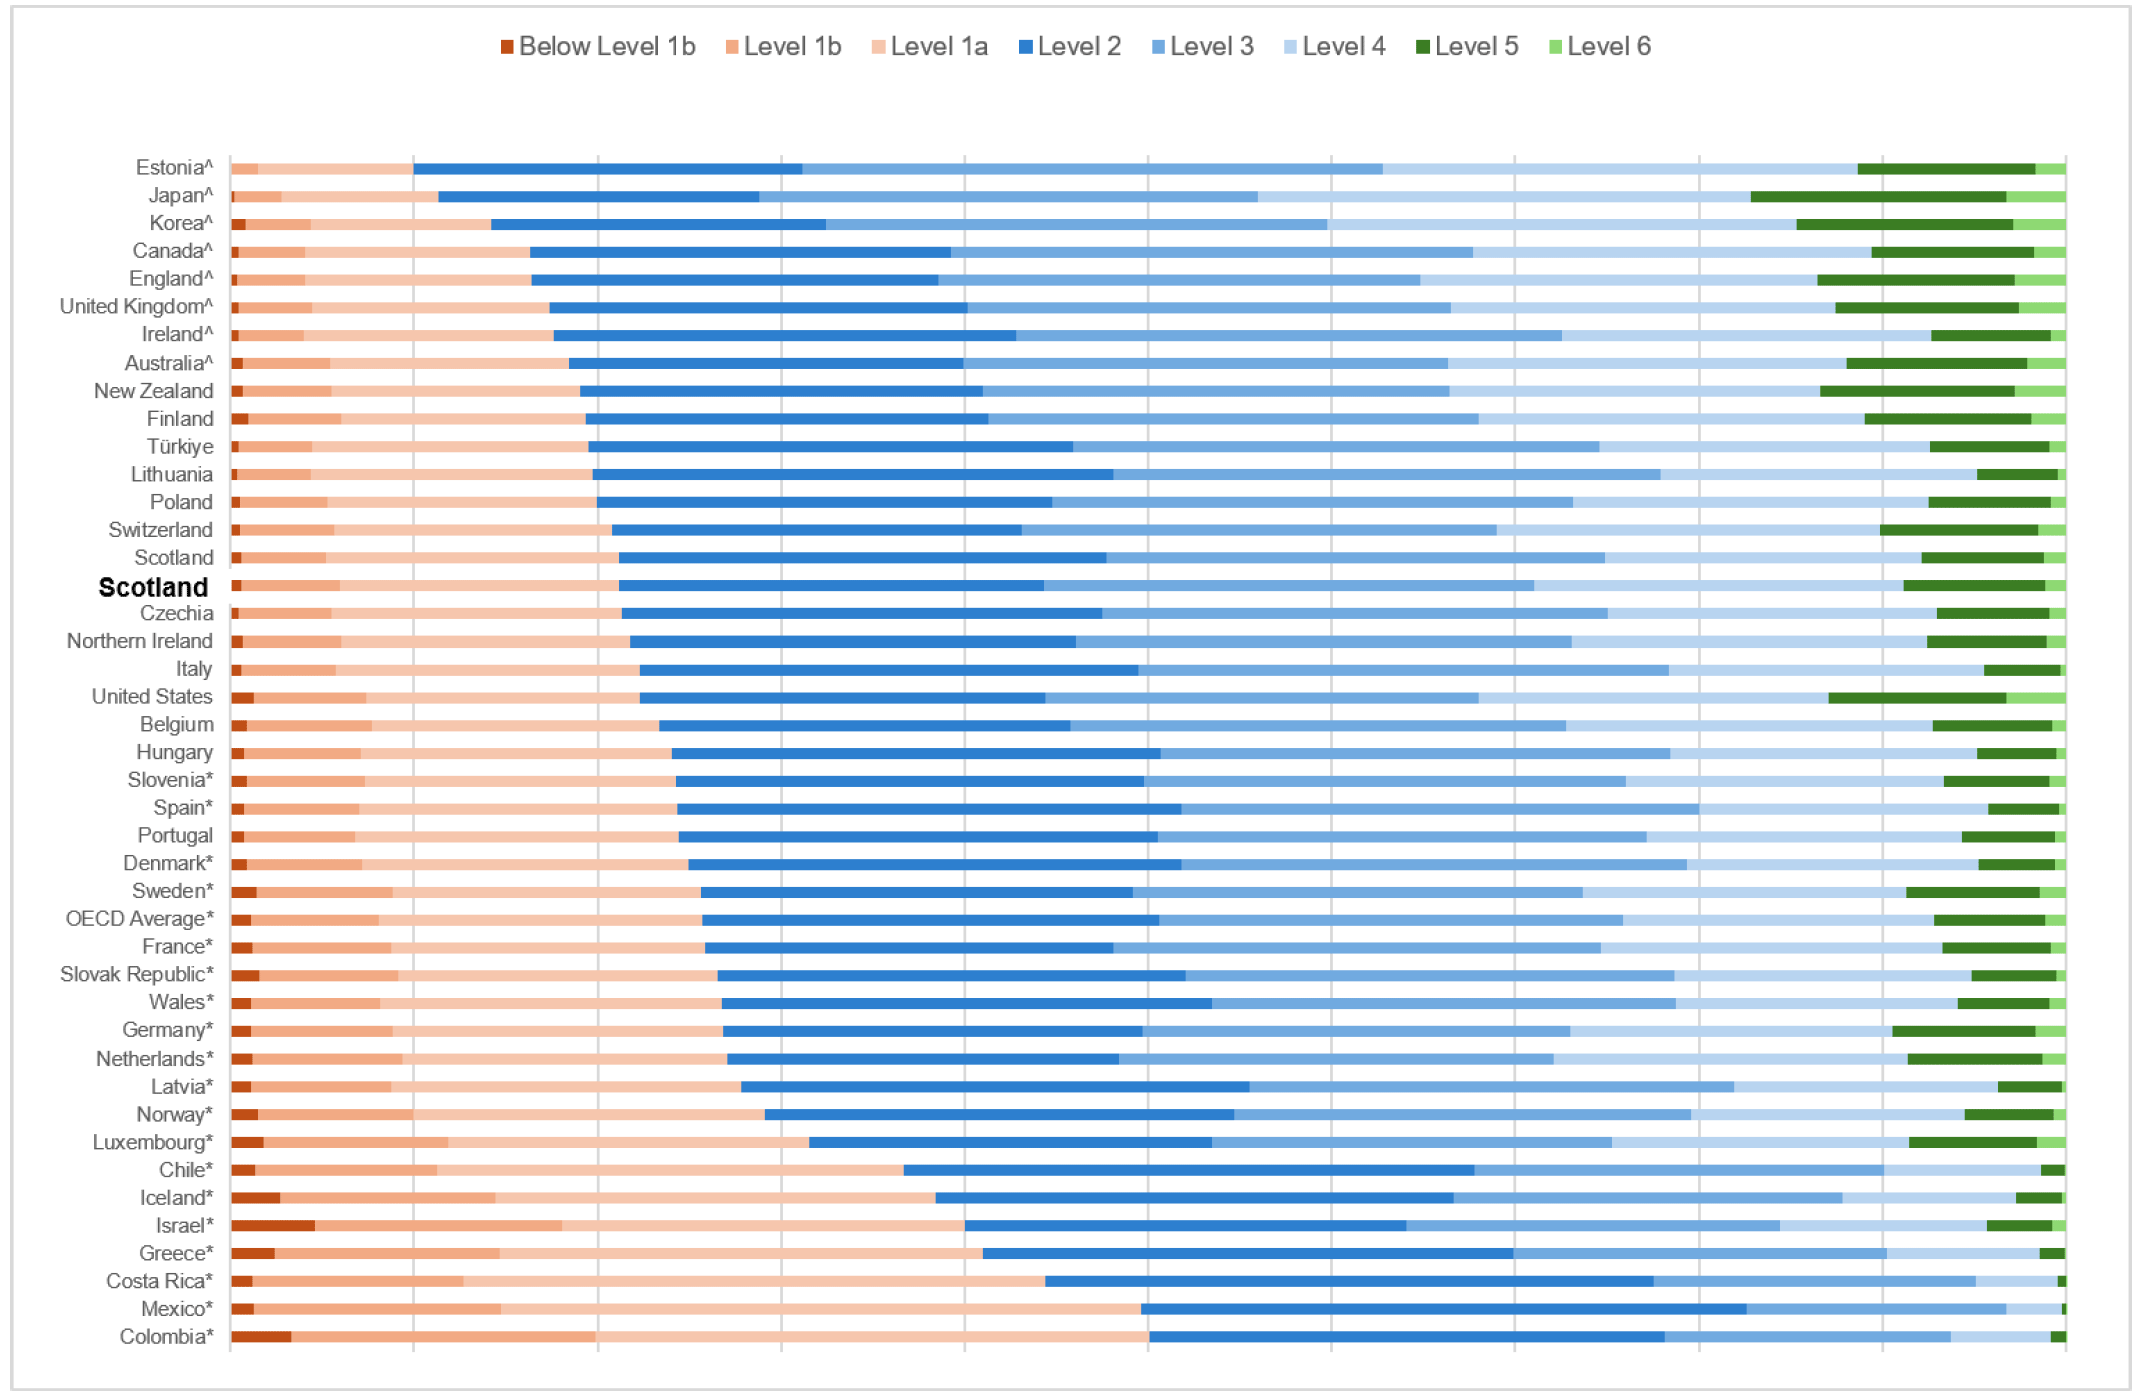
In 2025, 21.1% of pupils in Scotland performed below Level 2 in science. This was significantly lower than the OECD average (25.7%) and Wales (26.8%). The proportion was not significantly different from Northern Ireland (21.9%). However, the proportion was significantly higher in Scotland than in England (16.3%) and the United Kingdom overall (17.3%).
Across the other OECD countries included in the comparison, Scotland had a significantly lower proportion of pupils performing below Level 2 than 19 countries, including Denmark, France, and Sweden. Scotland was not significantly different from 13 countries, including Austria, Finland, and Switzerland. Six countries had a significantly lower proportion of pupils performing below Level 2 than Scotland, including Australia, Estonia and Ireland.
At the upper end of the proficiency scale, 7.9% of pupils in Scotland performed at Level 5 or above. This was not significantly different from the OECD average or Northern Ireland (7.5%). Scotland had a significantly higher proportion of high-performing pupils than Wales (5.8%), but a significantly lower proportion than England (13.5%) and the United Kingdom overall.
Across the other OECD countries included in the comparison, ten countries had a significantly higher proportion of pupils performing at Level 5 or above than Scotland, including Australia, Estonia, and Finland. Scotland was not significantly different from 13 countries, including Austria, Ireland and Sweden. Scotland had a significantly higher proportion of pupils performing at Level 5 or above than 17 countries, including Denmark, Greece, and Spain.
Overall, Scotland had a significantly lower proportion of pupils performing below Level 2 than the OECD average, while the proportion performing at Level 5 or above was not significantly different from the OECD average. Within the UK, Scotland did not differ significantly from Northern Ireland on either measure. Compared with Wales, Scotland had a significantly lower proportion of pupils below Level 2 and a significantly higher proportion at Level 5 or above. Compared with England and the UK overall, Scotland had a significantly higher proportion of pupils below Level 2 and a significantly lower proportion reaching Level 5 or above.
4.8 Performance across science subscales
PISA reported performance across four science subscales: three based on the core science competencies and one covering environmental science.
- Explaining phenomena scientifically – pupils’ ability to apply scientific knowledge to explain natural and technological phenomena, and to understand and evaluate scientific explanations and models.
- Construct and evaluate designs for scientific enquiry and interpret scientific data and evidence critically – pupils’ ability to evaluate scientific investigations and interpret scientific data and evidence critically.
- Research, evaluate and use scientific information for decision making and action – pupils’ ability to locate, evaluate and use scientific information when making decisions and taking action.
- Environmental science – pupils’ ability to apply scientific knowledge and reasoning to environmental issues and challenges, including topics such as climate change, biodiversity, sustainability and the use of natural resources.
Table 4.2 shows Scotland’s mean scores across the four science subscales. Scotland achieved a mean score of 493 points in Environmental science, 492 points in ‘Construct and evaluate designs for scientific enquiry and interpret scientific data and evidence critically’, 491 points in ‘Research, evaluate and use scientific information for decision making and action’, and 486 points in ‘Explain phenomena scientifically’.
The subscale scores should not be compared directly with one another. For example, a higher score in Environmental science than in ‘Explain phenomena scientifically’ does not necessarily mean that pupils in Scotland are stronger in Environmental science, because each subscale is based on a different set of questions and has its own international distribution. The sections below therefore assess Scotland’s performance in each subscale by comparing it with the relevant OECD average and other participating countries and economies.
Detailed analysis of the environmental science subscale is presented in Chapter 8.
| Competency | Mean score |
|---|---|
| Environmental science | 493 |
| Construct and evaluate designs for scientific enquiry and interpret scientific data and evidence critically | 492 |
| Research, evaluate and use scientific information for decision making and action | 491 |
| Explaining phenomena scientifically | 486 |
4.8.1 Explain phenomena scientifically
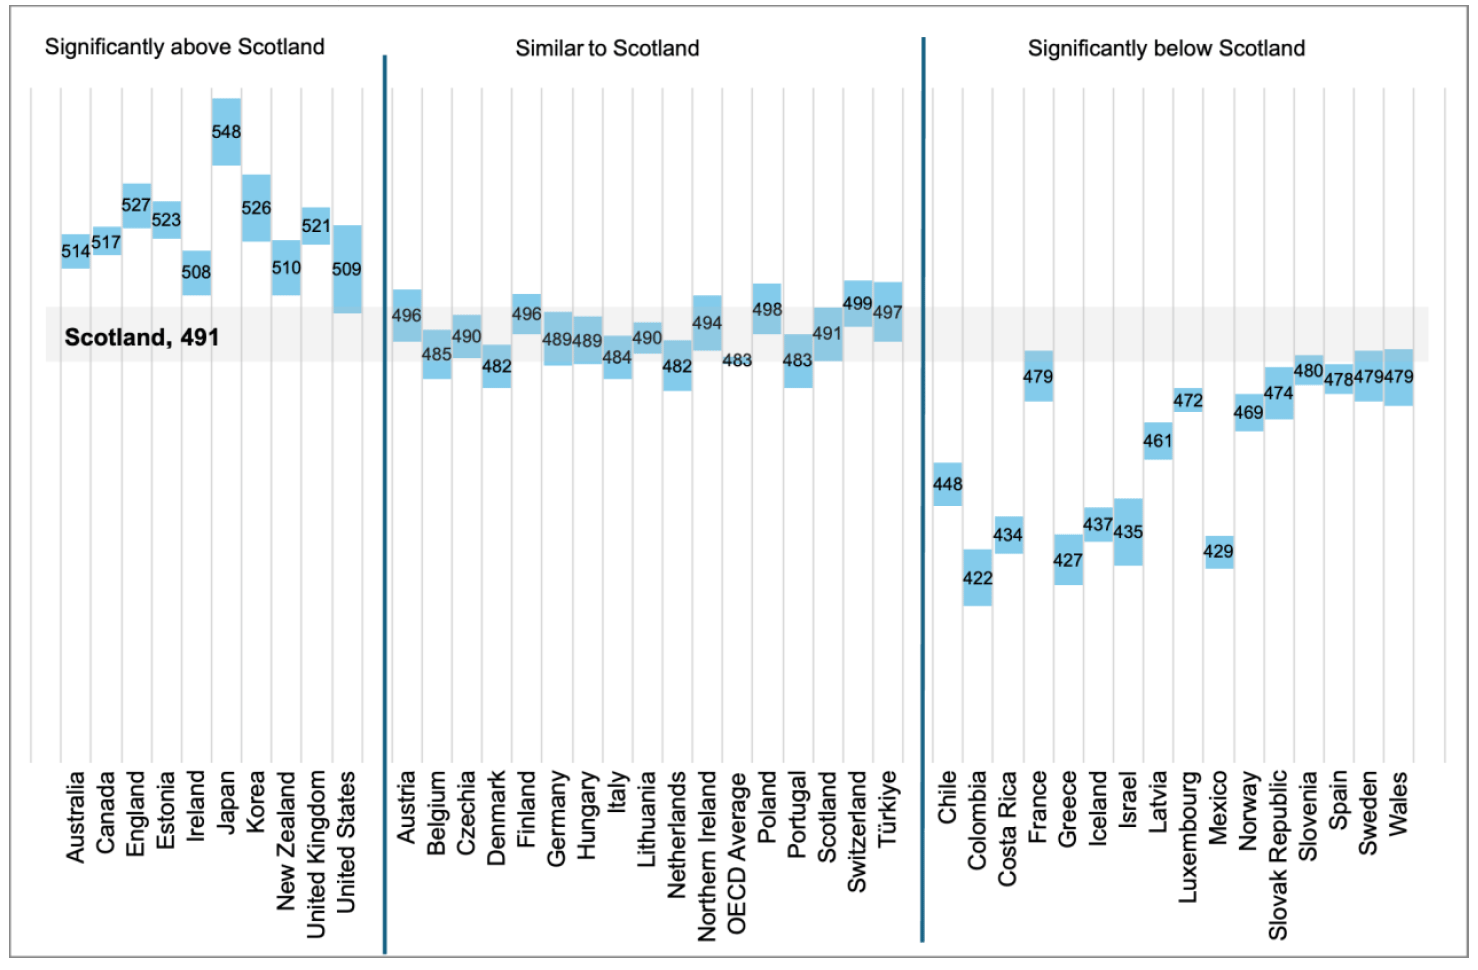
Scotland achieved a mean score of 486 points for ‘Explain phenomena scientifically’. This was statistically similar to the OECD average of 482 points. Scotland’s performance was significantly lower than 12 countries, including Japan, Korea, and England; statistically similar to 15 countries, including Austria, Northern Ireland, and Germany; and significantly higher than 13 countries, including Wales, Spain, and Iceland. Scotland’s performance was also significantly lower than the United Kingdom overall.
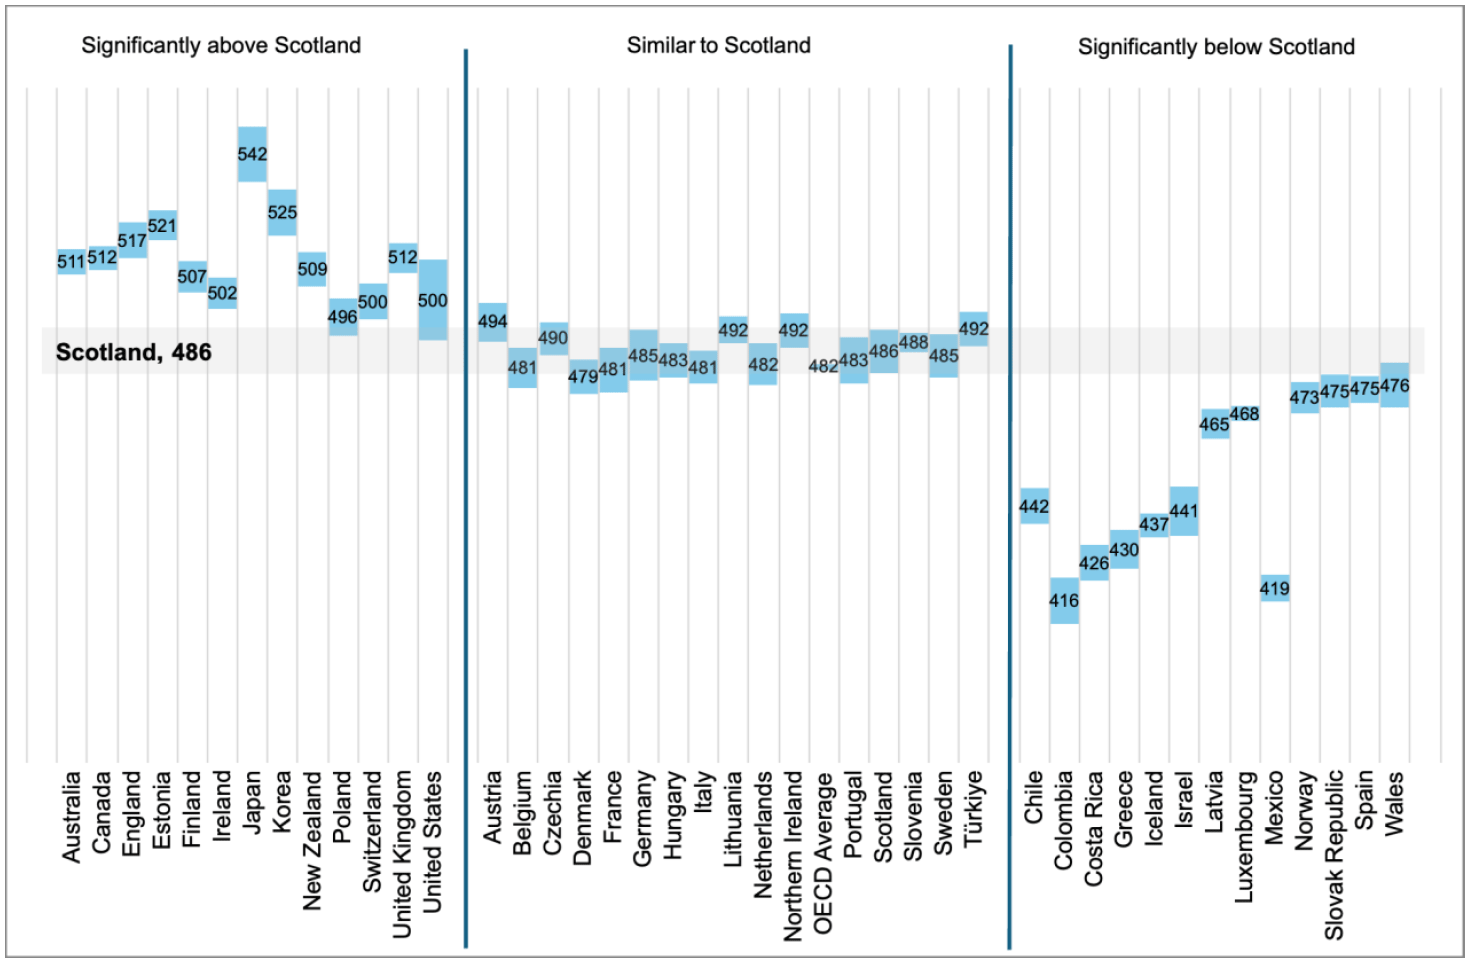
Among girls, Scotland achieved a mean score of 481 points, which was statistically similar to the OECD average for girls (480 points). Scotland’s performance among girls was significantly lower than 14 countries, including Japan, Ireland and England; statistically similar to 17 countries, including Northern Ireland, Denmark and Germany; and significantly higher than nine countries, including Greece, Israel and Latvia. Scotland’s performance was also significantly lower than the United Kingdom overall.
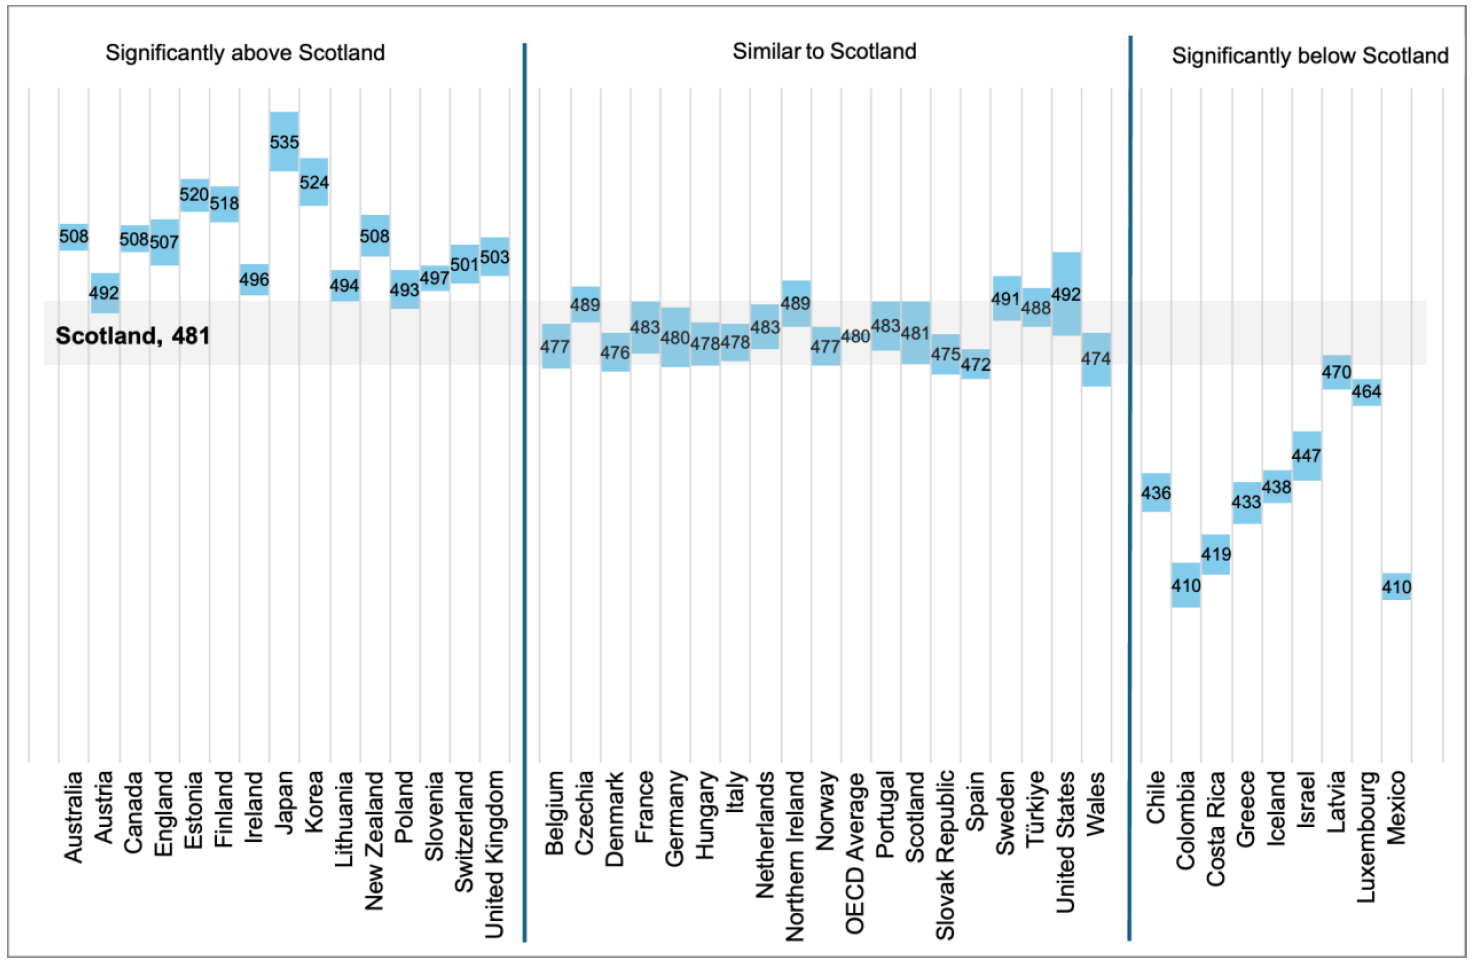
Among boys, Scotland achieved a mean score of 491 points, which was statistically similar to the OECD average for boys (483 points). Scotland’s performance among boys was significantly lower than 9 countries, including Australia, Ireland and England; statistically similar to 15 countries, including Northern Ireland, Germany and Finland, and significantly higher than 16 countries, including France, Sweden and Wales.
4.8.2 Construct and evaluate designs for scientific enquiry and interpret scientific data and evidence critically
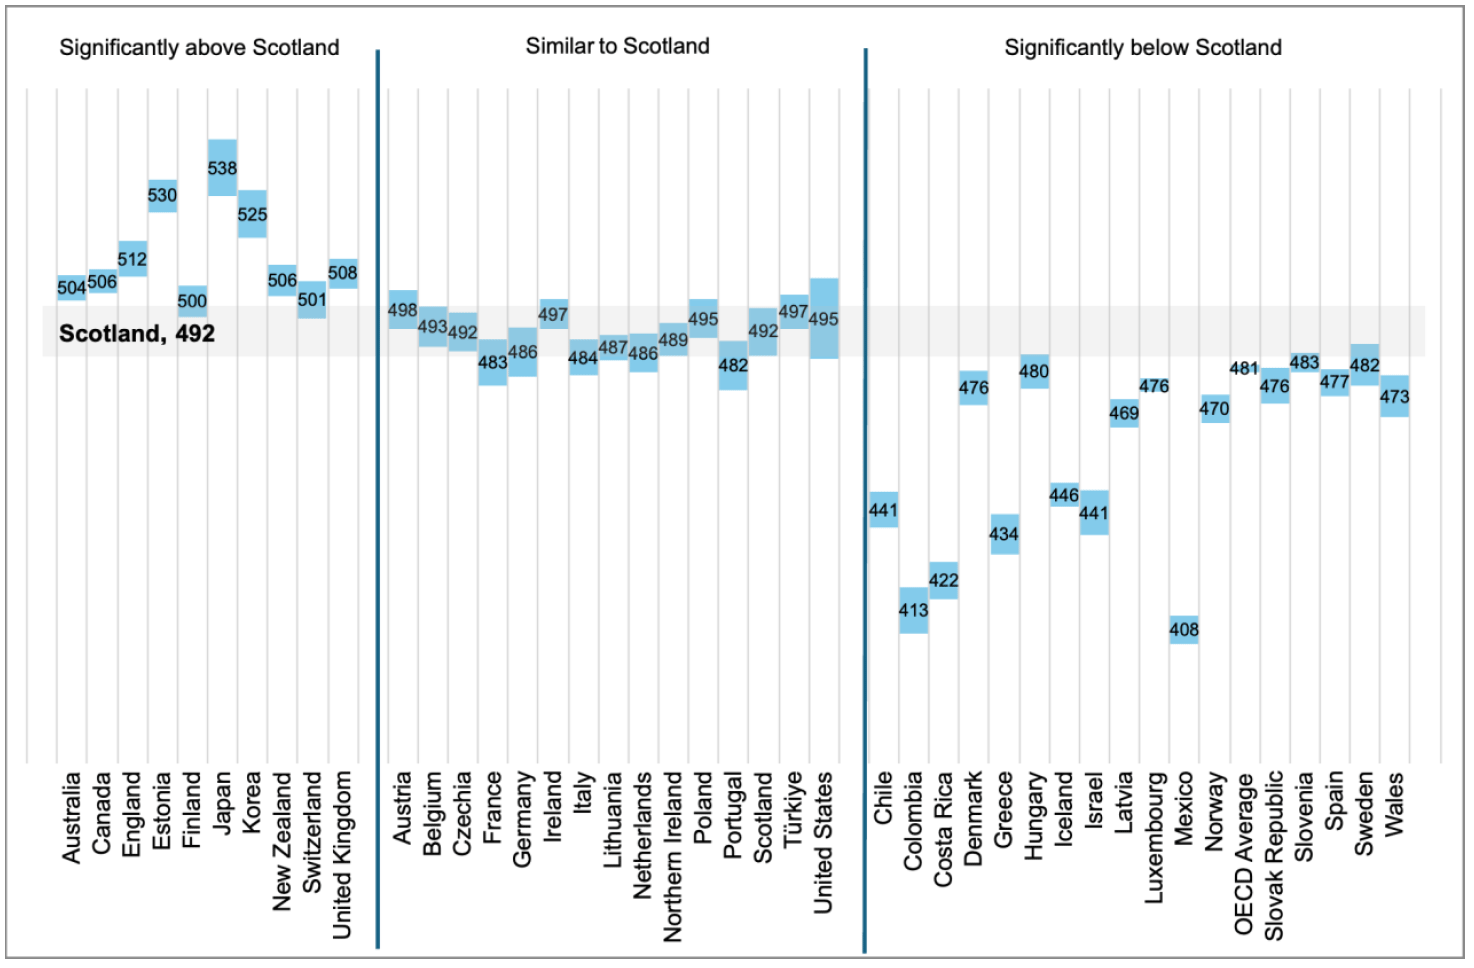
Scotland achieved a mean score of 492 points for ‘Construct and evaluate designs for scientific enquiry and interpret scientific data and evidence critically’. This was significantly higher than the OECD average of 481 points. Scotland’s performance was significantly lower than nine countries, including Japan, Estonia and England; statistically similar to 14 countries, including Austria, Germany and Northern Ireland; and significantly higher than 17 countries, including Wales, Spain and Sweden. Scotland’s performance was also significantly lower than the United Kingdom overall.
Among girls, Scotland achieved a mean score of 491 points, which was significantly higher than the OECD average for girls. Scotland’s performance among girls was significantly lower than nine countries, including Australia, Finland and England; statistically similar to 16 countries, including Northern Ireland, Ireland and Belgium; and significantly higher than 15 countries, including Wales, Denmark and Spain. Scotland’s performance was also significantly lower than the United Kingdom overall.
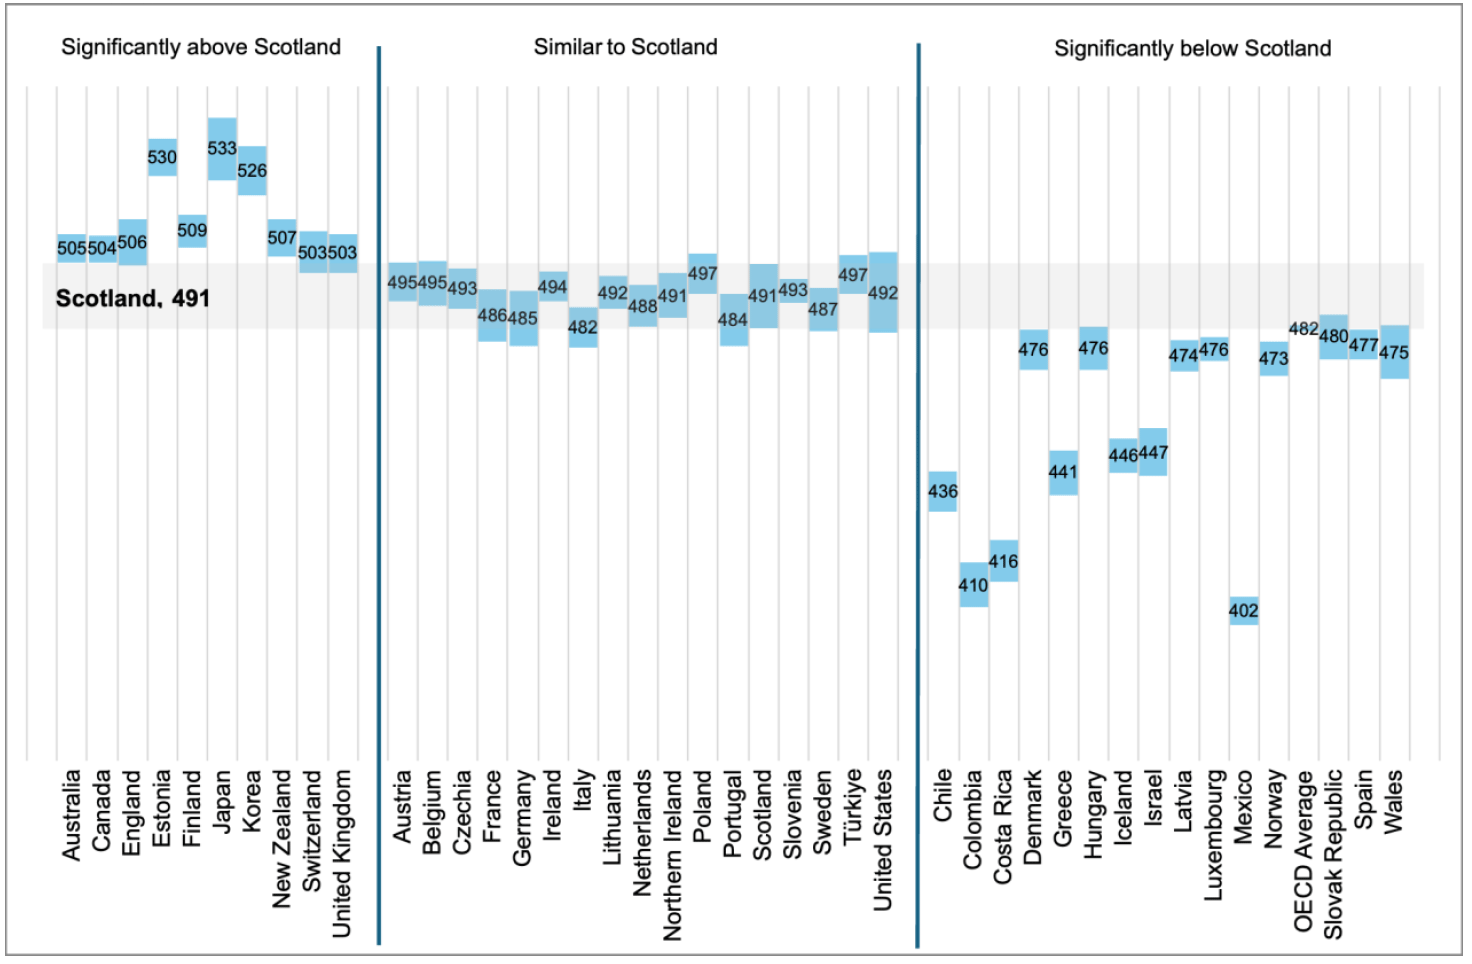
Among boys, Scotland achieved a mean score of 492 points, which was significantly higher than the OECD average for boys. Scotland’s performance among boys was significantly lower than seven countries, including England, Japan, and Australia; statistically similar to 14 countries, including Northern Ireland, Germany and Finland; and significantly higher than 19 countries, including Wales, France and Denmark. Scotland’s performance was also significantly lower than the United Kingdom overall.
4.8.3 Research, evaluate and use scientific information for decision making and action
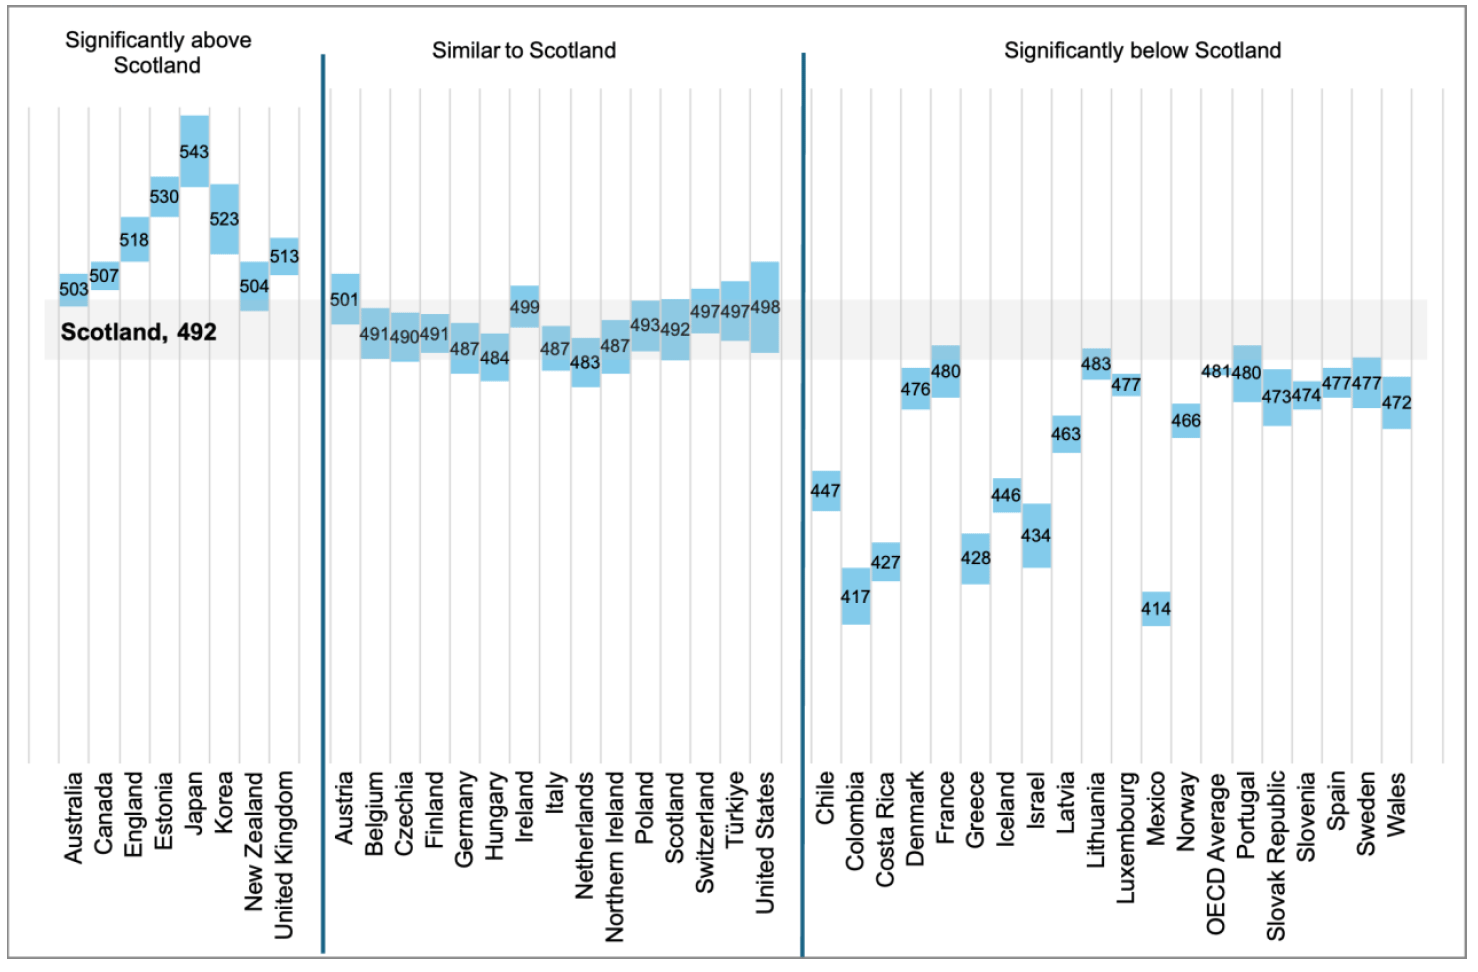
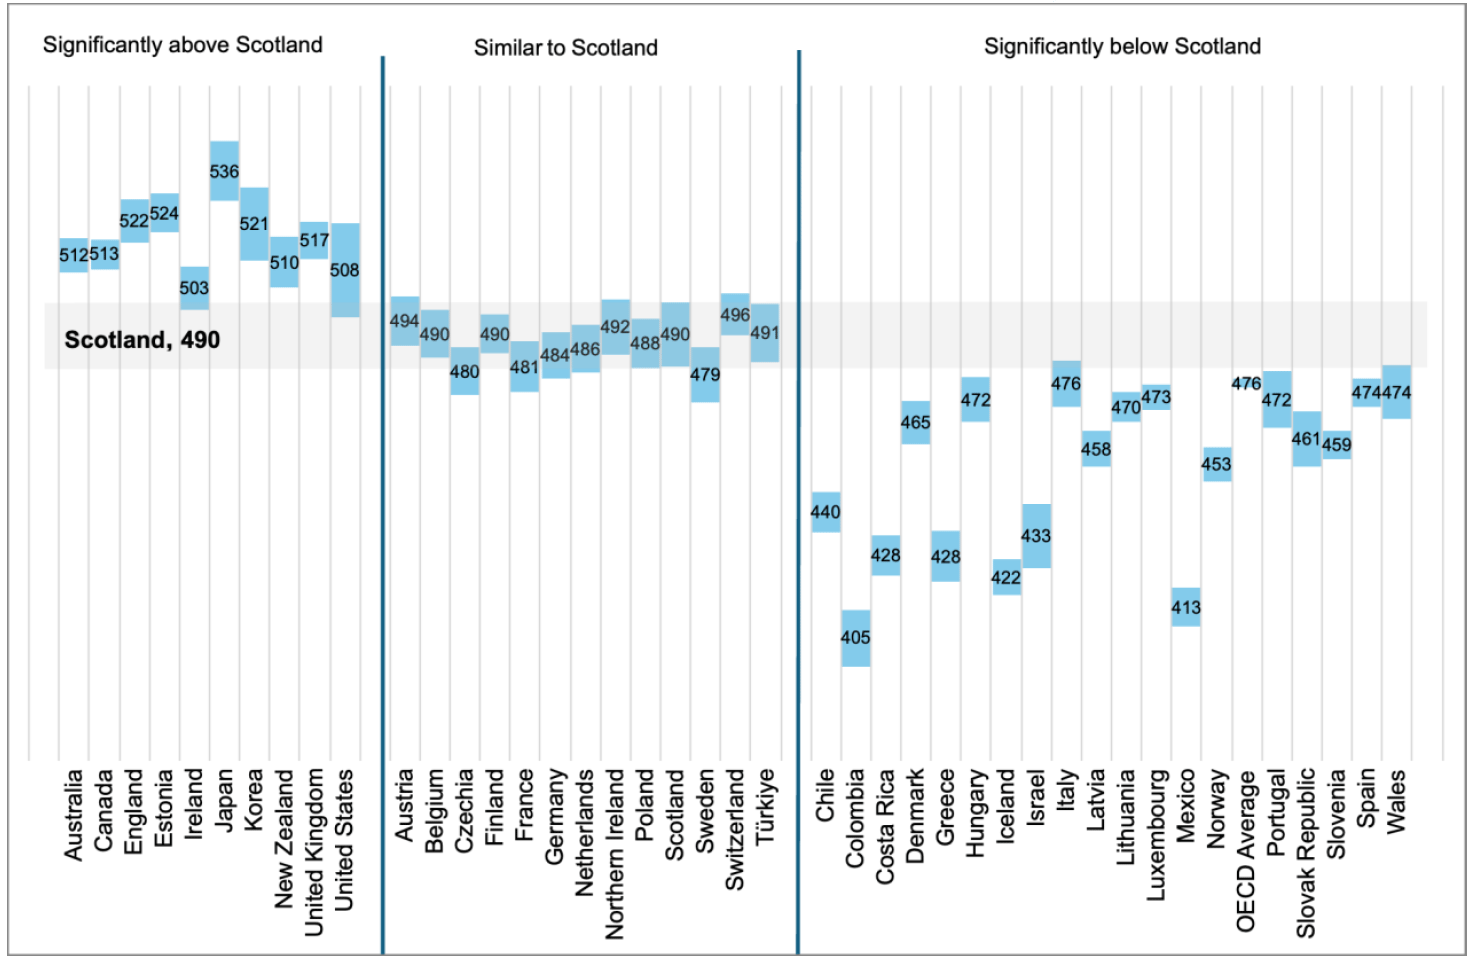
Scotland achieved a mean score of 491 points for ‘Research, evaluate and use scientific information for decision making and action’. This was significantly higher than the OECD average of 480 points. Scotland’s performance was significantly lower than 11 countries, including Japan, England and Ireland; statistically similar to 10 countries, including Austria, Germany and Northern Ireland; and significantly higher than 19 countries, including Wales, Spain and Denmark. Scotland’s performance was also significantly lower than the United Kingdom overall.
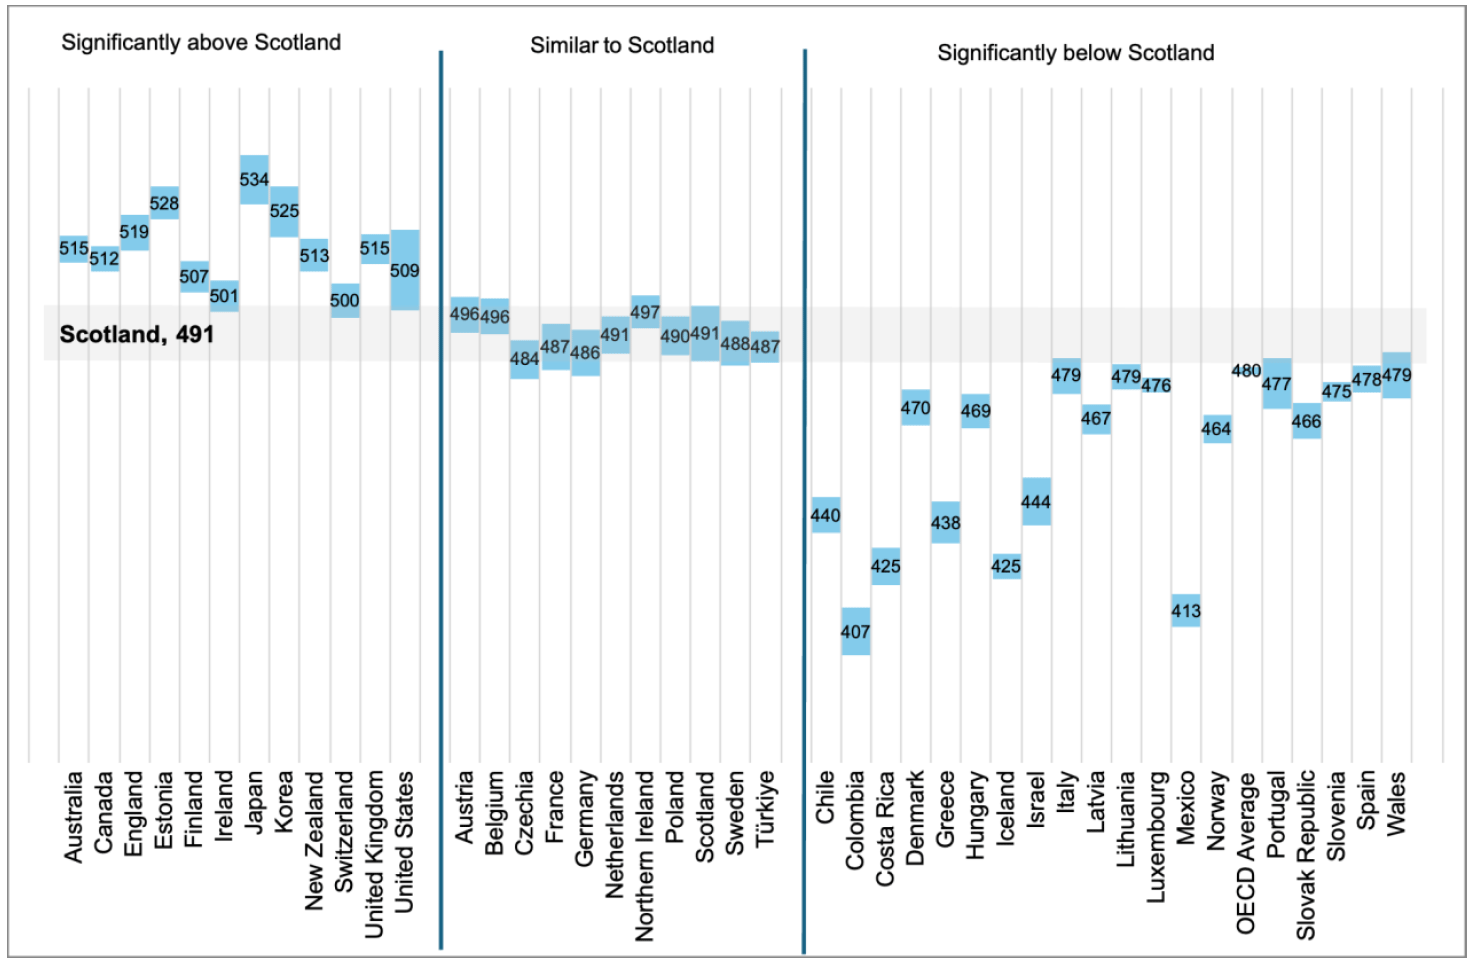
Among girls, Scotland achieved a mean score of 492 points, which was statistically similar to the OECD average for girls (485 points). Scotland’s performance among girls was significantly lower than ten countries, including Finland, England and Japan; statistically similar to 17 countries, including Northern Ireland, Wales and Germany; and significantly higher than 13 countries, including Denmark, Iceland and Israel.
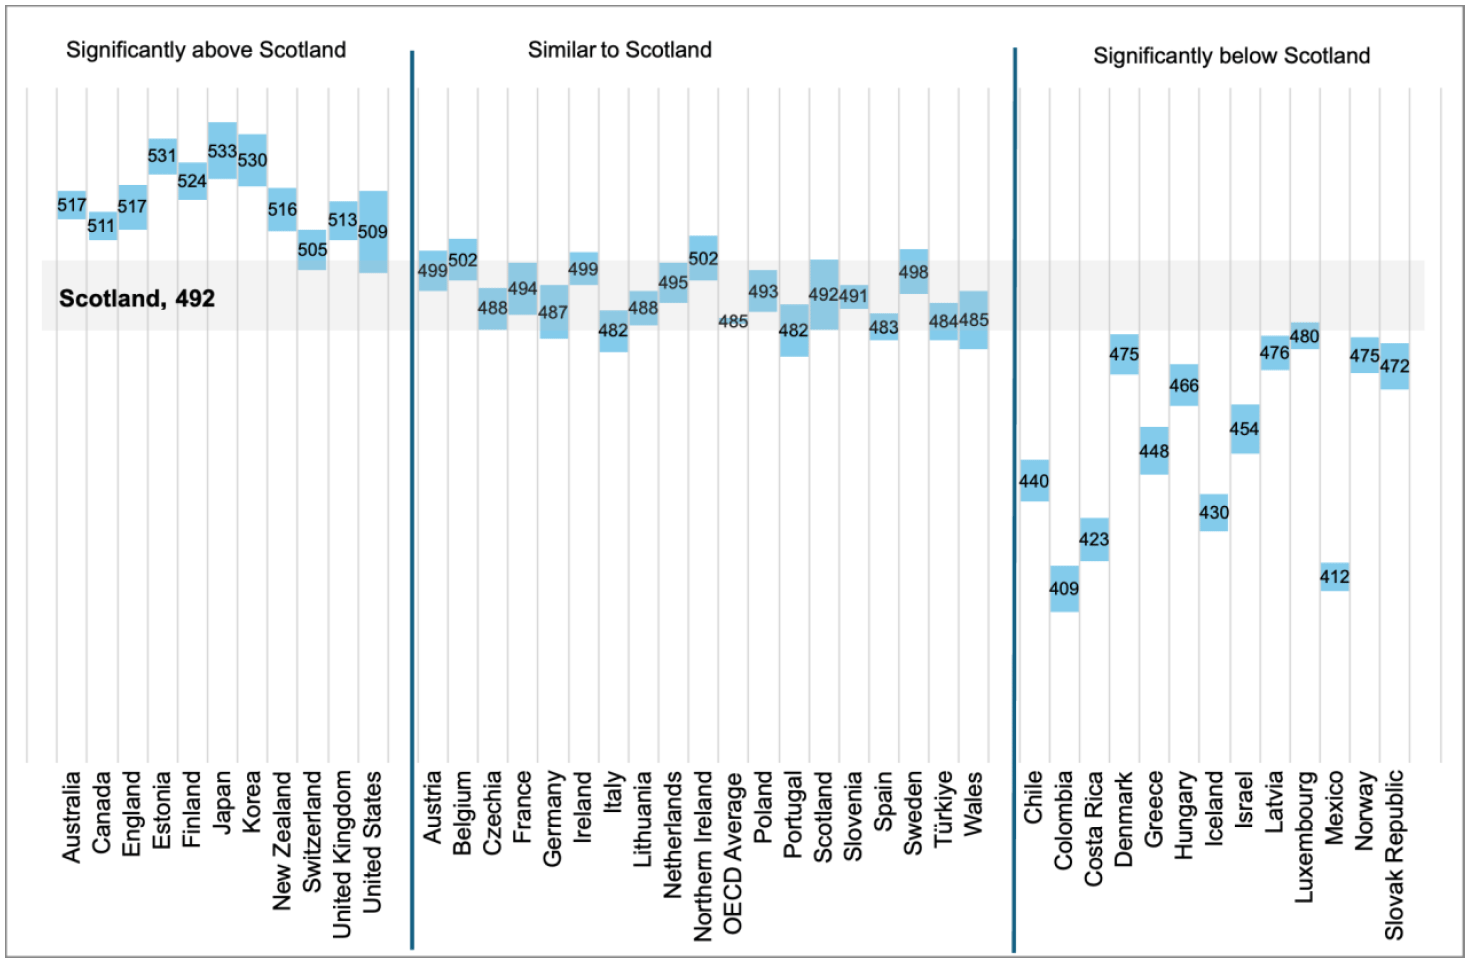
Among boys, Scotland achieved a mean score of 490 points, significantly higher than the OECD average for boys (476 points). Scotland’s performance among boys was significantly lower than nine countries, including England, Ireland and Australia; statistically similar to 12 countries, including Northern Ireland, Germany and Finland; and significantly higher than 19 countries, including Wales, Spain and Denmark.
4.9 Science performance by socio-economic background
PISA examines the relationship between pupils’ socio-economic background and science performance using the PISA index of economic, social and cultural status (ESCS). This is based on information about pupils’ home and family circumstances, including parents’ education and occupations and resources available in the home.
In 2025, socio-economic background explained 7.3% of the variation in science performance between pupils in Scotland. This means that differences in pupils’ socio-economic backgrounds accounted for a relatively small proportion of the overall differences in science scores between pupils. This was significantly lower than in 2006 (15.7%), 2009 (16.4%), 2012 (11.3%) and 2022 (12.2%). It was not significantly different from 2015 (10.7%) or 2018 (10.1%). This means that socio-economic background was less strongly related to differences in pupils’ science performance in 2025 than in several previous PISA cycles.
PISA also measures the socio-economic gradient, which shows how much science performance tends to differ as pupils move up the ESCS scale. A steeper gradient indicates a stronger relationship between socio-economic advantage and performance, while a shallower gradient indicates a weaker relationship. In practical terms, this shows how much of a difference in science performance is associated with being more socio-economically advantaged.
In 2025, a one-point increase on the ESCS scale was associated with an average increase of 28 points in science performance. This means that pupils who were one point higher on the ESCS scale scored, on average, 28 points higher in science. The gradient was significantly smaller in 2025 than in 2006 (50 points), 2009 (47 points), 2012 (36 points), 2015 (37 points) and 2022 (39 points). It was not significantly different from 2018 (36 points).
Overall, pupils from more advantaged socio-economic backgrounds tended to perform better in science in 2025. However, both measures indicate that the relationship between socio-economic background and science performance was significantly weaker than in a number of previous PISA cycles, including 2022. This does not mean that socio-economic differences in performance have disappeared; rather, they were less strongly associated with science performance than in those earlier cycles.
4.9.1 International comparisons of science performance by socio-economic background
In 2025, socio-economic background explained 7.3% of the variation in science performance in Scotland. This was significantly lower than in 18 countries, including Austria, Belgium and France; and not significantly different from 21 countries, including England, Northern Ireland, Wales and Ireland. No country had a significantly lower proportion of variation explained by socio-economic background than Scotland. Scotland was also not significantly different from the United Kingdom as a whole and was significantly lower than the OECD average.
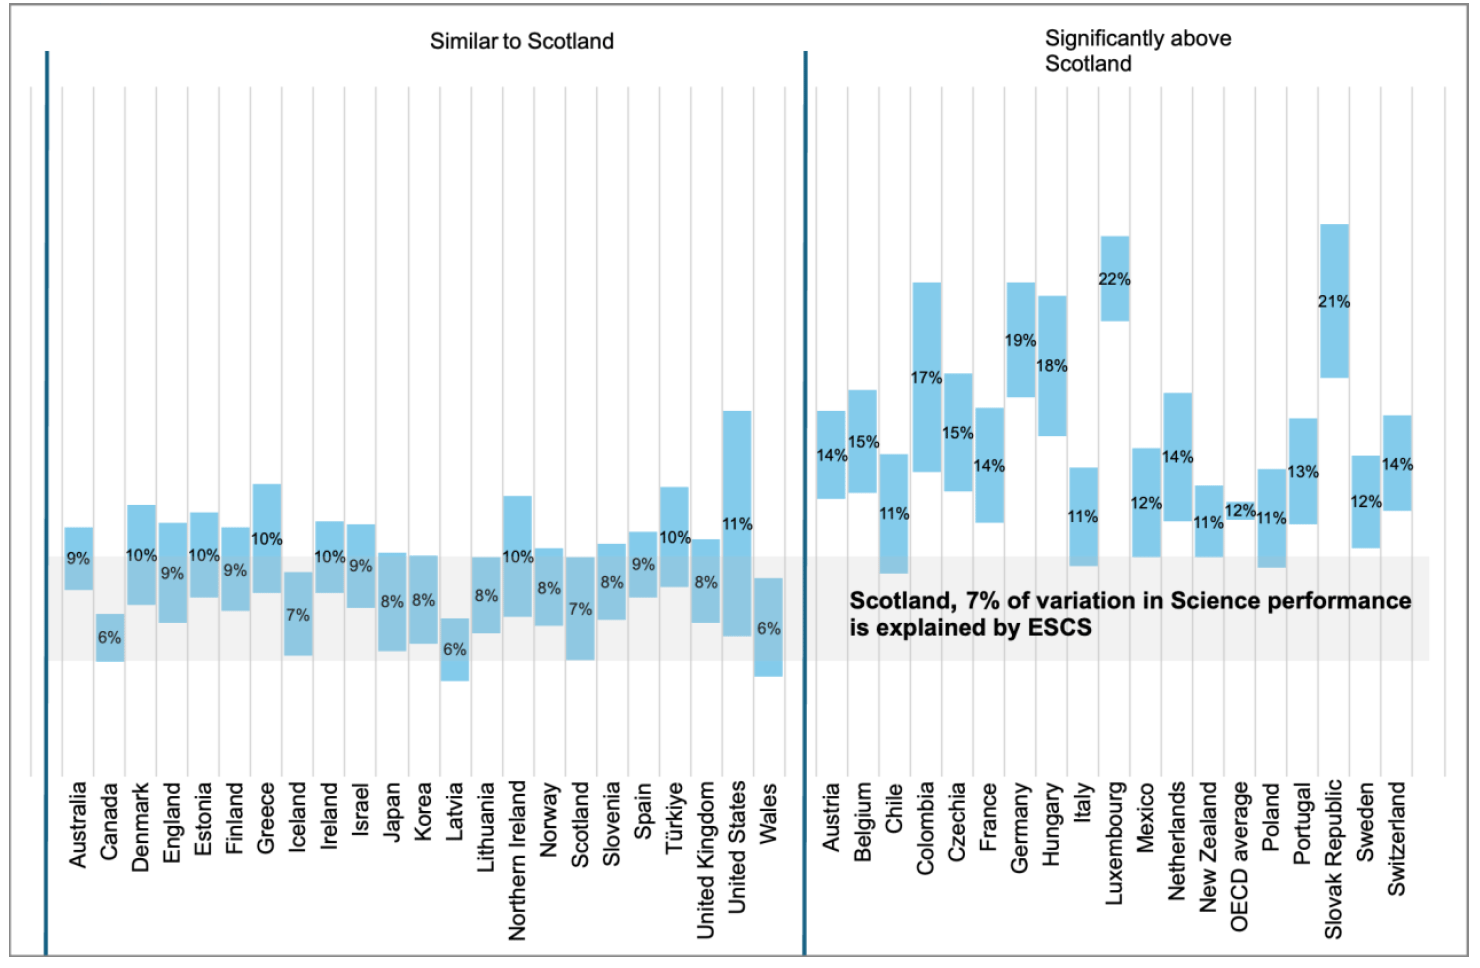
Scotland’s socio-economic gradient in science was 28 points. The gradient was significantly smaller than in 20 countries, including Belgium, Denmark and France; not significantly different from 18 countries, including England, Ireland, Northern Ireland and Wales; and significantly larger than in one country, Mexico. Scotland’s gradient was also not significantly different from the United Kingdom as a whole and was significantly smaller than the OECD average.
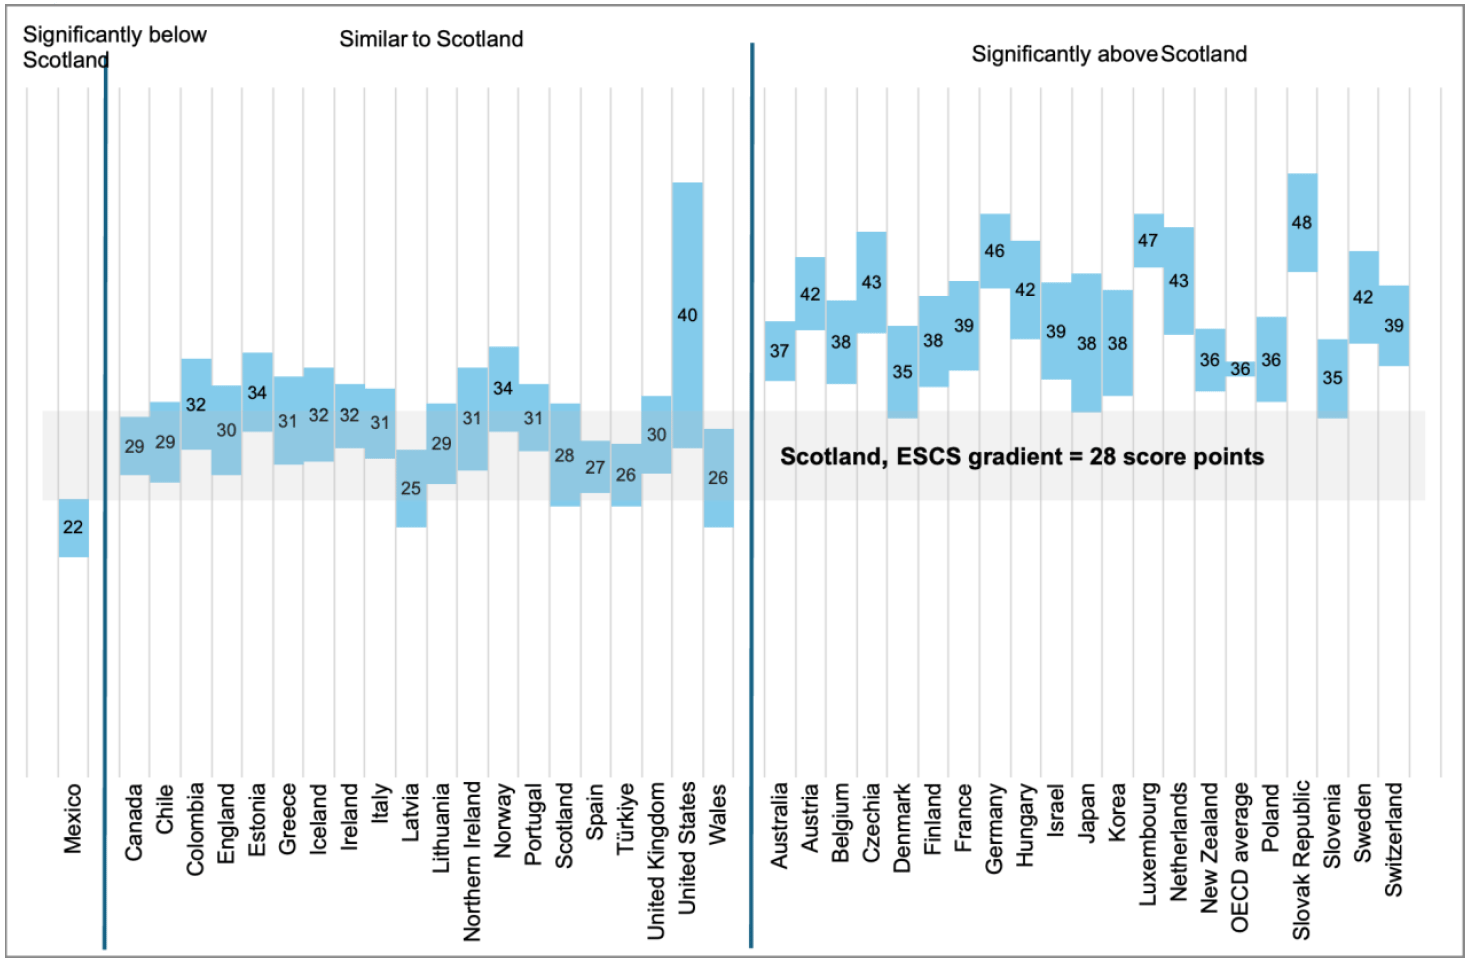
Overall, both measures indicate that the relationship between socio-economic background and science performance in Scotland was weaker than in many of the countries shown and weaker than the OECD average. However, Scotland was not significantly different from any of the other UK nations on either measure.
4.10 Science performance by immigration background
PISA also examines science performance by pupils’ immigration background. Pupils are classified as non-immigrant, second-generation immigrant (born in the UK but whose parents born elsewhere), and first-generation immigrant (born outside the country and whose parents were also born outside the country).
In PISA 2025, non-immigrant pupils in Scotland achieved a mean science score of 492 points. Second-generation immigrant pupils achieved a mean score of 521 points, which was significantly higher than the score for non-immigrant pupils. First-generation immigrant pupils achieved a mean score of 497 points, which was not significantly different from either non-immigrant or second-generation immigrant pupils.
The pattern over time differed between groups. Among non-immigrant pupils, science performance in 2025 was significantly lower than in 2006, 2009 and 2012, but was not significantly different from performance in 2015, 2018 or 2022.
Among second-generation immigrant pupils, science performance in 2025 was not significantly different from any previous PISA cycle between 2006 and 2022. Among first-generation immigrant pupils, there were also no statistically significant differences between performance in 2025 and any previous cycle.
Contact
Email: socialresearch@gov.scot