Scottish Budget - piloting an approach to identifying preventative spend: pilot results
Results from a pilot of the preventative budgeting tool, which ran between December 2025 and May 2026 and focused on testing a method for identifying planned preventative spending across parts of the Scottish Budget 2025/26.
Chapter 3 - Results
This chapter sets out the results from the preventative budgeting pilots. This includes the aggregate estimates for planned preventative spend across the 2025/26 Budget lines piloted, including estimates for the different levels of prevention (if preventative). The link to outcomes is also made, with an analysis of how this planned preventative spend targets key drivers of demand for public services.
Note these results should be taken as preliminary and should be treated with some caution. Results could change between the pilot phase and the final budgeted preventative spend estimates planned for Summer 2026. This is because further moderation will be undertaken to ensure consistency of approach across the range of budget lines covered.
Where results are compared across the 2025/26 Budget portfolios, note that the coverage varies across each portfolio so no direct comparisons can be drawn across portfolios at this stage.
Planned preventative spend
Around 15% of the 2025/26 planned spending in the budget lines piloted was defined as preventative (around £3.0bn), while 4% was tagged as “enabling” (£0.8bn), 52% was “acute/ responsive/ treatment” (£10.5bn) and 29% “Other/ general service” (£5.7bn) (Figure 9).
| Spend category | 2025/26 planned spend (£m) | % of total |
|---|---|---|
| Preventative | 3,036 | 15% |
| Enabling | 817 | 4% |
| Acute/ responsive/ treatment | 10,470 | 52% |
| Other/ general service | 5,709 | 29% |
| Total spend in pilot | 20,032 | 100% |
- Preventative – Planned preventative spend was recorded across all Budget portfolios piloted. The overall figure for planned preventative spend is driven by some large areas of spend, including NHS Boards preventative spend (in particular, prevention through primary care, population health measures, etc), and parts of dental care (e.g. check-ups, ChildSmile), community eyecare (e.g. check-ups), mental health, Pupil Equity Funding, and Discretionary Housing Payments. Beyond these large areas of spend, there were a number of smaller budget lines.
- Enabling – In addition to planned preventative spend, enabling spend was recorded across most Budget portfolios. Some examples of planned preventative spend recorded in the enabling category included NHS Boards enabling spend (e.g. training for delivering preventative activity), parts of SEPA spending (on data, evidence and innovation), training for nurses and midwives (for preventative activity), Whole Family Wellbeing activity focussed on whole system approaches, and social enterprise activity.
- The acute/responsive/ treatment category is largely driven by NHS Boards (e.g. surgical and critical care, primary responsive care, etc) and general medical services responsive activity (Scottish Government funding for GPs). These two budget lines are estimated to be account for around 93% of planned acute/responsive/ treatment spending in the pilots. Other large budget lines included general dental services (treatment) and the Legal Aid Fund (excluding some funds for supporting those at risk before entering the court system). Note, while these areas are tagged as acute/ responsive/ treatment, there will be preventative elements to many of these services, e.g. GPs identifying patients for referral to a community link worker.
- Planned spend in the other/ general service category spend includes large areas of spend, such as NHS Boards (e.g. corporate services), general dental services general spend (e.g. capitation, rent reimbursement, continuing care), bursary payments for nursing and midwifery students (excluding training for preventative activity), general medical services (e.g. training for responsive activities). Note, while these areas are tagged as other/ general service, there will be preventative elements to many of these activities. For example, this category also includes activity such as innovation, enterprise and innovation support, which can be indirectly preventative by creating high quality jobs and increasing economic growth/ incomes.
More details on how specific budget lines were tagged across portfolios, see Annexes A-H.
Looking across portfolios, preventative spend was identified across all portfolios. However, given the pilots covered a select sub-set of lines within each portfolio, the coverage differs, and therefore data is not comparable (Figure 10).
| Portfolio | 2025/26 Budget total planned spend (£m) | 2025/26 planned spend in pilot (£) | Of which… Preventative | Of which… Enabling | Of which… Acute/ responsive/ treatment | Of which… Other/ general service |
|---|---|---|---|---|---|---|
| Health and Social Care (SG spend) | 4,202 | 2,586 | 507 | 46 | 1,351 | 682 |
| Health and Social Care (Health Boards) | 16,001 | 16,001 | 1,776 | 670 | 8,863 | 4,692 |
| Education and Skills | 3,201 | 607 | 371 | 19 | 23 | 194 |
| Justice and Home Affairs | 3,494 | 270 | 41 | 10 | 202 | 17 |
| Social Justice | 7,472 | 163 | 139 | 9 | 6 | 9 |
| Deputy First Minister, Economy and Gaelic | 613 | 166 | 90 | 9 | 0 | 66 |
| Rural Affairs, Land Reform and Islands | 916 | 96 | 30 | 16 | 8 | 42 |
| Net Zero and Energy | 137 | 143 | 81 | 37 | 17 | 8 |
| Other | 12,297 | NA | NA | NA | NA | NA |
| Totals | 48,333 | 20,032 | 3,035 | 817 | 10,470 | 5,709 |
Level of prevention
Of the budgeted spending covered by the pilots, around £0.5bn was tagged as primary prevention, accounting for 18% of total budgeted preventative spend and 2.7% of overall budgeted spend (Figure 2). The majority was classified as secondary prevention, with £1.3bn tagged under this category (around 42% of the total budgeted preventative spend and 6.4% of overall spend). This was followed closely by tertiary prevention, with around £1.2bn recorded (around 40% of total budgeted preventative spend and 6.1% of total budgeted spend overall).
| Level of prevention | 2025/26 planned spend (£m) | % of total |
|---|---|---|
| Primary | 532 | 18% |
| Secondary | 1,280 | 42% |
| Tertiary | 1,223 | 40% |
| Total preventative spend in pilot | 3,035 | 100% |
There was a mix of activities across the different levels of prevention across the Budget.
- Primary prevention – there was planned primary prevention spend in all portfolios piloted, though the concentration of this spend is in Health and Social Care. Large primary budget lines included NHS Board primary prevention activities (e.g. vaccinations, etc) and immunisations. Primary prevention in other portfolios included the baby box (Social Justice), elements of the Whole Family Wellbeing Funding and the Promise (Education and Skills), and fair work and labour market strategy (DFMEG).
- Secondary prevention – There was planned secondary spend in most portfolios, though most of the spend is in Health and Social Care and Education and Skills. This includes elements of NHS Boards secondary care (E.g. screening services), as well as Pupil Equity Funding, Discretionary Housing Payments, employability support and general dental care.
- Tertiary prevention – There is tertiary prevention in most portfolios, however this type of spend is concentrated in health and justice portfolios. This includes large areas of spend such as NHS Board tertiary spend (such as rehabilitation services), general dental services, support for victims and witnesses, whole family wellbeing support (e.g. support for those who have experienced harm/ crisis).
More details on how specific budget lines were tagged across portfolios, see Annexes A-H.
There was a mix of activity at different levels across portfolios. Of the lines piloted for each portfolio, we found that some portfolios were more focussed on primary/ secondary spend (Education and Skills, Social Justice, Rural Affairs, Land Reform and Islands, Net Zero and Energy) and others on secondary/tertiary spend profiles (e.g. Health and Social Care, Justice). This reflects what we would expect given tertiary prevention is likely to be higher in areas closer to responsive services (such as the hospitals, criminal justice system). Note, given the pilots covered a select sub-set of lines within each portfolio, the coverage differs, and therefore data is not comparable. Figure 12 sets out the preventative spend across portfolios, as well as an indication of the budget spend not covered.
| Portfolio | Planned Preventative spend tagged | Of which… Primary | Of which… Secondary | Of which… Tertiary |
|---|---|---|---|---|
| Health and Social Care (SG spend) | 507 | 111 | 233 | 163 |
| Health and Social Care (Health Boards) | 1,776 | 273 | 543 | 959 |
| Education and Skills | 371 | 33 | 305 | 34 |
| Justice and Home Affairs | 41 | 1 | 6 | 33 |
| Social Justice | 139 | 11 | 102 | 26 |
| Deputy First Minister, Economy and Gaelic | 90 | 1 | 81 | 8 |
| Rural Affairs, Land Reform and Islands | 30 | 30 | - | - |
| Net Zero and Energy | 81 | 71 | 10 | - |
| Other | NA | NA | NA | NA |
| Totals | 3,035 | 532 | 1,280 | 1,223 |
Drivers of demand targeted by preventative activity
As discussed in the methodology, we also trialled an outcomes tagging approach in the pilot programme. This allowed users to tag spend against a range of high level outcomes. These outcomes are then mapped onto other frameworks of interest for prevention, in particular how spend is allocated across different drivers of public service demand (a key focus in the Public Service Reform Strategy).
This section provides illustrative results outlining the planned preventative spend from the budget lines covered by the pilots tagged against key drivers of public service demand. This exercise was done for Scottish Government programme spend only (as this was out of scope for the NHS Boards pilot exercise).
For each budget line tagged as budgeted preventative spend, these were also tagged against a single “main” driver of public service demand impacted by the spend, as well as any secondary drivers impacted by the activity. For example, spending on Walking Scotland may be tagged as having a positive impact on “adult ill-health”, but also impact other drivers such as unemployment, social disconnect, etc. The Tool allows for both positive and negative impacts on the drivers to be tagged, though no negative impacts were identified in the exercise.
Figure 13 shows the results of this outcomes tagging exercise. The drivers targeted by budget lines reflected the remits of the portfolios included in the pilot, for example with a high level of direct spend targeted at adult ill-health, child ill-health, school disruption, and homelessness and housing related ill-health. These figures are driven by some large investments. For example, planned preventative spend on “adult ill-health” is driven by large spend lines such as general medical services, mental health, dentistry and optometry. Elsewhere, for school disruption, it is largely driven by Pupil Equity Funding, and for homelessness and housing issues, it is Discretionary Housing Payments.
The results also show that a large amount of planned preventative spend impacted a demand drivers indirectly. Drivers such as inequality/ poverty, training, community cohesion and discrimination were largely recorded a secondary impact of budget lines. Again some of these indirect benefits will be driven by larger lines. For example, for inequality, a significant proportion of this will have been tagged as an indirect outcome of Pupil Equity Funding, Discretionary Housing Benefits and Legal Aid. Likewise, many health prevention activities have an indirect impact on people’s ability to work.
The lower spend in some other portfolios can reflect the pilot covered – e.g. climate change and pollution may be because we don’t include capital spending, or some large lines within these portfolios. We also don’t apportion activities across different outcomes. E.g. general medical services is tagged as targeting adult ill-health as a main outcome, with child ill-health a secondary driver. Applying proportions to these impacts in future may provide a more accurate assessment of the extent to which health services are targeted at younger people vs older people.
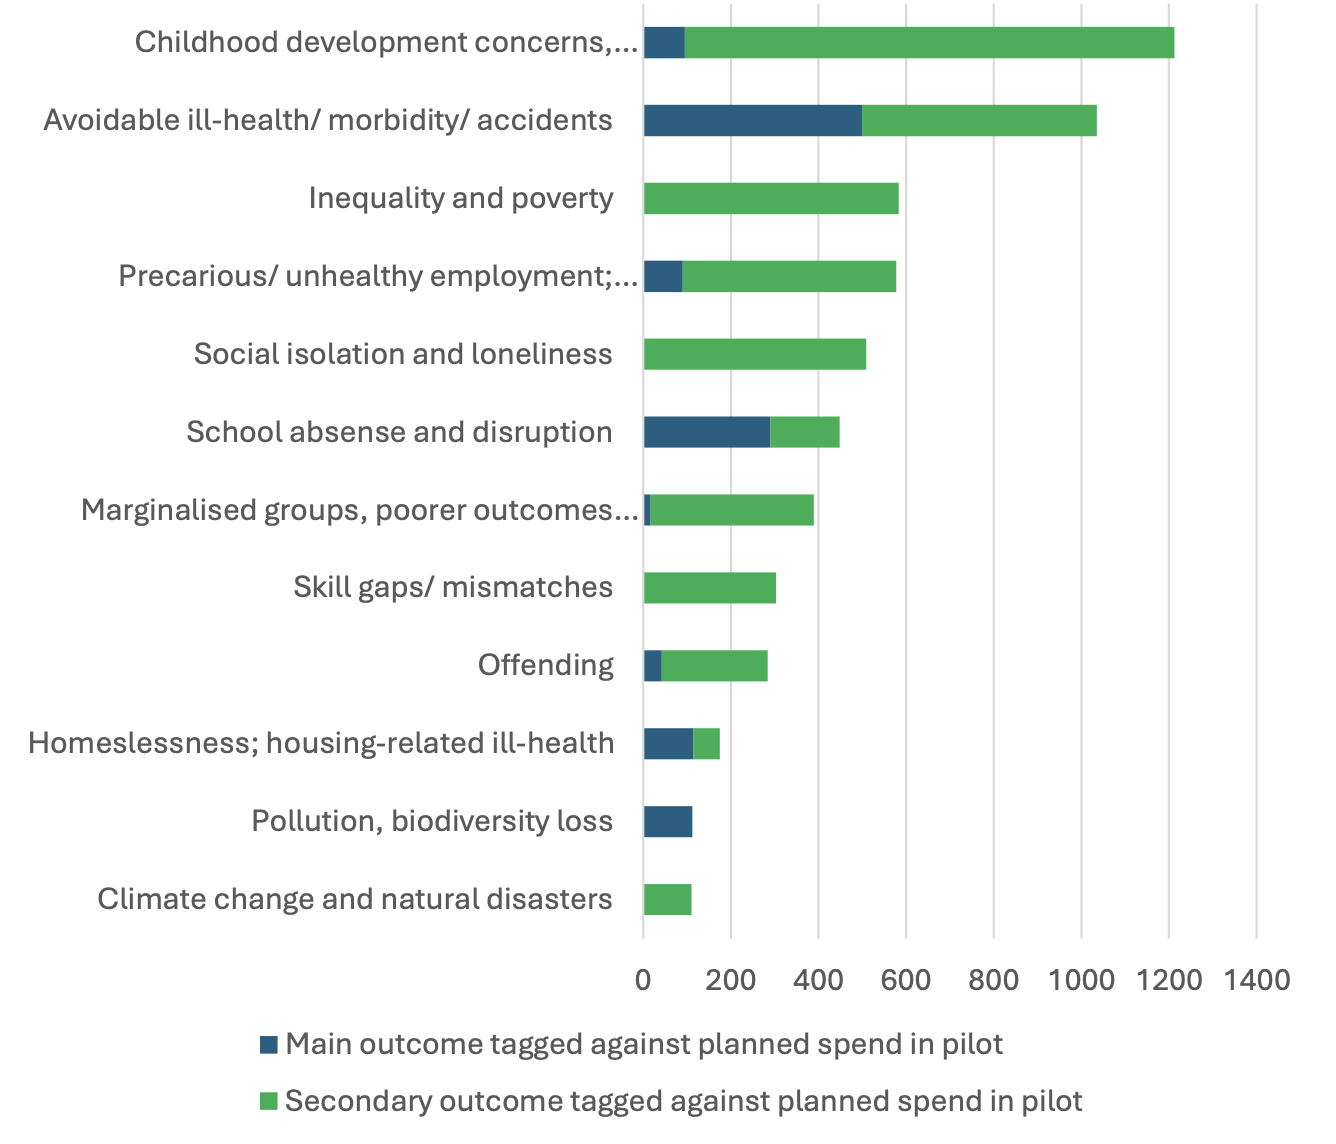
Note: each activity can have only one direct outcome impacted. Hence the sum of direct prevention activity on the chart sums to the total preventative spend figure. However, users can select a number of indirect outcomes impacts by the activity – therefore, the total for secondary outcomes do not sum to total preventative spend.
Discussion
The results of the preventative budgeting pilot programme highlight a number of key findings. In particular:
- There is significant planned preventative spend in the Scottish Budget 2025/26, with spend recorded across all Portfolios piloted - The results showed that around £3.0bn of planned spending across the pilots could be tagged as preventative (around 15% of total planned spending piloted), with a further £0.8bn tagged as enabling prevention (4% of total planned spending piloted). Within the 15% includes a range of activities, invested in across different portfolios, and targeting a range of different drivers of demand. The results also showed the system-wide relevance of prevention, with budgeted preventative spend being recorded across all portfolios of the Scottish Budget covered in the pilot.
- Planned preventative spend accounts for a smaller proportion of total spend relative to acute/responsive/ treatment and general service categories – While planned preventative spend accounted for 15% of total budgeted spend, acute/responsive/ treatment and other/ general service categories made up the remaining 81% of the planned spend piloted.
- A range of budget lines were tagged as primary prevention, though the majority of planned preventative spend is concentrated in secondary and tertiary prevention – the results show that primary prevention was around £0.5bn, approximately 18% of total planned preventative spend, and 2.7% of planned preventative spend overall. Secondary and tertiary prevention accounted for 42% and 40% of total planned preventative spend (6.4% and 6.1 of total planned spend). While there are no “target proportions” for where these indicators should land, the results suggest that planned preventative spending is concentrated on at-risk groups as problems are forming (secondary) or after they have occurred (tertiary).
- Broader analysis of prevention must include both preventative and other activity – while the focus of this report is on direct, primary-purpose preventative activity, it is important to consider all spend in any consideration of prevention across the full system of Scottish public services. Other types of activity, such as acute/ responsive/ treatment activity, have a role to play in prevention, even if not directly. For example, the way responsive GP services are provided will have a significant impact on prevention. Hence, just because spend isn’t in the “preventative” category doesn’t mean they are totally “not preventative”.
- The final results could differ from the pilot study – the pilot study covers around 15% of the Budget, and leaves some significant areas of spend out, such as local government, Police and the Fire and Rescue Service. Accounting for these spend areas could shift the overall aggregate picture significantly. Therefore, these results shouldn’t be treated as indicative of the final results for the overall budget.
Contact
Email: PreventionUnit@gov.scot