Scottish Budget - piloting an approach to identifying preventative spend: pilot results
Results from a pilot of the preventative budgeting tool, which ran between December 2025 and May 2026 and focused on testing a method for identifying planned preventative spending across parts of the Scottish Budget 2025/26.
Chapter 2 – Methodology
This chapter provides an overview of the methodology used in the preventative spend pilot exercise. This includes:
- An overview of the Preventative spend approach
- The approach to budget data collection and interrogation
- The preventative spend definitions used and how these were applied
- How outcomes have been tagged as part of the work
- The strengths and limitations of the approach.
Overview of Preventative spend Approach
The pilot study tests an approach for looking at the data held on activities within the published 2025/26 “Level 4” lines of the Scottish Budget (the most detailed published budget data available for the Scottish Budget), and “budget tagging” these lines based on a classification of prevention developed by the Scottish Government. According to the OECD, budget tagging is a tool used to assess an individual budget measure (or budget line) and give it a ‘tag’ according to whether it is helpful or not to specific objectives (prevention in this case).[11]
To do this, we developed an excel-based Preventative Budgeting Tool and Guidance, which supports users to structure spending data in a consistent format, and then to "tag" this spending according to a classification of preventative spend and outcomes.[12] This can be viewed as a four-step process (Figure 3).
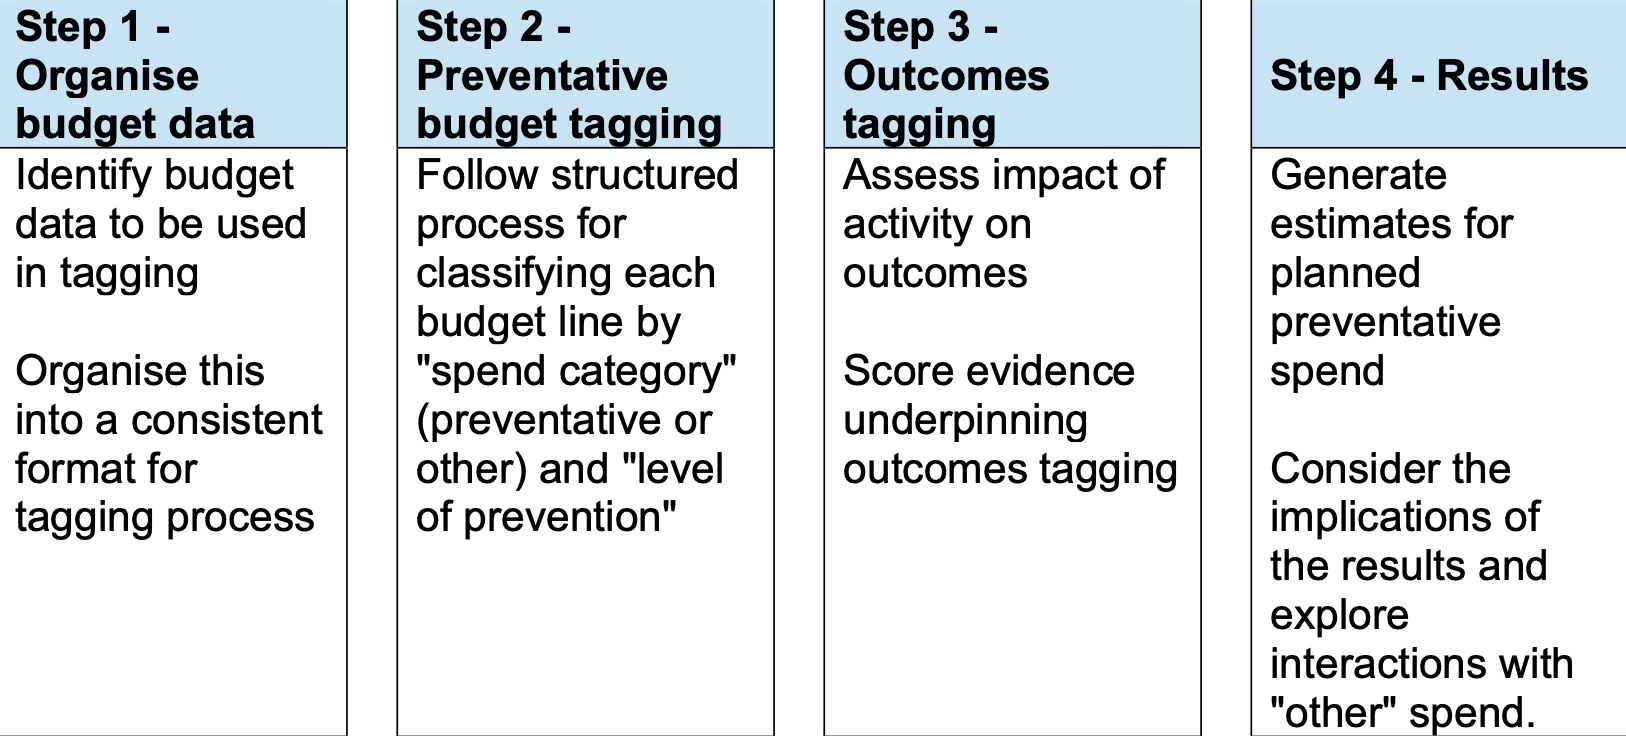
Step 1 - Organise budget data
Identify budget data to be used in tagging Organise this into a consistent format for tagging process
Step 2 - Preventative budget tagging
Follow structured process for classifying each budget line by "spend category" (preventative or other) and "level of prevention"
Step 3 - Outcomes tagging
Assess impact of activity on outcomes Score evidence underpinning outcomes tagging
Step 4 - Results
Generate estimates for planned preventative spend Consider the implications of the results and explore interactions with "other" spend.
This approach has been designed to provide a “top down” assessment of planned preventative spend within a budget. This type of approach involves applying a standardised set of categories to budget lines to track and monitor shifts in budget allocations over time. This allows for a tagging approach to be applied at a high level to budget lines in a proportionate way, even though much of the spend is allocated to other organisations, and not spent by Scottish Government directly. Following the “top down” approach means the tagging exercise can reach across large budgets relatively quickly. This contrasts to a “bottom up” approach, which focusses on a detailed mapping of services to classify activities and matching this to actual spend on those activities. This is more appropriate to ‘front-line’ organisations where services/activities are delivered. The original preventative investment guidance developed by CIPFA focusses on a “bottom up” approach.[13]
The guidance also acknowledges that there is some subjectivity present with the approach, and provides strategies for making consistent assessments about preventative spend. This includes providing a structured process for making decisions on spending lines, including a range of practical examples for different areas, and including a range of perspectives in the tagging process.
The Pilot Scope and Coverage
The Pilot programme was designed to cover a sub-set of 2025/26 Level 4 Budget lines, including a mix of budget lines across different Scottish Government portfolios, and different types of activity. The initial pilot lines were chosen by researchers on this basis, though more lines were added throughout the process where policy teams indicated a willingness to take part, or easily available budget data was found on lines not considered in the original scope.
The final pilot study scope covered 99 Level 4 budget lines (Figure 4), spread across 7 portfolios, covering around 21% of the total Scottish Budget lines and 41% of Scottish Budget spending. The pilots covered 7 Scottish Budget portfolios.
The majority of spend covered by the pilots was accounted for by NHS Boards, which include two Level 4 lines – NHS Territorial Boards (£14.2bn) and NHS National Boards (£1.85bn). For this, we developed a parallel pilot with 7 territorial and 2 national NHS Boards, which was used to develop an overall estimate for the NHS Boards Level 4 Budget line. This focused on tagging detailed cost ledger hierarchies for NHS Boards to help develop a nuanced picture of spend on prevention and other categories that informed a set of proportions that were applied to the wider NHS Board line.
| Portfolio | 25/26 Budget lines in pilot | Total lines in 25/26 Budget | % of total | 25/26 resource spend covered by pilot (£m) | 25/26 Resource spend – full Budget (£m) | % of total |
|---|---|---|---|---|---|---|
| Health and Social Care (SG spend) | 18 | 81 | 22% | 2,586 | 4,202 | 62% |
| Health and Social Care (Health Board spend) | 2 | 2 | 100% | 16,001 | 16,001 | 100% |
| Education and Skills | 22 | 82 | 27% | 607 | 3,201 | 19% |
| Justice and Home Affairs | 15 | 48 | 31% | 270 | 3,494 | 8% |
| Social Justice | 8 | 42 | 33% | 163 | 7,472 | 2% |
| Deputy First Minister, Economy and Gaelic | 7 | 66 | 11% | 166 | 613 | 27% |
| Rural Affairs, Land Reform and Islands | 15 | 86 | 17% | 96 | 916 | 10% |
| Net Zero and Energy | 12 | 39 | 31% | 143 | 132 | 104%* |
| Other | NA | 3 | NA | NA | 225 | NA |
| Total | 99 | 582 | 21% | 20,032 | 48,333 | 41% |
*Note figure is greater than 100% because of the total portfolio figure is based on net spend (i.e. includes expenditure minus income generated from particular budget lines).
The pilot studies focussed on planned resource spending, meaning other elements of spend, such as capital and other transactions, were not covered in the scope of this report. This omission was intended to limit the scope of the exercise in the first instance. The pilots also focus on opening budgets, excluding any reporting on any adjustments or transfers made during the year (which are reported after the Budget is released through “Spring Budget revisions” and “Autumn Budget revisions”). This allowed the pilot to focus on data that closely resembles what would be available in an upcoming budget.
In the next steps (Chapter 5), we outline plans to include capital spend in the wider analysis of the Budget 25/26 for planned Summer 2026 and the upcoming Budget cycle, and estimates including post-budget adjustments in future Budget cycles (2027).
Budget Data and Breakdown
The Level 4 Budget lines included in the pilot varied significantly in terms of value, spanning individual budgets of varying shapes and sizes. The largest “Level 4” line (NHS Territorial Boards) was £14,151m while the smallest budget line was Tobacco Control £2.9m.
Given the variance in the size, shape and detail provided for each Level 4 budget line, a process was developed for determining whether a line could be sufficiently tagged at the Level 4, or whether further breakdown and analysis was required to develop a more nuanced tagging of the line. This was important particularly for larger budget lines that include many activities and have a material impact on overall results. The process reflects a set of structured criteria for deciding on the approach to each budget line, which included:
- Criteria 1: Level 4 line detail – if a Level 4 line was deemed detailed enough then the tag would be applied at this level. This includes Level 4 lines such as Vaccinations or Electronic Monitoring – i.e. lines that could be assessed broadly because they reflect the full activity.
- Criteria 2: Availability of more detailed budget information - if a Level 4 line was deemed to cover a range of different programmes, then the team investigated whether there was proportionate, systematically coded, budget data that could provide a more detailed dataset to tag from. This was then used for the tagging exercise. Examples of Level 4 lines that could be broken down includes General Medical Services, Mental Health, Whole Family Wellbeing Fund, the Promise and Support for Victims and Witnesses.
- Criteria 3) If further apportionment was required – if the Level 4 line (or more detailed line identified) was a large and complex line with no disaggregated budget data available, then apportionment was used to help develop a nuanced tagging of this line.[14] For example, we used data from Public Health Scotland to apportion general dental services and community eyecare budget line.
Following this approach meant that the pilot exercise could remain proportionate for Level 4 lines where sufficient information was available (or where lines had relatively low impact on overall results), while allowing more detailed interrogation of complex lines or large lines which could skew results.
In addition to this general approach above, we developed some bespoke methodologies for particular lines. For example, for Whole Family Wellbeing Funding, analysis was done of the Children’s Services Planning Partnership returns for those where this information is available (and then used to develop an overarching aggregate for the fund as a whole).
For territorial and national NHS Boards, we developed a separate pilot involving 7 territorial NHS Boards and 2 national NHS Boards (National Services Scotland and Scottish Ambulance Service). The pilot exercise went into the detailed cost centre hierarchies for these Boards, often running to thousands of disaggregated budget lines and tagged or apportioned budget lines as set out above. To ensure consistency across NHS Boards we developed a shared “rule book”, which set broad rules for the tagging of particular activities, such as primary care, acute care, dental services, community eyecare and corporate services, which ensured the NHS Boards covered were in a similar range to one another. However, some flexibility was allowed for local approaches to the tagging. This analysis was used to generate an overarching estimate of the proportion of Health Board spend that falls within a category of preventative spend vs other types of spend. Further work is required in future to further improve the robustness of estimates across the NHS Boards covered.
Classifying Preventative spend
The Preventative Budgeting Tool includes a clear classification framework for identifying preventative spend. This is based on a similar methodology developed by the Chartered Institute for Public Finance and Accounting (CIPFA) and adapted to the Scottish Government context.[15] This classification includes two elements:
- Spend category – whether the budgeted spend is preventative vs something else (e.g. acute/ responsive/ treatment).
- Level of prevention – if preventative, the budgeted spend is further categorised relative to a “level” of prevention, corresponding to the placement of the activity in relation to a problem. This is based on the “Primary, Secondary and Tertiary” prevention framework.
Spend category
The spend category describes whether an activity is defined as preventative, or whether it is defined as something else (e.g. acute/ responsive/ treatment) (Figure 5).
Figure 5 – Classification of spend categories
Spend category: Description
- Preventative: Spend designed to increase the resilience of individuals, communities and environments, and reduce the likelihood or severity of future demand for reactive activity.
- Enabling: Spend that is not in itself preventative but is required to support or facilitate the delivery of a preventative activity.
- Acute/ responsive / treatment: Spend that responds to a problem but does little or nothing to reduce the likelihood or severity of future demand for reactive activity.
- Other/ general service: Spend designed to support basic operations but does little or nothing to reduce the likelihood or severity of future demand for reactive activity.
Level of prevention
If an activity is tagged as preventative, then the next stage of the classification is to tag the “level of prevention”. This focusses on how an activity lands in the formation of a problem – i.e. before or after a problem has occurred (Figure 6).
| Level of prevention | Description |
|---|---|
| Primary prevention | Population-level action, or action which targets a large subset of the population, to build resilience and stop known risks from developing into problems |
| Secondary prevention | Targeted action to identify and respond to early signs of a problem to prevent escalation |
| Tertiary prevention | Intervening once there is a problem to stop it from getting worse or recurring in future |
To support the consistent classification of preventative spend, budget lines should be tagged on two criteria – the target population of a policy and the main purpose.
- Population group targeted - The target population described is the specific group of people supported by the activity. This could be a particular group defined by their age (e.g. 0-18 year olds) socio-economic status (e.g. children in poverty, adults in long term inactivity), health or care needs (adults with complex care needs) or working/living context (frontline staff, residents in temporary accommodation).
- Main purpose of the spend - typically prevention aims to stop a problem from happening, escalating, or getting worse as its main purpose. For example a vaccine aims to stop disease. Whereas, the main purpose of hospital care is typically to respond to a health problem. According to CIPFA guidance, a primary purpose statement typically follows a pattern - spend X supports [target population] by [specific activity] to [intended purpose].[16]
The target population and primary purpose should support assessment of what type of activity the spend is and, if preventative, what "level of prevention" the spend is. The Preventative Budgeting Tool includes examples of activity under each element of the classification.[17]
How the Pilot Budget Lines Were Classified
The budget tagging approach outlined above was used across all pilots to classify where activities fall in the classification.
Figure 7 provides examples of activities across portfolios and how these were classified based on this approach. This table is not exhaustive, and more detail on the specific pilots is covered in the Portfolio Annexes at the end of this report.
Classification: Examples
Primary Prevention
- Health and Social Care - Vaccinations, Active healthy lives grants for walking, participation in sport, Childsmile
- Education and Skills - National improving writing programme, Bookbug, parenting programmes, Scottish School Milk Scheme
- Other portfolios - Fair Work Projects, Noise and Air quality, Flood risk management, national park conservation activities
Secondary Prevention
- Health and Social Care - Childhood obesity reduction, Screening services, Mental health work for people at risk of homelessness, regular dental check-ups.
- Education and Skills - Whole Family Wellbeing Fund support for at risk families, Pupil Equity Funding, School Clothing Grant
- Justice and Home Affairs - fireworks control zones, Legal Aid Funding for those at risk of entering the court system.
- Other portfolios - Discretionary Housing Payments, Fair Start Scotland, No-one left behind
Tertiary Prevention
- Health and Social Care - Rehabilitation services, veterans clinical mental health services.
- Education and Skills - Bairn’s Hoose, electronic monitoring, support for victims and witnesses, Rape Crisis Scotland, WFWF.
- Other portfolios - Homelessness rapid rehousing support, domestic abuse helpline, Specialist employability support, Peatlands, nature restoration
Enabling
- Health and Social Care - Tobacco and Nicotine Vapour Products (NVP) register, advocacy organisations
- Education and Skills - WFWF Collaborative Partnerships, Centre for Youth and Criminal Justice
- Justice and Home Affairs – Community Justice Scotland, Risk Management Authority, HM Inspectorate of Prisons
- Other Portfolios – building standards, Equally Safe Governance, No one Left Behind support costs, Social Enterprise, Zero Waste Scotland
Acute/ responsive/ treatment
- Health and Social Care - Management of health condition, District nurses, NHS 24 mental health hub, Emergency dental treatments
- Education and Skills – Secure Care Accommodation, transport for young offenders
- Other Portfolios – Parole Board, Criminal Injuries Compensation, Legal Aid Fund main grant
Other/ general service
- Health and Social Care – Allied Health Professionals (AHP) training and development, paramedics bursaries
- Justice and Home Affairs – Learning analysis, Scottish Criminal Cases Review Commission
- Other Portfolios – Scottish Fuel Poverty Advisory Panel, Trade Union funding, Innovation Enterprise and Entrepreneurship, Scottish Public Pension Agency (SPPA) compensation payments to teachers
Tagging Outcomes and Drivers of Demand
The preventative budgeting pilots focussed primarily on “the spend” – i.e. looking at information on spending and making an assessment based on the intention to prevent something from happening. To make the exercise manageable, no information on the outcomes or evidence of impact was asked for in the basic preventative budget tagging.
However, as part of the pilot, an “outcomes tagging” approach was also trialled for some areas of Scottish Government portfolio spend (Health Board pilots were not included). This allowed for a tagging of budgeted spend (both preventative and other spend) against a set of high level outcomes. Given this report focussed on planned preventative spend, we mapped these outcomes onto an associated set of “drivers of demand” to illustrate how this spend targets key sources of demand. For example, we have “health” defined as an outcome, however we focus on planned preventative spend aiming to prevent “ill-health” as a key driver of demand. All results are presented on this basis in the report. This aligns with the actions around mitigating drivers of demand in the Public Service Reform Strategy.[18] The outcomes (and associated drivers of demand) which were mapped against are set out in Figure 8.
| Outcomes | Drivers of demand (preventative spend only) |
|---|---|
| Employment and job quality | Unhealthy employment; unemployment and inactivity |
| Income inequality and poverty | Inequality and poverty |
| Secure and safe housing | Homelessness; housing-related ill-health |
| School education | School absence and disruption |
| Participation in training | Skill gaps/ mismatches |
| Healthy adults | Avoidable ill-health/ morbidity/ accidents |
| Healthy children | Childhood development concerns, avoidable child ill-health/ mortality, trauma and care experience |
| Connected societies and places | Social isolation and loneliness |
| Human rights and discrimination | Marginalised groups, poorer outcomes for minority groups |
| Justice and security | Offending |
| Climate change | Climate change and natural disasters |
| Environmental sustainability | Pollution, biodiversity loss |
The Tool allowed users to tag each activity against a “main” outcome, which is the main driver the activity aims to target, and any “secondary” outcomes, which capture impacts of the activity on other drivers. For example, an activity may look to prevent il-health, but also have a secondary impact on other drivers, such as unemployment and inactivity.
Strengths and limitations in approach
The preventative budgeting approach deployed as part of the pilot study has been designed to balance proportionality with detail. This is intended to provide a framework for budget tagging that can be systematically applied quickly, while balancing the need to produce a broader assessment over the entire Scottish Budget. There are strengths and limitations implicit in this approach.
Strengths of the pilot budget tagging approach
- The approach can be applied broadly across a full budget fairly quickly.
- In using existing budget structures (i.e. the Level 4s or cost centre hierarchies in Health Boards), the process is replicable over time and consistent with other tagging exercises and budget work.
- The definitions, and their application, are broad and systematic, allowing broad consistency between portfolios and public sector organisations
- The approach to breaking down budget lines provides additional detail where needed, particularly for higher value budget lines that include a range of activities
- The Tool can consider outcomes of spend as well as the “inputs”. This framework could also be expanded to consider metrics of impact against budget lines, and will be part of future development of the Tool.
Limitations of approach
- Using existing data structures and deploying a “top down” approach means that some activities cannot be broken down and therefore some estimates are less precise.
- The data and evidence on each area of budgeted spend varies.
- While every attempt has been made to systematise the prevention definition, prevention is inherently a subjective concept, and all subjectivity cannot be entirely removed from the process.
- The approach for tagging is based on intent of an activity (i.e. whether an activity aims to prevent something from happening), rather than evidence-based (i.e. evidence to support the activity delivering on that intent). We are looking at how to incorporate impact measures alongside the tagging of preventative spend and outcomes in future.
Implications for Pilot Results
- The results in this paper are provisional given the method for identifying preventative spend is still developing. Figures may change as the process moves towards wider roll-out across the Scottish Budget in 2026. Beyond 2026, figures could change as data collection and estimation improves.
- The ambiguities present in financial data and the subjective nature of applying a prevention definition, mean this type of analysis is non-auditable and subject to some statistical margin for error.
- The varied nature of data collection and approach for each Level 4 line means comparisons across level 4 lines may not be appropriate. It is recommended initially that results for higher level categories (e.g. a portfolio) are focussed on, unless there is robust data underlying the assessment of the Level 4 line.
Contact
Email: PreventionUnit@gov.scot